Research & Reviews: Journal of Material Sciences
ISSN:2321-6212
ISSN:2321-6212
Department of Mechanical Engineering, National Institute of Technology Karnataka, India.
Received date: 09/08/2018; Accepted date: 05/09/2018; Published date: 12/09/2018
DOI: 10.4172/2321-6212.1000229
Visit for more related articles at Research & Reviews: Journal of Material Sciences
In order to improve the productivity, optimization of the process parameters plays a crucial role. One such process where excellent surface finish and dimensional accuracy could be achieved is with wire electric discharge turning (WEDT). The present work focuses on analysis of means (ANOM) of WEDT process parameters. Experiments were planned based on Taguchi L18 orthogonal array. Improvement of response parameters such as surface finish was found to be 43.17% and material removal rate (MRR) of 9.5% has been obtained after performing ANOM studies. The results has been validated by performing confirmation test.
MRR, Ra, Signal to noise ratio, ANOM.
Wire electrical discharge machining (WEDM) is a spark erosion process where wire electrode is used to produce complex shapes through electrically conductive work pieces. WEDM is plays a vital role in the application of prototype parts, extrusion dies and stamping dies because of the accuracy and surface finish of the workpiece which can be attained after performing machining. WEDT is an emerging trend in the area of research where cylindrical parts of a component can be manufactured by using difficult to machine materials. By selecting the optimum parameter setting, exceptional improvement in the productivity can be achieved. It has been extensively used in automobile, aerospace and nuclear industries to produce intricate shapes from difficult to machine materials. WEDT is performed by adding a rotary axis to WEDM. Most of the researchers have studied the effect of process parameters on responses in WEDT. Janardhan et al. compared the effect of MRR of WEDM and WEDT and proved that MRR was found to be improved in case of WEDM [1] . Qu et al. compared the MRR of WEDM and WEDT by developing a mathematical model [2,3]. Haddad et alinvestigated the influence of WEDT process on output responses such as MRR and surface roughness on AISI D3 tool steel [4]. Mohammadi et al. conducted regression analysis to know the relation between the machining parameters on MRR. Janardhan and Samuel examined the effect of machining process parameters on roundness error [5-7], surface roughness and MRR by using used pulse train data analysis technique. Su et alperformed the optimization of EDM process parameters in finish cutting and rough cutting [8].
Several researchers concentrated on optimizing the process parameters of WEDT process for different work material [9-15]. Few effort has been reported to optimize the process parameters of WEDT on INCONEL 718 super alloy. It is a most widely used material in the field of wellhead components, auxiliary and down-hole tools, and sub-surface safety valves etc. because of its incredible properties such as high corrosion resistant, high stress temperature resistant and best plasticity in the heat treatment. It is very difficult to machine Inconel 718 in conventional lathe which results in poor dimensional accuracy and surface finish. Hence there is a need to optimize the process parameters of WEDT process for INCONEL 718 super alloy. In the present research work, ANOM has been performed to decide the best optimum combination levels of the control factors. Experiments were planned based on Taguchi L18 orthogonal array. The analysis of variance (ANOVA) has been performed to determine the comparative magnitude of process parameters.
The wire electric discharge turning of INCONEL 718 super alloy was conducted according to Taguchi’s L18 orthogonal array experimental design, by considering rotational speed, pulse on time, pulse off time, servo voltage, wire feed rate and flushing pressure as input parameters, material removal rate and surface roughness as output response. The control parameters and its levels are given (Table 1). The analysis of mean (ANOM) technique is used to obtain optimal process parameters which maximizes Material removal rate and minimizes surface roughness. The material MRR is expressed as the ratio of difference of work-piece weight before and after machining to the machining time and density of INCONEL 718 material given in eqn. (1) [9-11]
Table 1: Control parameters and their levels.
| Parameter | Symbol | Factor | Level 1 | Level 2 | Level 3 |
|---|---|---|---|---|---|
| Rotational speed (rpm) | N | A | 150 | 250 | - |
| Pulse on time (µs) | Ton | B | 108 | 116 | 124 |
| Pulse off time (µs) | Toff | C | 24 | 32 | 40 |
| Servo voltage (V) | SV | D | 18 | 36 | 54 |
| Wire feed rate (m/min) | Wf | E | 2 | 4 | 6 |
| Flushing Pressure (bar) | Pf | F | 1.8 | 2.0 | 2.2 |
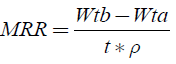 (1)
(1)
Where: Wtb-Weight of work-piece before machining in mg, Wta-Weight of work-piece after machining in mg, t-Machining Time in min, ρ-Density of INCONEL 718=8.19 g/cm3
The Surface roughness was measured by using Mitutoyo Surface roughness tester (SJ-301). The evaluation length of 2.4 mm was used to measure the surface roughness with a stylus speed of 0.5 mm/s.
ANOM and ANOVA
The analysis of means (ANOM) on signal to noise ratio (SNR) was achieved for determining the optimal setting parameters. In this study, Taguchi’s design is proposed for optimizing the multiple objecting responses, i.e. MRR and Ra. Here, MRR is to be maximized and Ra is to be minimized. Hence larger the better characteristic for MRR and smaller the better characteristic for Ra have been selected. The SN ratios associated with the responses are given as follows [12,13].
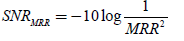 (2)
(2)
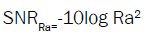 (3)
(3)
The output data of MRR, Ra and signal to noise ratio for MRR, Ra have been given in Table 2. According to analysis of mean or ANOM, further step is to averaging the obtained signal to noise ratio of material removal rate and surface roughness using eqn. (4), here the weight function used was 0.5. The obtained SNR or average SNR was ranked based on the larger the better criteria that is higher average signal to noise ratio ranked first, given in Table 2. From the ranked data it is observed that 18th experimental trial ranked first, so this trial of experiment is considered as optimal experimental trial with in the L18 experiments. Furthermore for finding optimal parameters, using average signal to noise ratio evaluated the data for each process parameter levels is given in Table 3.
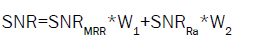 (4)
(4)
Where SNR is the average signal to noise ratio in dB, SNRMRR is the signal to noise ratio for material removal rate in dB, SNRRa is the signal to noise ratio for surface roughness in dB and W1=W2=0.5 is the weight function.
Table 2: ANOM data analysis.
| Expt No | A | B | C | D | E | F | MRR in mm3/min | Ra µm | SNRMRR dB | SNRRa dB | SNR dB | Rank |
|---|---|---|---|---|---|---|---|---|---|---|---|---|
| 01 | 150 | 108 | 24 | 18 | 2 | 1.8 | 1.2231 | 3.06 | 1.7494 | -9.7144 | -3.9825 | 6 |
| 02 | 150 | 108 | 32 | 36 | 4 | 2.0 | 0.384 | 2.93 | -8.3131 | -9.3374 | -8.82525 | 17 |
| 03 | 150 | 108 | 40 | 54 | 6 | 2.2 | 0.5571 | 1.86 | -5.0816 | -5.3903 | -5.23595 | 11 |
| 04 | 150 | 116 | 24 | 18 | 4 | 2.0 | 0.9426 | 5.77 | -0.5131 | -15.2235 | -7.8683 | 15 |
| 05 | 150 | 116 | 32 | 36 | 6 | 2.2 | 0.609 | 4.89 | -4.3084 | -13.7862 | -9.0473 | 18 |
| 06 | 150 | 116 | 40 | 54 | 2 | 1.8 | 1.3036 | 5.06 | 2.3028 | -14.083 | -5.8901 | 13 |
| 07 | 150 | 124 | 24 | 36 | 2 | 2.2 | 1.256 | 3.96 | 1.9797 | -11.9539 | -4.9871 | 9 |
| 08 | 150 | 124 | 32 | 54 | 4 | 1.8 | 2.0321 | 3.65 | 6.159 | -11.2459 | -2.54345 | 4 |
| 09 | 150 | 124 | 40 | 18 | 6 | 2.0 | 1.9065 | 3.39 | 5.6045 | -10.604 | -2.49975 | 3 |
| 10 | 250 | 108 | 24 | 54 | 6 | 2.0 | 0.613 | 4.46 | -4.2513 | -12.9867 | -8.619 | 16 |
| 11 | 250 | 108 | 32 | 18 | 2 | 2.2 | 0.5656 | 3.19 | -4.9499 | -10.0758 | -7.51285 | 14 |
| 12 | 250 | 108 | 40 | 36 | 4 | 1.8 | 0.6279 | 1.95 | -4.0426 | -5.8007 | -4.92165 | 8 |
| 13 | 250 | 116 | 24 | 36 | 6 | 1.8 | 1.6903 | 5.48 | 4.5593 | -14.7756 | -5.10815 | 10 |
| 14 | 250 | 116 | 32 | 54 | 2 | 2.0 | 2.3068 | 3.38 | 7.2601 | -10.5783 | -1.6591 | 2 |
| 15 | 250 | 116 | 40 | 18 | 4 | 2.2 | 2.3347 | 4.59 | 7.3646 | -13.2363 | -2.93585 | 5 |
| 16 | 250 | 124 | 24 | 54 | 4 | 2.2 | 1.3065 | 4.47 | 2.3225 | -13.0062 | -5.34185 | 12 |
| 17 | 250 | 124 | 32 | 18 | 6 | 1.8 | 2.3779 | 6.24 | 7.5238 | -15.9037 | -4.18995 | 7 |
| 18 | 250 | 124 | 40 | 36 | 2 | 2.0 | 3.1014 | 3.38 | 9.8312 | -10.5783 | -0.37355 | 1 |
Table 3: ANOM Optimum level.
| Symbol | Parameters | Level 1 | Level 2 | Level 3 | Optimum level |
|---|---|---|---|---|---|
| A | Rotational speed (rpm) | -5.6533 | -4.5180 | -- | 2 |
| B | Pulse on time (µs) | -6.5162 | -5.4181 | -3.3226 | 3 |
| C | Pulse off time (µs) | -5.9845 | -5.6297 | -3.6428 | 3 |
| D | Servo voltage (V) | -4.8315 | -5.5438 | -4.8816 | 3 |
| E | Wire feed rate (m/min) | -4.0675 | -5.4061 | -5.7834 | 1 |
| F | Flushing Pressure (bar) | -4.4393 | -4.9742 | -5.8435 | 1 |
Table 4 has been presents the analysis of variance for ANOM signal to noise ratio, it shows none of the parameter used in the experiment is significant because the P values in the Table 4 have more than α=0.05 of 95% confidence level.
Table 4: ANOVA for ANOM Signal to Noise Ratio.
| Source | DF | SeqSS | Adj SS | Adj MS | F | P |
|---|---|---|---|---|---|---|
| Rotational speed (rpm) | 1 | 5.800 | 5.800 | 5.8001 | 0.96 | 0.364 |
| Pulse on time (µs) | 2 | 31.592 | 31.592 | 15.7960 | 2.62 | 0.152 |
| Pulse off time (µs) | 2 | 19.114 | 19.114 | 9.5569 | 1.59 | 0.280 |
| Servo voltage (V) | 2 | 1.897 | 1.897 | 0.9485 | 0.16 | 0.858 |
| Wire feed rate (m/min) | 2 | 9.756 | 9.756 | 4.8780 | 0.81 | 0.488 |
| Flushing Pressure (bar) | 2 | 6.027 | 6.027 | 3.0135 | 0.50 | 0.629 |
| Residual Error | 6 | 36.120 | 36.120 | 6.0201 | - | - |
| Total | 17 | 110.306 | - | - | - | - |
Regression Model
From the experimental data, regression mathematical model has been developed using Minitab 17 to establish a mutual relationship between the response variable (MRR, Ra) and Wire-EDT machining parameters given in Eqns. (5) and (6).
MRR=-7.53 + 0.00523 Rotational Speed + 0.0834 Pulse on time + 0.0292 Pulse off time –
0.00570 Servo voltage - 0.0834 Wire feed rate - 1.094 Flushing pressure (5)
Ra=-1.58 + 0.00286 Rotational Speed + 0.0796 Pulse on time - 0.0726 Pulse off time - 0.0156
Servo voltage + 0.179 Wire feed rate - 1.03 Flushing pressure (6)
Confirmation Test
Analysis of mean technique presents the optimal setting parameters to achieve higher material removal rate and lower surface roughness. From the ANOM A2B3C3D3E1F1 machining parameters was selected as optimal parameters, next step is confirmation test to justify the predicted results obtained via regression model. From the confirmation test results it is conclude that about 9.5% improvement in material removal rate and about 43.17% decrement in surface roughness, presents in Table 5.
Table 5: ANOM confirmation test results
| Technique | Response | Optimal Parameters | Predicted | Experimental | Difference |
|---|---|---|---|---|---|
| ANOM | MRR(mm3/min) | A2B3C3D3E1F1 (250 rpm,124µs,40 µs,54V,2m/min, 1.8bar) |
3.0485 | 3.3720 | 0.323 |
| Surface Roughness (µm) | 4.3246 | 3.02 | 1.304 |
1. The recommended optimum setting of machining parameters through ANOM for getting maximum MRR and minimum surface roughness is found to be A2-B3-C3-D3-E1-F1 (250 rpm-124 μs -40 μs -54V-2 m/min-1.8 bar).
2. The ANOM confirmation test result shows that the material removal rate is increased by 9.5% and surface roughness decreased by 43.17%.
Authors gratefully acknowledge the support from the Department of Science and Technology (DST), Government of India, under the project reference number SERB-SB/S3/MMER/0067/2013.