Department of Statistics, Mawlana Bhashani Science and Technology University, Santosh, Tangail-1902, Bangladesh
Received Date: 12/04/2018; Accepted Date: 26/06/2018; Published Date: 05/07/2018
Visit for more related articles at Research & Reviews: Journal of Statistics and Mathematical Sciences
Several researches have shown that social media usage influence students’ academic performance. This study focus on some social media platform such as Facebook, Whatsapp, Skype, Twitter, 2go, Instagram, Badoo, to mention few that students frequently utilize in order to ascertain their influence on students’ academic performance in core subjects. The Chi-squared Automatic Interaction Detection (CHAID) decision tree technique was used to establish this relationship between explanatory and response variable; the technique is based upon adjusted significance testing and used for detection of interaction between the dependent variable (student academic performance) and the predictors. This study explores the adverse effects of such networks sites on students’ academic performance in secondary schools. The factors considered were; time spent reading, time spent on the social media site, guardian monitor of the internet, number of assignment given, purpose of internet and the kind of social media site frequently access by the students. These factors were used to ascertain academic performance of students in English language and Mathematics subjects. The results of the analysis showed that students that tends to frequent social media sites like Facebook, Whatsapp, and Instagram tends to performed on an average in the two subjects while those that frequent Skype, Twitter and 2go networks tends to perform better in the two subjects.
Internet, Social Media usage, Chisquared Automatic Interaction Detection (CHAID), Academic performance, Students
Social networking among secondary school students has become more and more popular, over the years, because it is a way to make connections between friends within and outside the school. Due to this popularity, people begin to ask questions whether the performance of students are being affected by how much time students spent on various sites of social networks [1]. Teenagers now use the internet for the majority of their daily activities and information gathering, as opposed to older generations who used resources like the television or newspaper [2]. According [3], the usage of Facebook has raised the level of anxiety among students such that they are apprehensive about being without their cell phones for a few hours. There seems to be a significant relationship between the time spent by students on social network sites and their level of academic performance. The Chi-squared Automatic Interaction Detection (CHAID) decision tree technique was first used in South Africa and was used to make prediction and classification. The techniques rely on the use of adjusted significance testing and apply for detection of interaction between variables. CHAID approach is an extension of the Automatic Interaction Detection (AID) and Theta Automatic Interaction Detection (THAID) procedures [4]. CHAID can be used to graphically display multivariate relationship and its tree structure output is simple to interpret. This approach is widely used in the areas of directing and database marketing research and makes a prediction how different group of customers responses affect the variables. CHAID uses multi-way splits by defaults, for larger sample sizes of customers group it work effectively and the reliability analysis is more than the smaller sample sizes. The tree model can be used to analyse the attributes of respondents group and then predicts the possibility that customers will use internet banking or not. The technique partitions the data into mutually exclusive, exhaustive, subsets that best describe the dependent variable prior to the one that is most significant. The subsets are established by using small groups of predictors. The selected predictors are then used in future analysis, prediction of the dependent variable, or in place of the total set in subsequent data collection.
The use of social media networks among students was aim to create room for vast knowledge enabling them to become smarter and enlighten, keeping in touch with their world even as the world is becoming a global village via the internet. Through this forum the social media sites provides, students with medium to gain better understanding in school work and career aspirations they intends to pursue through the information acquired from these sites [1]. Students have now allowed these platforms to influence their academic lives by forming a habit of procrastination which can pose a grave threat to his/her academic performance. Therefore, there is need to ascertain the effect of social media networks in relations to student academic performance by utilizing the Chi-squared Automatic Interaction Detection (CHAID) decision tree technique to establish the relationship between social media and students’ academic performance.
The overall aim of this study is to determine the effects of social media networks on Students’ academic performance.
The prior aim will be achieved through these specific objectives:
• To identify social media factors that contributes to students’ academic weaknesses.
• To ascertain the effects on academic performances (Grades) using the Chi-squared Automatic Interaction Detection (CHAID) decision tree technique.
• To enlighten teachers and parents so they can take up responsibilities to control the students in over utilizing certain social media platforms during study hours.
The use of social media internet networks sites like Facebook, 2go, Instagram, Badoo, WhatsApp, etc. have gain more popularity among secondary school students over the last few decays, because it serves as a means to establish to connections between friends within and outside the school. Due to this popularity, people begin to ask questions whether the performance of students are being affected by how much time they spent on various sites of social networks [1]. Teenagers now use the internet for the majority of their daily activities and information gathering, as opposed to older generations who used resources like the television or newspaper. According [3], the usage of Facebook has raised the level of anxiety among students such that they are apprehensive about being without their cell phones for a few hours. There seems to be a significant relationship between the time spent by students on social network sites and their level of academic performance. Some studies have found a positive relationship between using technology with elementary and or high school students and academic outcomes like standardized test scores and course grades [2]. On the other hand, some studies have found a negative relationship between technology use and academic outcomes in these settings [1]. Still other studies have found contradictory positive and negative results. In Nigeria, secondary school students are obsessed with social networking that they spend so much time on it to the extent that their academic scores suffer for it. The time students spend on social network sites also affects their participation in class which in turn bears on their academic performance [2]. Adhatrao, et al. uses the CHAID approach to study an educational institution needs in order to approximate prior knowledge of enrolled students and predict their performance in future academics [5]. The results of their analysis showed that the approach can help to identified promising students and also provides them an opportunity to pay attention to and improve those who would probably get lower grades. Ye et al., opines that the CHAID approach is a good technique in isolating certain pattern in a large population with many trends [6]. Many practical questions involve the relationship between a dependent or criterion variable of interest and a set of independent variables or potential predictor variables. In the aforementioned research works, CHAID approach have been used, due to its features; its flexibility of data analysis appropriateness whenever a quantitative variable (the dependent or criterion variable) is to be examined have categories and in relationship to any other factors (expressed as independent or predictor variables) [4]. The CHAID decision tree techniques are utilized extensively in experiments and research work that deals with exploring variables (typically predicting outcomes by using predictor variables) in market research example in targeting customers who are more likely to respond to marketing campaign, the outcome which is the dependent variable, the predictor variable which is the independent variable. Therefore, in this study, the CHAID approach was used, since there is a need to explore the variables that are more likely to influence students’ academic performance. Taking into consideration the factors that can influence students’ academic performance of students based on social media usage; surfing the internet for solutions to assignment, surfing the internet to gain more knowledge about a class subject, the awareness of parent/ guardian concerning his or her ward academic performance and usage of social media network, number of assignment given from school, hours spent reading and hours spent on the internet, which are the independent variables while the dependent variable is the academic performance (Grades of Students for instance in English language and Mathematics). With this knowledge, there is need to explore the relationship among these variables, and see how these variables may tend to influence the target variable; academic performance of students.
In research, there arises a need to solve problems, answer questions, discover new ideas and knowledge, and in carrying out a research, there are methods taken into consideration. These methods provide solutions to problems, or answers to questions aimed at solving.
Sampling is done usually because it is impossible to test every single individual in the population. It is also done to save time, money and effort while conducting the research. Sampling methods are classified as either probability or non- probability. The use of simple random sampling was employed in this study. The target population at which is the entire Senior Secondary School students (SS3) in the private schools located in Naraguta B, Jos North Local Government Area of Plateau State. A total of eleven private Secondary Schools were surveyed with a total of four hundred and fifty six SS3 students were in these schools. A sample size of five private secondary schools were used which is 45.45% of the population size of the private secondary schools in the area, and a sample size of 200 SS3 students was the targeted, which is 43.86% of the population size. A total number of 200 questionnaires were randomly distributed to the SS3 students in the five private secondary schools and the students were administered questionnaires randomly. And a total number of 142 questionnaires were gotten back which represent 31.14% of the population size. These were used for the analysis in the research.
Creating the Model (Decision Tree Analysis Model)
In creating the CHAID model, chooses the independent i.e. the predictor variable that has the strongest relations with the dependent variable (explanatory variables). More so, the categories of each independent variable are merged if they are not significantly different with respect to the dependent variable. The specifications part elicit more information on the growing method, dependent variable, independent variables, maximum tree depth, minimum number of cases in parent node and child node. The results part provides information about the independent variables as used in the model, number of nodes, number of terminal nodes and the depth f the tree [7]. Ch et al., opines that CHAID is an algorithm that performs the multiway split by adopting the Chi-square or F-test approach [8]. The CHAID algorithm utilizes the Pearson’s Chi-square when a target variable is categorical and uses likelihood ratio Chi-square statistic is viewed as a separation reference in a target variable that is continuous.
The Chi-Square is derived from ( fii ) partition table which is made up of ( fii ) observations. The Pearson’s Chi-Square Statistic is given by:
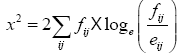 (1)
(1)
While when the target variable is continuous, the Likelihood ratio Chi-Square Statistic is given by:
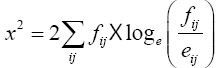 (2)
(2)
In this stance, the Chi-square Statistic is very smaller than the degree of freedom, which implies that the distributions of the target variables for each category of the predictor variable are the same. Therefore, one can conclude that the predictor variable does not affect the classification of target variables. The magnitude of the chi-square statistic for the degree of freedom is usually expressed in form of a P-value. Note: when the Chi-square Statistic is smaller than the degree of freedom, the value of p increases. As a matter of fact, using Chi-square Statistic as a separation reference means that the child node is formed by the predictor variable with the smallest p value and the optimum separation [4].
In the present study all explanatory variables including outcome variables are treated as categorical variables in order to minimize the convenience of CHAID algorithm as much as possible [8]. Also in the model for this study, the separation and merge criterion of the decision rule for CHAID algorithm was set as 0.05 and the numbers of parent nodes, child nodes, and branch were limited to 15, 10, and 2, as the case may be. The validity of the model was ascertained using a 10-fold cross-validity test and the degrees of model’s risk were compared for misclassification errors.
A statistical hypothesis test is a method of making decisions using data, whether from a controlled experiment or an observational study (not controlled). In statistics, a result is called statistically significant if it is unlikely to have occurred by chance alone. The hypotheses for this research are all stated in their null form as follows:
H0: There is no significance relationship between the predictor variables and the response variable (Academic performance in English).
H0: There is no significance relationship between the predictor variables and the response variable (Academic performance in Mathematics)
Here H0 is the overall null hypothesis, which states that none of the X variables are related to Y. The alternative one shows that at least one is related.
The data gotten from the questionnaires were analysed using the following software:
• SPSS- Statistical Package For Social Sciences now known as PASW (Predictive Analyst Software)
• Minitab
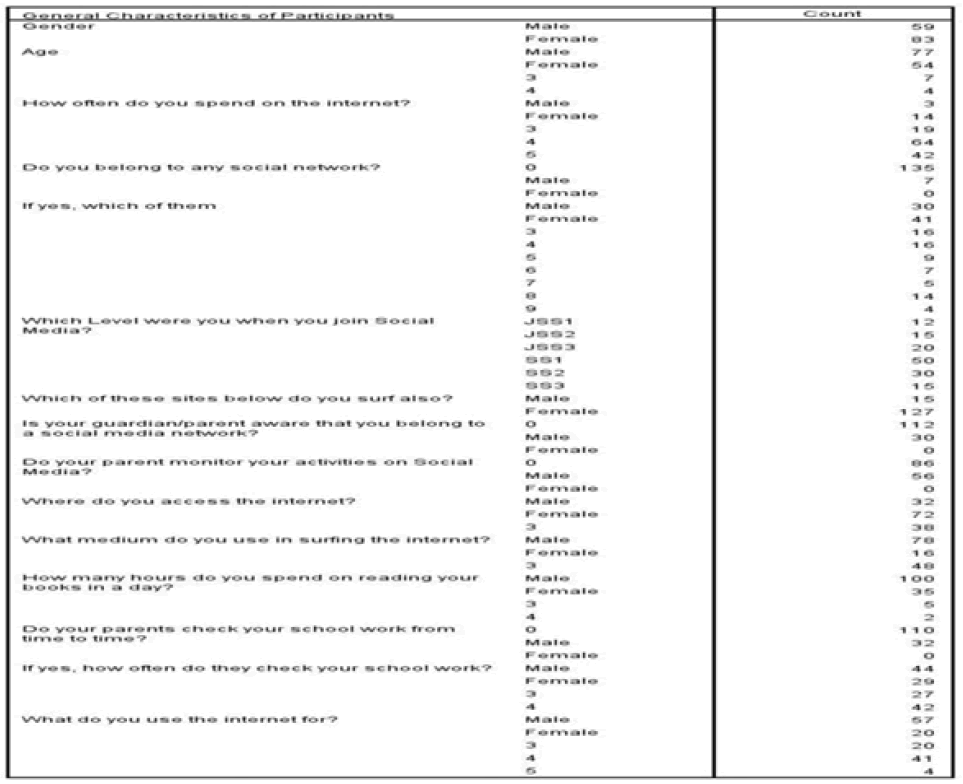
Consider the Screenshots of demographic table below for the participant surveyed for this study:
The CHAID decision tree Diagram for English language Performance is given below
The CHAID decision tree diagram for Mathematics grades is illustrated below:
Considering the decision tree diagram for the result of Students’ performance tin English Language. The first node is a simple frequency showing the grades categories of the students in English language examination. One can clearly see that 4.2% (6) of the students got grade F, 3.5% (5) got grade E, 12% (17) got grade D, 38% (54) got grade C, 13.4% (19) got grade B and 28.9% (41) got grade A. A little down the node showed that the response to the question are you on any social media network? if Yes which of them (WhatsApp, Facebook, Instagram, etc.) have drastic effects on students’ performance in English language. This shows that internet usage is the best predictor variable for students’ academic performance (Grades) as it is the most
Important variable with an Adjusted P-value = 0.000 which is significant at the 5% level of significance and a Chi-Square  with 1 Degree of Freedom. The next important variable to take note of from the decision tree in the second node
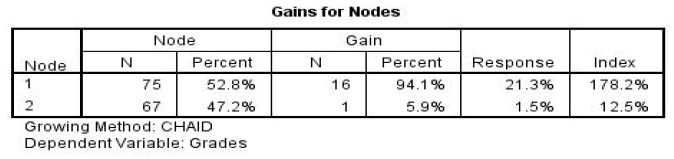
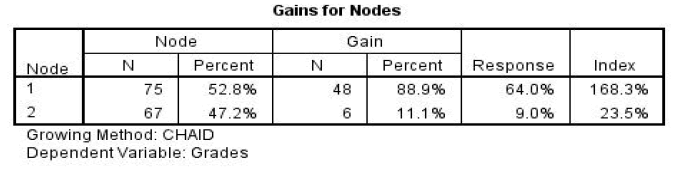
is the variables: Facebook, Whatsapp, Other which have significant effects on Students’ performance in English language. The
decision tree showed that students that uses these internet platform performed most average. 8% (6) have F grades, 5.3% (4) E
grades, 21.3% (16) D grades, 64% (48) C grades, 0% (0) B grade and 1.3% (1) A grade. Whereas their counterpart that utilizes
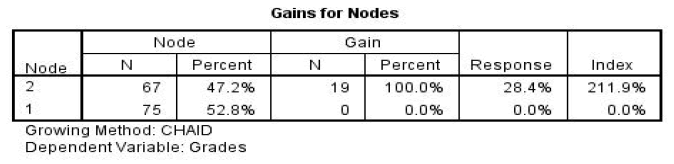
social media platforms like 2go, Twitter, Badoo, Instagram, Palm Play and Skype had 0% F grade, 1.5% E and D grades, 9% C
grades, 28.4% B grades and 59.7% A grades. These sets of students tends to performed better even though little do one know
about why they tend to score higher but there are chances that their parent put a restriction on the limit they send online, they
used it for Educational purposes, their parent checked their notes throughout the semester or other factors that have not been
included in the scope of this study. Note: The terminal nodes constitute different characteristics of the students’ academic performance
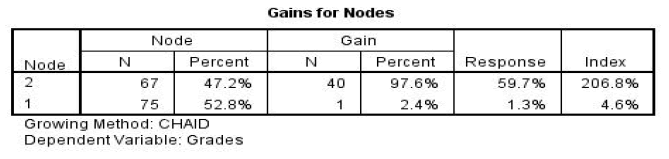
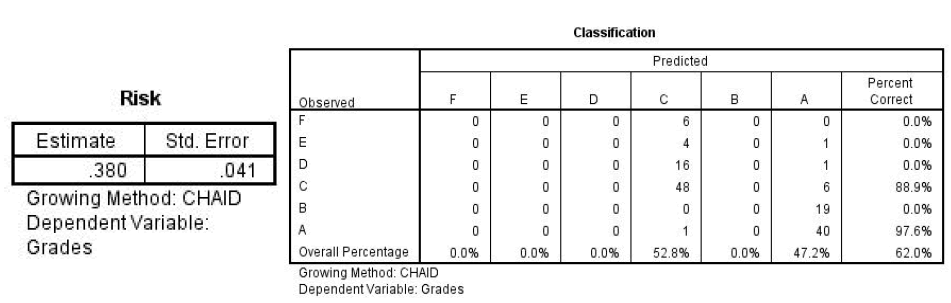
based on the internet platform they frequently utilized. Next, consider the decision table; the two tables shade more light
about the performance of the model. The risk estimate is 0.380 which indicates the order in which the model predict students’
academic performance incorrectly is 38% of the cases. This is verified from the classification table which gives the overall percentage
of 62% for correct classification for the model. Looking at the second table, C is being predicted 88.9% and A 97.6% correctly.
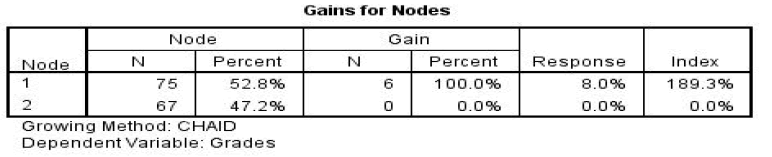
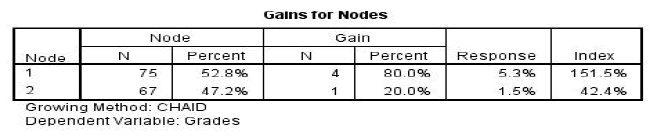
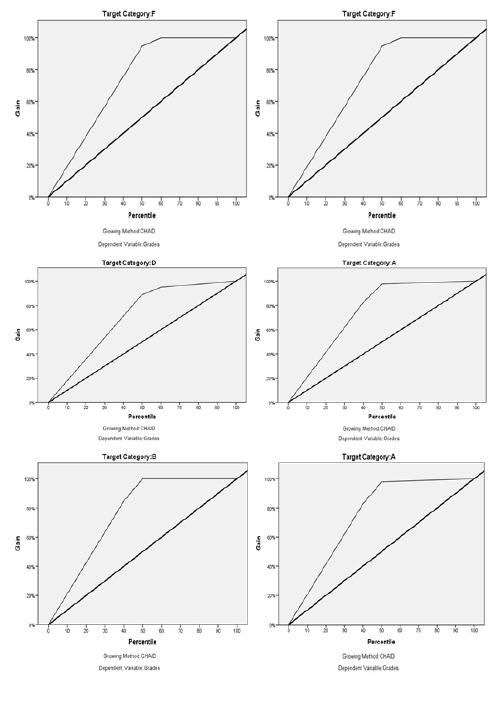
The gain chart is another way of looking at the power of the model. The model is compared against a random. The diagonal line
represents model of students’ grades: A, B, C, D, E, F. The greater the distance from the diagonal the more it exert gain for instance
if one randomly select 50% of the students’ academic performance in English language for category F, then one cam be able to
ascertain the number of students that got F grades as a results of utilizing certain social media internet platforms.
with 1 Degree of Freedom. The next important variable to take note of from the decision tree in the second node
is the variables: Facebook, Whatsapp, Other which have significant effects on Students’ performance in English language. The
decision tree showed that students that uses these internet platform performed most average. 8% (6) have F grades, 5.3% (4) E
grades, 21.3% (16) D grades, 64% (48) C grades, 0% (0) B grade and 1.3% (1) A grade. Whereas their counterpart that utilizes
social media platforms like 2go, Twitter, Badoo, Instagram, Palm Play and Skype had 0% F grade, 1.5% E and D grades, 9% C
grades, 28.4% B grades and 59.7% A grades. These sets of students tends to performed better even though little do one know
about why they tend to score higher but there are chances that their parent put a restriction on the limit they send online, they
used it for Educational purposes, their parent checked their notes throughout the semester or other factors that have not been
included in the scope of this study. Note: The terminal nodes constitute different characteristics of the students’ academic performance
based on the internet platform they frequently utilized. Next, consider the decision table; the two tables shade more light
about the performance of the model. The risk estimate is 0.380 which indicates the order in which the model predict students’
academic performance incorrectly is 38% of the cases. This is verified from the classification table which gives the overall percentage
of 62% for correct classification for the model. Looking at the second table, C is being predicted 88.9% and A 97.6% correctly.
The gain chart is another way of looking at the power of the model. The model is compared against a random. The diagonal line
represents model of students’ grades: A, B, C, D, E, F. The greater the distance from the diagonal the more it exert gain for instance
if one randomly select 50% of the students’ academic performance in English language for category F, then one cam be able to
ascertain the number of students that got F grades as a results of utilizing certain social media internet platforms.
Click back to the data view, two variables columns were created, the terminal node number and the predicted variable. The
terminal node identification refers to the different segment of student grades based on each internet platform (social media) the
subscribed to utilize. It constitutes very useful information in finding out some of the segments (social media platforms) that the
students utilize most and its effects on their performance. This calls for drastic measures to be taken to minimize its effects on
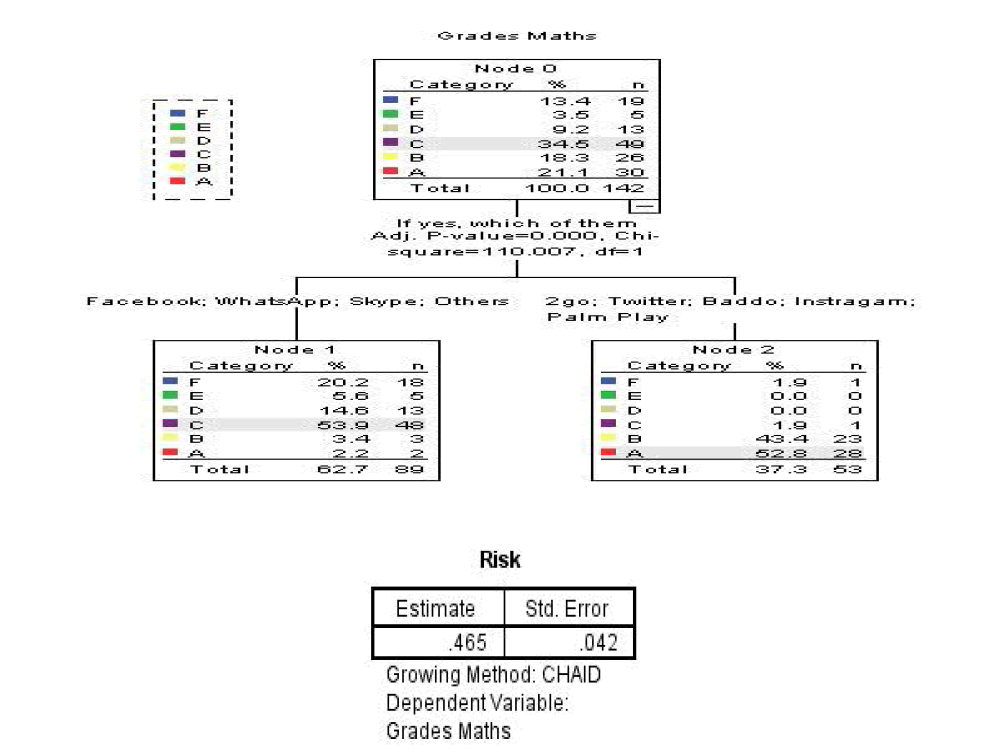
their academic lives. Similarly, looking at the decision tree diagram for students’ academic performance in Mathematics; Internet
utilization by the students had critical significant effects on their performance as it showed the Adjusted P-value = 0.000, Chi-
Square,  ,
, which means it is significant at the 5% levels of significance. Students that frequent the use of
Facebook, Whatsapp, Skype, Others: 20.2% (18) of them have F grade, 5.6% (5) have E grade, 14.6% (13) have D grade, 53.9%
(48) have C grade, 3.4% (3) have B grade and 2.2% (2) have A grade. On the other hand, students that utilizes 2go, Twitter, Badoo,
Instagram and Palm Play: 1.9% (1) had F grade, 0.0% (0) have E and D grades, 1.9% (1) had C grade, 43.4% (23) have B grade
and 52.8% (28) have A grade. Again this showed that these students tend to perform better in Mathematics than their counterpart
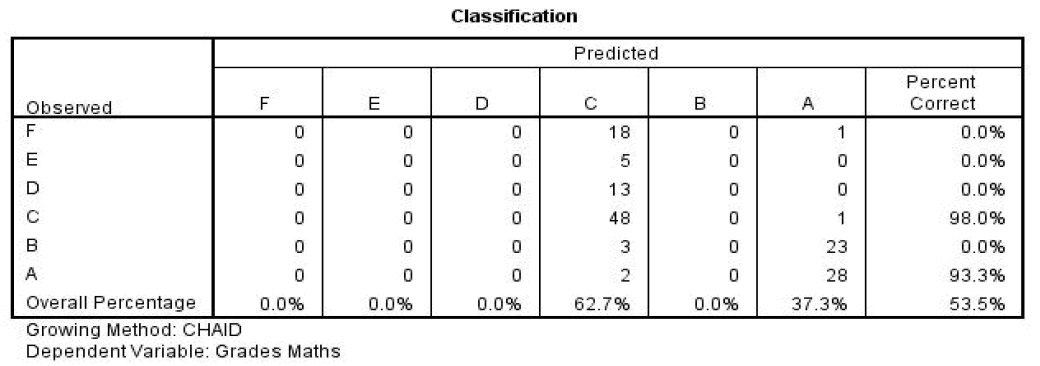
that utilizes other platforms. The risk table showed that 46.5% of the model is misclassified and verified from the classification
table, the overall percentage showed that 62.7% of C grade is classified correctly. 37.3% of A grade is classified correctly and in
all 53.5% of the grades were classified correctly.
which means it is significant at the 5% levels of significance. Students that frequent the use of
Facebook, Whatsapp, Skype, Others: 20.2% (18) of them have F grade, 5.6% (5) have E grade, 14.6% (13) have D grade, 53.9%
(48) have C grade, 3.4% (3) have B grade and 2.2% (2) have A grade. On the other hand, students that utilizes 2go, Twitter, Badoo,
Instagram and Palm Play: 1.9% (1) had F grade, 0.0% (0) have E and D grades, 1.9% (1) had C grade, 43.4% (23) have B grade
and 52.8% (28) have A grade. Again this showed that these students tend to perform better in Mathematics than their counterpart
that utilizes other platforms. The risk table showed that 46.5% of the model is misclassified and verified from the classification
table, the overall percentage showed that 62.7% of C grade is classified correctly. 37.3% of A grade is classified correctly and in
all 53.5% of the grades were classified correctly.
The results of the analysis clearly showed that the use of Social media have significant effects on students’ academic performance in both subjects via; English language and Mathematics. Therefore, reject the null hypothesis at the 5% level of significance and concluded that there is a significance relationship between the predictor variables and the response variable (performance in English language and Mathematics). It is worthy to note that in both decision trees, Facebook and Whatsapp have shown to have negative effects on students’ academic performance. There is every need for parents and Guidance, Teachers, Administrators, etc. to monitor students especially a world that is gradually drifted into web world. These platforms when explore in a negative way can infringed on students’ academic reading hours, thereby making them perform woefully in core subjects like Mathematics and English. It is also worthy to note that social media is not the only factor that affects students’ academic performance in school, other factors may arise which gives birth to further researches. Therefore, it will be recommended that further research may be carried out using powerful data mining tools like Support Vector Machine, Discriminant Analysis or Perhaps the Big Data analytics to keep a 360 degree check on students in their academic environment this will help to incorporate other factors like psychological depression, habits, etc.