Keywords
|
| Content-based image retrieval, image classification, un-supervised learning, spectral graph clustering |
INTRODUCTION
|
| The steady growth of the Internet, the falling price of storage devices, and an increasing pool of available computing power make it necessary and possible to manipulate very large repository of digital information efficiently (CBIR) aims at developing techniques that support effective searching and browsing of large image digital libraries based on automatically derived image features. Although CBIR is still immature, there has been abundance of prior work. Due to space limitations, we only review work most related to ours, which by no means represents the comprehension list. |
Previous work
|
| In the past decade, many general purpose image retrieval systems have been developed. Examples include Q-BIC systems[6],Photo book System[16],Blobworld System [3],Visual SEEK and Web SEEK Systems[20],the Pi-cHunter system[5],NeTra system[14],MARS Systems, and SIMPLIcity Systems[22] A typical CBIR system views the query image and images in the database(target images) as a collection of features and ranks the relevance between the query image and any target images in proportion to feature similarity non ethiless, the meaning of an image is rarely selfevident Images with high feature similarity to the query image may be very different from the query in terms of the interpretation made by a user. This is referred to as the semantic gap, which reflects the discrepancy between the relatively limited descriptive power of low level imagery features and the richness of user semantics. Depending on the degree of user improvement in the retrieval process, generally, two classes of approaches have been proposed to reduce the semantic gap: relevance feedback and image database preprocessing using statistical classification . A relevancefeedback- based approach allows a user to interact with the retrieval algorithm by providing the information of which images he or she thinks are relevant to the query [5, 17]. Based on the user feedbacks, give a better approximation of the perception subjectivity. Empirical results demonstrate the effective-ness of the relevance feedback foe certain applications. Nonetheless such a system may add burden to a user especially when more information is required than Boolean feedback. Statistical classification methods group images into semantically meaningful categories sing low level visual feature so that semantically-adaptive searching methods applicable to each category can be applied [18, 21, 22, and 12]. For example, WebQuery system [18] categories images into different set of clusters based on their heterogeneous features.Vailaya et al. [21] organize vacation images into a hierarchical structure. At the top-level, images are classified as indoor or outdoor. Outdoor images are then classified as city or landscape that is further divided into sunset, forest, and mountain classes. The simplicity system [22] classifies photograph, and thus narrows down the searching space in database. ALIP system uses categorized images to train hundreds of two-dimensional multi resolution hidden Markov models each corresponding to a semantic category. Although these classification methods are successful in their specific domains of application, the simple ontology built upon them could not incorporate the rich semantics of a sizable image database. There has been work on attaching object on region -term- cooccurrence. But as noted by authors the algorithm relies in semantically by an algorithm is still an open problem in computer vision[19,23]. |
Motivation
|
| Figure 1 shows a query image and the top 29 target im-agers returned by a CBIR system described in [4] where the query image is on the upper -left corner. From left to right and top to bottom, the target images are ranked accordingly to decreasing values of similarity measure. In essence, this can be viewed as a one-dimensional visualization of the image database in the neighborhood of the query using a similarity measure. If the query and majority of the images in the “vicinity” have the same semantics, then we would expect good results. But target image may be quite different from the query image in terms of semantic gap. For the example in figure 1, the target images belong to several semantic classes where the dominant ones include horses, flowers, golf player, and vehicle. However, the majority of top matches belong to a quite small number of distinct semantic classes, which suggest a hypothesis that, in the vicinity of the query image than to images of different semantics. Or, in other words, images tend to be semantically clustered. Therefore, a retrieval method, which is capable of capturing this structural relationship, may render semantically more meaningful similarity measure. Similar hypothesis has been well studied in document retrieval where strong supporting evidence has been presented. This motivates us to tackle the semantic gap problem from the perspective of un supervisse learning. In this paper , we propose an algorithm, CLUster-based rEtreival of images by unsupervised learning(CLUE), to retrieve image clusters instead of a set of ordered images: the query and neighboring target images, which are selected according to a similarity measure, are clustered by an unsupervised learning method and returned to the user. In this way, relations among retrieved images are taken into consideration through clustering and may provide extra information for ranking and presentation. CLUE has the following characteristics: |
| •It is a cluster-based image retrieval scheme that can be used as an alternative to retrieving a set of ordered images. The images clusters are obtained from an unsupervised learning process based on not only the feature are similar to each other. In this sense, CLUE aims capture the underlying concepts about how images of the same semantics are alike and present to the users semantic relevant clues to where to navigate. |
| • It is a similarity-driven approach that can be built upon virtually any symmetric real-valued image similarity measure. Consequently, our approach could be combined with many others retrieval schemes including the relevance feed-back approach with dynamically updated mod-els similarity measure. |
| • It provides a dynamic and local visualization of the image database using a clustering technique. The clusters are created depending on which images are retrieved in response to the query. Consequently, the clusters have the potential to be closely adapted to characteristics of a query image.Moreover, by constraining the collection of retrieved images to the neighborhood of the query image, clusters generated by CLUE provides a local approximation of t-he semantic structure of the whole image database. Although the overall semantic structure of the database could be very complex and extremely difficult to identify by a computer program, locally it may be well described by a simple approximation such as clusters. This is in a contrast to current image database statistical classification methods in which the semantic categories are derived fo-r the whole database in a preprocessing stage, and there-fore are global, static, and independent of the query. |
Outline of the paper
|
| The remainder of the paper is organized as follows. Section 2 describes the general methodology of CLUE. Section 3 provides the experimental result. We conclude in section 4, together with a discussion of future work. |
RETRIEVAL OF IMAGE CLUSTERS
|
System Overview
|
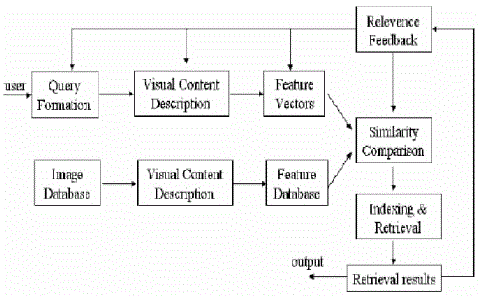
| For the purpose of simplifying the explanations, we call a CBIR using CLUE a Content- Based Image Clusters Retrieval (CBICR) system. From a data-flow viewpoint, a general CBCIR system can be characterized by the diagram in Figure 2. The retrieval process starts with feature extraction for a query image. The feature for target images (images in the database) are usually precomputed and stored as features files. Using these features together with an image similarity measure, the resemblance between the query image and target images are evaluated and sorted. Next, collections of target images are close to the query image are selected as the neighborhood of the query image. A clustering algorithm is then applied to these target images. Finally, the system displays the image clusters and adjusts the similarity model according to user feedback. |
| The major difference between CBICR and CBIR systems lies in the two processing stages, selecting neighboring target images and image clustering, which are the major components of CLUE. A typical CBIR system bypasses these two stages and directly outputs the sort-ed results to the display and feedback stage. Figure 2 suggests that CLUE is the sorted similarity. This implies that CLUE may be embedded in a typical CBIR system regardless of the image features being used, the sorted method, and whether there is feedback or not. As a result in the following subsections, we focus on the discussion of general methodology of CLUE, and assume that a similarity measure is given. |
Neighboring Target Images Selection
|
| To mathematically define the neighborhood of a point, we need to first choose a measure of distance. As to images, the distance can be defined by either a similarity measure (a larger value indicates a smaller distance). Because simple algebraic operations can convert a similarity measure into a dissimilarity measure, without loss of generality ,we assume that the distance between two im-ages is determined by a symmetric dissimilarity measure d(i,j)=d(j,i)≥0,name d(i,j) the distance between images i and j to simplify the notation. |
| Next we propose two simple methods to select a collec-tion of neighboring target for query image i: |
| 1. Fixed radius method (FRM) takes all target images within some fixed £ with respect to i. For a given query image, the number of neighborhood target images is determined by £. |
| 2. Nearest neighbors method (NNM) first chooses k nearest neighbors of I as seeds. The nearest neighbors for each seed are then found. Finally, the neighboring target images are selected to be all the distinct target images among seeds and their r nearest neighbors. |
| If the distance is metric, both methods will generate similar results under proper parameters (£,k and r).How-ever, for non-metric distances, especially when the triangle selected by two methods could be quite different regardless of the parameters. This is due to the violation of the triangle inequality: the distance two images could be huge even if both of them are very close to a query image .The NNM is used in this work. Compared with the FRM, our empirical results show that, with proper choices of k and r the NNM tends to generate more structured collection of target images under a non-metric distance. On the other hand, the FRM because of the extra time to find nearest neighbors for all k seeds. The time complexity can be reduced at the price of extra storage space. |
Weighted Graph Representation and Spectral Graph Partitioning.
|
| Data representation is typically the first step to solve any clustering problem. In the field of computer vision two types of representations are widely used. One is called the geometric representation, in which data items are mapped to some real normed vector space. The other is the graph representation. It emphasizes the pair wise relationship, but is usually short of geometric representation has a major limitation: it requires that the images be mapped to points in some normed vector space. Overall this is a very restrictive constraint. For example, in region- based algorithm [4, 13, 22], an image is often viewed as a collection of regions. The number of region may vary among vector space, it is in general impossible to do so for images unless the distance between images is metric, in which case embedding feasible. Nevertheless, many distances for images are non-metric for reasons given |
| Therefore, this paper adopts a graph representation of neighboring target images. A set of n images is represented by a weighted undirected graph G=(V,E): the node V={1,2,….,n} represent images, the edges E={( i,j):i,j€V are formed between every pair of nodes, and the non-negative weight wi,j of an edge (i,j), indicating the simil-rity between two nodes, is a function of the distance(or similarity) between nodes (images) i and j. Given a distance d (i,j) between images i and j.The weights can be organized into a matrix W, named the affinity matrix,width the ji-th entry given by wij. Although it is a relatively simple weighting scheme, our experimental results have shown its effectiveness. The same scheme has been used in [8, 19]. Supports for exponential decay from phycolo-gical studies are also provided. |
| Under graph representations, clustering can be n-aturally formulated as a graph partitioning problem. A-mong many graph-theoretic algorithms, this paper uses the normalized cut (Ncut) algorithm [19] for image clustering. Roughly speaking Ncut method attempts to organize nodes into groups so that the within –group similarity is high, and/or the between graph similarity is low. Compared with many other spectral age partiotioning methods, such s average cut and average associate-on, the Ncut method is empirically shown to be relatively robust in image segmentation [19]. The Ncut method can be recursively applied to get more than two clusters. But this leads to the questions: 1) which sub graph should be divided? And 2) when should the process stop? In this paper, we use a simple heuristic. Each time the sub-graph with the maximum number of nodes is partitioned. The process terminates when the bound on the number of clusters is reached or the Ncut value exceeds some threshold T. |
Finding Representative Images
|
| Ultimately, the system needs to present the image cl-usters to the user .Unlike a typical CBIR system, which displays certain numbers of top matched target images to the user; a CBICR system should be able to provide an intuitive visualization of the clustered structure in addit -ion to all the retrieved target images. At the first level, the system shows a collection of representation images of all the clusters. At the second level, the systems display all target images within the cluster specified by user. Nonetheless two questions still remain: 1) how to organ-ze these clusters? And 2) how to find a representative image for each clusters? The organization of clusters will be described in Section 2.5 For the second question , we define a representative image of a cluster to be the image that is most similar to all images in the clusters. This statement can be mathematically illustrated as follows Given a graph representation of images G=(V,E) with affinity matrix ,let the collection of image clusters {c1,c2,…cn} be a partition |
 of V. The representative node image of Ci is of V. The representative node image of Ci is |
| Σwjt |
| Basically, for each cluster, we pick the image that has the maximum sum within cluster similarities. |
Organization of Clusters
|
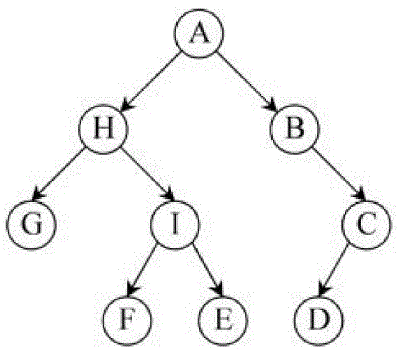
| The recursive Ncut partition is essentially a hierarchical divisive clustering process that produces a tree. For exa-mple Figure 2 shows a tree generated by four Ncuts. The first Ncut divides A into H and B. Since H has more no-des than B, the second Ncut partitions H into G and I. Next, I is further divided because it is larger than H and C. The fourth Ncut is applied to A, and gives the final four clusters (or leaves): G, F, E, D. |
| The above example suggests trees as a natural organization of clusters. Nonetheless, the tree organization here may be misleading to a user because there is no guarantee of any correspondence between the tree and the semantic structure of images. Furthermore, organizing image clusters into a tree structure will significantly complicate the user interface. So, in this work, we employ a simple linear organization of clusters called traversal ordering: arrange the leaves in the order of a binary tree traversal (left child goes first). The order of two clusters produced by an Ncut iteration is decided by an arbitration rule: 1) let H and B be two clusters ge-nerated by an Ncut on A and d1 (d2) be the minimal distance between the query image and all images in H (B); 2)if d1<d2 then H is the left child of A, otherwise, B is the left child. Under the traversal ordering and arbitration rule, the query image is in the leftmost leaf since a cluster containing the query image will always be assigned to the left child. For the sake of consistency, images within each cluster are also organized in ascending order of distances to a query. |
EXPERIMENTS
|
User Interface
|
| Our experimental CBICR system uses the same feature extraction scheme and UFM similarity measure as those in [4]. The system is implemented with a general purpose image database (from COREL), which includes about 60,000 images. The system has very simple CGI-based query interface. It provides a Random option that will give a user a random set of images from the image database to start with. In addition, users can either enter the ID of an image as the query or submit any image on the Internet as a query by entering the URL of the image. Once a query image is received, the system displays a list of thumbnails each of which represents an image cluster. The thumbnails are found according to (1), and sorted using the algorithm described in Section 2.5. A user can view all images in the associated cluster by clicking a thumbnail. |
| To qualitatively evaluate the performance of the system over 60,000 images COREL database, we randomly pick five query images with different semantics, namely, birds, car, food, historical buildings and soccer game. For each query example, we examine the precision of the query results depending on the relevance of the image semantics. Here only images in the first cluster, in which the query image resides, are considered. This is because images in the first cluster can be viewed as sharing the same similarity-induced semantics as that of the query image according to the clusters organization. |
| Since CLUE is built upon UFM similarity measure, query results of a typical CBIR system, SIMPLIcity system using UFM similarity measure [4] (we call the system UFM to simplify notation), are also included for comparison. We admit that the relevance of image semantics depends on standpoint of a user. Therefore, our relevance criteria, specified in Fig, may be quite different from those used by a user of the system. Due to space limitations, only the top 11 matches to each query are shown. We also provide the number of relevant images in the first cluster (for CLUE) or among top 31 matches. |
| Compared with UFM, CLUE provides semantically more precise results for the queries given in Figure 4. This is reasonable since CLUE utilizes more information about image similarities than UFM does. CLUE groups images into clusters based on pair wise distances so that the within-cluster similarity is high; and between-clusters similarity is low. The results seem to indicate that, to some extent, CLUE can group together semantically similar images. |
Systematic Evaluation
|
| To provide a more objective evaluation and comparison, CLUE is tested on a subset of the COREL database, formed by 10 image categories, each containing 100 images. The categories are Africa, Beach, Buildings, Buses, Dinosaurs, Elephants, Flowers, Horses, Mountains, and Food with 1 to 10 respectively. Within this database, it is known whether two images are of the same semantics. Therefore we can quantitatively evaluate and compare the performance of CLUE in terms of the goodness of image clustering and retrieval accuracy. In particular, the goodness of image clustering is measured via the distribution of images semantics in the cluster, and a retrieved image is considered a correct match if and only if it is the same category as the query image These assumptions are reasonable since the 10 categories were chosen so that each depicts a distinct semantic topic. |
Goodness of Image Clustering
|
| Ideally, CLUE would be able to generate image clusters each of which contains images of similar or even identical semantics. The confusion matrix is one way to measure the number of clusters needs to be equal to the number of distinct semantics, which is unknown in practice. |
Query Examples
|
 |
| Although we can force CLUE to always generate 10 clusters in this particular experiment, the experiment setup would then be quite different to a real application. So we use purity and entropy to measure the goodness of image clustering. |
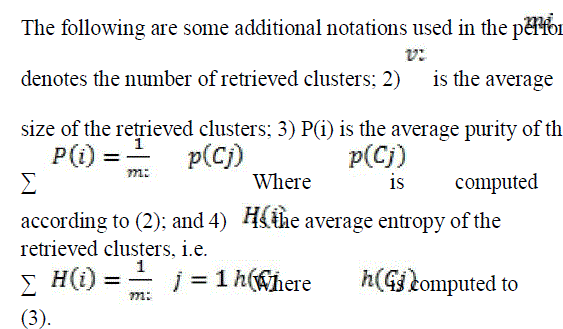
| Assume we are given a set of images belonging to c distinctive categories (or semantics) denoted by 1, c (in this experimental c≤10 depending on the collection of images generated by NNM) while the images are groups into m clusters Cj,j=1,..m .Purity for Cj is defined as |
 |
Where  consists of images in Cj belongs to category k and |Cj| represents the size of the set. Each cluster may contain images of different semantics. Purity gives the ratio of the dominant semantic class size in the cluster to the cluster size itself. The value of purity is always in the consists of images in Cj belongs to category k and |Cj| represents the size of the set. Each cluster may contain images of different semantics. Purity gives the ratio of the dominant semantic class size in the cluster to the cluster size itself. The value of purity is always in the  with a larger value means that the cluster is a “purer” subset of the dominant semantic class. Entropy is another cluster quality measure, which is defined as follows: with a larger value means that the cluster is a “purer” subset of the dominant semantic class. Entropy is another cluster quality measure, which is defined as follows: |
Σ  |
| Since entropy considers the distribution of semantic classes in a cluster, it is a more comprehensive measure than purity. Note that we have normalized entropy so that the value is between 0 and 1. Contrary to the purity measure, an entropy value near 0 means the cluster is comprised mainly of 1 category, while an entropy value close to 1 implies that the cluster contains a uniform mixture of all categories. |
 |
| Every image in the 1000- image database is tested as a query. For query images within one semantic category, the following statistics are computed: the mean of mi, the mean and standard deviation (STDV) of the mean of h (i). In addition, we calculate Pnnm and Hnnm for each query, which are respectively the purity and entropy of the whole images, generated by NNM and the mean of the Pnnm and Hnnm for the query images within one semantic category. The results are summarized in Table 1 (second and third columns) and Figure 5. The third column of Table 1 shows that the size of clusters does not vary greatly within a category. This is because of the heuristic used in recursive Ncut: always dividing the largest cluster. It should be observed from Figure 5 that CLUE provides good quality clusters in the neighborhood of a query image. Compared with the purity and entropy of collections of images generated by NNM, the quality of the clusters generated by recursive Ncut is on average much improved for all categories except Category 5, for which NNM generates quite pure collections leaving little room for improvement |
CLUE Results
|
 |
| (a) 9 matches out of 11. |
 |
| (b) 7 matches out of 9. |
UFM Results
|
 |
| (a) 5 matches out of 15 |
 |
 |
| (b) 4 matches out of 11 |
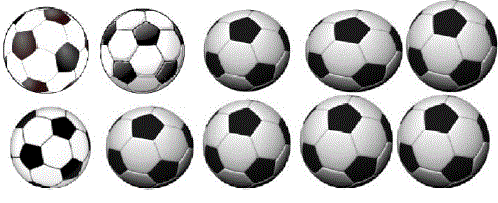
| This figure: Comparison of CLUE and UFM. The query image is the upper-left corner image of each block of images. The underlined numbers below the images are the ID numbers of the images in the database. For the images in the left column, the other number is the cluster ID (the image with a border around it is the representative image for the cluster). For images in the right column, the other two numbers are the value of UFM measure between the query image and the matched image, and the number of regions in the image. |
| (a) Sunrise (b) ball (c) parrot (d) historical buildings. |
Retrieval Accuracy
|
| For image retrieval, purity and entropy by themselves may not provide a comprehensive estimate of the system performance even though they measure the quality of image clusters. Because what could happen is a collection of semantic manically pure image clusters but none of them sharing the same semantics with the query image. Therefore one needs to consider the semantic relationship between these image clusters and the query image. For this purpose, we introduce the correct categorization rate and average precision |
| We call a query image being correctly categorized if the query category dominates the query image cluster. The correct categorization rate, Ct, for image category t is defined as the percentile of images in category t that are correctly categorized when used as queries. It indicates how likely the dominant semantics of the first cluster coincides with the query semantics. The fourth column of Table 1 lists estimations of CT for 10 categories used in our experiments. Note that randomly assigning a dominant category to the query image cluster will give a Ct of value around 0.1 |
| From the standpoint of a system user, Ctmay not be the most important performance index. Even if the first cluster, in which the query image resides, does not contain any images that are semantically similar to the query image, the user can still look into the rest clusters. So we use precision. |
| To measure how likely an user would find images belonging to the query category within a certain number of top matches. Here the precision is computed as the percentile of images belonging to the category of query image in the first 100 retrieved images. The recall equals precision for this special case since each category has 100 images . The parameters in the NNM are set to be 30 to ensure that the number of neighboring images generated is greater than 100. As mentioned in Section 2.5, the linear organization of clusters may be viewed as a structured sorting of clusters in ascending order of distances to a query image. Therefore the top 100 Retrieved images are found according to the order of clusters. The average precision for a category t is then defined as the mean of precisions for query images in category. |
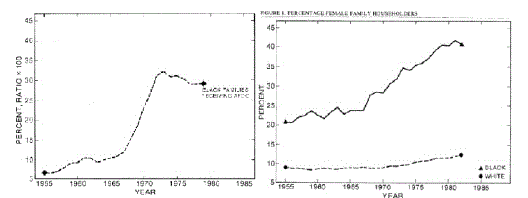 |
| Category t is then defined as the mean of precisions for query images in category t. Figure compares the average precisions given by CLUE with those obtained by UFM. Clearly, CLUE performs better than UFM for 9 out of 10 categories (they tie on the remaining one category). The overall average precisions for 10 categories are 0.538 for CLUE and 0.477 for UFM. |
Speed
|
| CLUE has been implemented on a Pentium III 700MHz PC running Linux operation system. To compare the speed of CLUE with UFM [4], which is implemented and tested on the same computer, 100 random queries are issued to the demonstration web sites. CLUE takes on average 0.8 second per query for similarity measure evaluation, sorting, and clustering, while UFM takes 0.7 second to evaluate similarities and sort the results. The size of the database is 60, 000 for both tests. Although CLUE is slower than UFM because of the extra computational cost for NNM and recursive Ncut, the execution time is still well within the tolerance of real-time image retrieval. |
CONCLUSIONS AND FUTURE WORK
|
| This paper introduces CLUE, a novel image retrieval scheme, based on a rather simple assumption: semantically similar images tend to be clustered in some feature space. CLUE at tempts to retrieve semantically coherent image clusters from unsupervised learning of how images of the same semantics are alike. The empirical results suggest that this assumption seems to be reasonable when target images close to the query image are under consideration. CLUE is a general approach in the sense that it can be combined with any real-valued symmetric image similarity measure (metric or non-metric). Thus it may be embedded in many current CBIR systems. The application of CLUE to a database of 60, 000 general-purpose images demonstrates that CLUE can provide semantically more meaningful results to a system user than an existing CBIR system using the same similarity measure. Numerical evaluations show good cluster quality and improved retrieval accuracy. |
| CLUE has several limitations. |
| •The current heuristic used in the recursive Ncut always bipartitions the largest cluster. This is a low-complexity rule. But it may divide a large and pure cluster into several clusters even when there exists a smaller and semantically more diverse cluster. |
| •The current method of finding a representative image for a cluster does not always give a semantically accurate result. For the example in Figure 4(a), one would expect the representative image to be a bird image. But the system picks an image of sheep. |
| • If the number of neighboring target images is large, scarcity of the unity matrix becomes crucial to retrieval speed. The current weighting scheme does not lead to a sparse a unity matrix. |
| One possible future direction is to integrate CLUE with keyword- based image retrieval approaches. Other graph theoretic clustering techniques need to be tested for possible performance improvement. CLUE may be combined with nonlinear dimensionality reduction techniques. CLUE may also be useful for image understanding. As future work, we intend to apply CLUE to search, browse, and learn concepts from digital imagery for Asian art and cultural heritages. |
| |
Figures at a glance
|
 |
 |
| Figure 1 |
Figure 2 |
|
| |
References
|
- A.Ray, D.De “Energy Efficient Clustering Hierarchy Protocol for Wireless Sensor Network”, Proc. IEEE International Conference on Communication and Industrial Application (ICCIA) 2011, pp.1-4.
- W. R. Heinzelman, A. Chandrakasan, and H. Balakrishnan, “Energy-efficient communication protocol for wireless microsensor networks,” in Proceedings of the 33rd Annual Hawaii International Conference on System Siences (HICSS ’00), January 2000.
- A. Joshi, Lakshmi P.M., “A Survey of Hierarchical Routing Protocols in Wireless Sensor Network”, MES Journal of Technology and Management
- Xuxun Liu, A Survey on Clustering Routing Protocols in Wireless Sensor Networks, 2012, ISSN 1424-8220
- W. Heinzelman,A. Chandrakasan, and H. Balakrishnan, , “An Application-Specific Protocol Architecture for Wireless Micro sensor network.” IEEE Transactions on Wireless Communications. 2002, vol.1 .no 4, pp 660-670.
- V.Loscri, G.Morabito and S.Marano. “A Two-level Hierarchy for Low-Energy Adaptive Clustering Hierarchy”, Vehicular Technology Conference, 2005.
- Hang Zhou, Zhe Jiang and Mo Xiaoyan, “Study and Design on Cluster Routing Protocols of Wireless Sensor Networks”, Dissertation,2006.
- M.BaniYassein, A.Alzou’bi, Y.Khamayseh, W.Mardini, “Improvement on LEACH protocol of Wireless Sensor Network(VLEACH)”, International Journal of Digital Content Technology and its Applications, Volume 3,Number 2,June 2009,pp.132-136.
- Jamal, N.Al-Karaki and Ahmed E. Kamal, “Routing techniques in Wireless Sensor Networks: A Survey”, Wireless Communications, IEEE, vol. 11, pp. 6-28, Dec. 2004.
- S. Muthukarpagam, V. Niveditta and Nedunchelivan, (2010) “Design issues, Topology issues, Quality of Service Support for Wireless Sensor Networks: Survey and Research Challenges”, IJCA Journal.
- A. Ray, D. De, “P-EECHS: Parametric Energy Efficient Cluster Head Selection protocol for Wireless Sensor Network”, Int. Jr. of Advanced Computer Engineering & Architecture, Volume 2, No. 2 (June-December, 2012)
- A.Ray, D.De “Energy Efficient Cluster Head Selection in Wireless Sensor Network”, 1st International Conference on Recent Advances in Information Technology, RAIT 2012
- Jamal, N.Al-Karaki and Ahmed E. Kamal, “Routing techniques in Wireless Sensor Networks: A Survey”, Wireless Communications, IEEE, vol. 11, pp. 6-28, Dec. 2004.
- Jim Farmer, “Managing Secure Data Delivery: A Data Roundhouse Model”, August. 2001.
- S. Muthukarpagam, V. Niveditta and Nedunchelivan, (2010) “Design issues, Topology issues, Quality of Service Support for Wireless Sensor Networks: Survey and Research Challenges”, IJCA Journal.
- Luis Javier GarcíaVillalba and Ana Lucila Sandoval Orozco, “Routing Protocols in Wireless Sensor Networks”, October 2009.
- Ana-Belen Garcia-Hernando, JFM Ortega, JML Navarro, Luis R Lopez, Problem Solving for Wireless Sensor Networks, Springer International Edition, 2008
|