IPAG LAB-IPAG Business School, 184, Boulevard Saint-Germain 75006 Paris, France
Received: 04/09/2015 Accepted: 09/11/2015 Published: 25/11/2015
Visit for more related articles at Research & Reviews: Journal of Statistics and Mathematical Sciences
In this paper, we study the contagion effect between energy and stock markets in ten MENA countries during the recent global financial crisis 2007- 2009. In particular, we verify whether this effect depends on the country’s oil position. For that, we investigate the dependence structure between oil price changes and stock market returns using different copula functions. Specifically, we test for changing in dependence structure using the local change point (LCP) testing procedure. The empirical results provide strong evidence of asymmetric dependence structure between oil price changes and stock market returns for all countries. In addition, this dependence structure is larger in oil-exporters than oil-importers. Furthermore, there is significant change in this dependence structure. For all countries (except Kuwait and Jordan), the copula parameters and the tail dependence coefficients are greater during crisis periods than calm ones, thus indicating the presence of a contagion effect.
Contagion effect, Oil price, Stock market, Financial crisis, Copulas, LCP.
The analysis of the contagion effect between energy and stock markets has recently received much attention due to its important implications for energy policy making, international portfolio allocation and risk management decisions. Contagion can be defined as change in the propagation of shocks between markets. According to Forbes and Rigobon [1], the contagion can be associated with the significant increase in cross-market linkages after a shock to one market (or group of markets) and can be measured by cross-market correlations. Chan-Lau et al. [2] attribute the contagion to the probability of observing large return realizations simultaneously across different markets (co-exceedances) rather than an increase in correlations [3]1.
To determine the causes of contagion, several explanations have been advanced. One is related to the financial crisis which makes macroeconomic fundamentals uncertain and then oil prices more volatile, the stock prices react accordingly. Another explanation is relative to the rapid process of financialization which increases the exposure of oil prices to stock and makes them more susceptible to the mood of the stock markets [4].
The contagion effect has been largely tested in stock markets and various econometric approaches have been adopted. Among these approaches, some studies determine cross-market correlations in both stable and crisis periods, then consider that an increase in correlation during crisis period relative to stable is a sign of contagion [5,6]. This approach has been criticized because the constant correlation can be biased due to the presence of heteroskedasticity caused by a rise in market volatility during crisis period [1,7,8]. To overcome this shortcoming, other studies apply dynamic conditional correlations (DCC-GARCH model) to capture time-varying correlations [9-13] while few studies consider switching models [14-16]2. It is well known that these approaches are limited because they do not allow for asymmetric dependence. Recent studies rely on Archimedean copula functions [17], while other studies employ the time-varying copula of Patton [18-21].
Few studies have tested the contagion effect between energy and stock markets while there are numerous empirical studies on the linkage between markets. Among these studies, Wen et al. [4] examine the contagion effect between oil price changes and US/Chinese stock market returns. The econometric approach is based on time-varying copula model as advanced by Patton [18]. Two main advantages of this approach, the first, one is that it separates the dependence structure from the marginal distributions of the series without making any assumptions about the distribution of the marginals. The second is that it allows for variability in the dependence structure. However, it assumes that the copula parameter evolves according to the ARMA process and does not give information about the existence of structural change in the dependence. To overcome this shortcoming, a recent study, proposed by Boubaker and Sghaier [64], assumes no prior knowledge of the existence and the localisation of change-point and apply the change point testing method, as advanced by Dias and Embrechets [65], to test the existence of change-point in the dependence structure as modeled by the copula parameter and to determine the date of its localisation that is consistent with market events during the study period. Although Boubaker and Sghaier [64] provide evidence of instability in both copula parameters and tail dependence. They suppose the existence of one single change-point in the dependence.
In this paper, we propose a novel method in which we suppose the possible existence of more than one change-point. In particular, we assume no prior knowledge about the number of change-points in the dependence structure in addition to no prior knowledge about the existence and the localisation of the change-point. Interestingly, we employ the local change point (LCP) testing procedure originating from Mercurio and Spokoiny [22] and Giacomino et al. [23] to test the presence of change in the dependence structure, i.e., to check whether the copula parameter varies over time and to determine the number and the dates of the change-points. This procedure is adaptive and consists of estimating intervals of time homogeneity in which the time varying copula parameter can well be approximated by a constant value. More precisely, we assume the same copula for all period but not the same copula parameter and tail dependence coefficients for each interval.
The objective of this paper is two-fold. First, we examine the contagion effect between oil price changes and ten MENA stock market returns containing both oil-exporters (Bahrain, Kuwait, Oman, Qatar, Saudi Arabia and UAE) and oil-importers (Egypt, Jordan, Morocco and Tunisia) using copula functions with local (multiple) change points. Second, we check whether this contagion effect depends the counrty’s on oil position.
To the best of our knowledge, this is the first paper that uses the copula functions with local change points to study the contagion effect between oil price changes and stock market returns in the MENA region. We contribute to the literature on contagion by considering increases in both copula parameter and tail dependence coefficient as an empirical measure of contagion in sense of Forbes and Rigobon [1] and Chan-Lau et al. [2] respectively. For our empirical analysis, if there is evidence of change in the dependence structure between oil price changes and stock market returns and if the copula parameter and the tail dependence coefficient are larger after the change point than before, a contagion effect exists. Otherwise, oil price changes and stock market returns are only interdependent.
Since the dependence between oil prices and stock markets depends on the country’s oil position, it seems reasonable to assume that the contagion effect, which corresponds to an increase in the dependence, relies also on the country’s oil position. More precisely, it is expected that the contagion effect is more pronounced in oil-exporters than oil-importers.
Investigating the contagion effect between oil price changes and stock market returns in the MENA region has important implications for investors and policymakers. The MENA region has the biggest oil reserves in the world3 and is composed of the largest oil-exporters and oil-importers. For investors, the presence of contagion means that the benefits of diversification related to investing in oil will diminish and that neglecting changes in tail dependence may lead to underestimation of investment risk. For policymakers, identifying contagion is useful for oil pricing, forecasting and risk management, especially during financial crisis periods.
The remainder of this paper is organized as follows. Section 2 briefly reviews the related literature focusing on the relationships between oil prices and stock markets in some MENA countries. Section 3 presents the econometric methodology. Section 4 describes the data and provides the empirical results. Section 5 concludes.
Numerous empirical studies have examined the relationships between oil prices and stock markets4. However, there are mixed results depending on whether the oil price impacts more the future cash flows of a stock or the interest rate used to discount these future cash flows. Concerning short-run linkage, Abou Zarour [24] adopts a VAR model to examine the influence of the oil price on stock markets in Bahrain, Kuwait, Oman, Saudi Arabia and UAE. He finds that only the Saudi and Omani stock markets have the power to predict the oil price and that this predictive power has been increased after a rise in the oil price. A similar result was provided by Bashar and Sadorsky [25]. Arouri et al. [26] estimate a VAR-GARCH model for oil price changes and six GCC stock market returns. They find that oil price changes positively affect stock market returns in Bahrain, Oman and Qatar. In particular, this effect is more pronounced during crisis periods than normal ones. Jouini [27] also estimates a VAR-GARCH model for the case of Saudi Arabia and finds evidence of a positive spillover effect from oil price to sectors stock market returns. Wang et al. [28] find that the response of stock market returns to oil price shocks is significant in Saudi Arabia and Kuwait.
Regarding long-run linkage, Hammoudeh and Aleisa [29] use cointegration techniques to test for a stable relationship between the oil price and five GCC stock market indices. They provide evidence of positive cointegration relationship in Saudi Arabia. For Bahrain, Kuwait, Oman and UAE, there is no significant cointegration relationship. Hammoudeh and Choi [30] study the long-term relationship between five GCC stock market indices and three global factors (oil price, SP500 index and US 3-month Treasury bill rate). They find that the interest rate has a direct effect on the stock market indices while the oil price and SP500 index have indirect effects. Arouri and Rault [31] employ bootstrap panel cointegration tests and seemingly unrelated regression and find that positive oil price shocks have positive impacts on stock market. Arouri et al. [32] examine the links between GCC stock markets and the oil price by controlling for the effects of two global factors (MSCI world index and US 1-month Treasury Bill interest rate). They find a significant long-run relationship between the oil price and GCC stock markets. In the short-run, they find that the causal links are usually from the oil price to stock markets. Moreover, the GCC stock markets are more sensitive to negative than positive oil price shocks.
There is no evidence of consensus on the linkage between oil price changes and stock market returns. The absence of consensus seems to be related to the linear models used, which are based on the assumption that the estimated parameters are constant over time. This assumption is restrictive due to presence of structural breaks [33] and regime change [34]5. The parameters are rather timevarying and the relationship between oil price changes and stock market returns seems to be non-linear. In this context, Maghyereh and Al-Kandari [35] provide evidence of non-linearities in Bahrain, Kuwait and Saudi Arabia. Using the non-paramteric method, Arouri and Fouquau [36] also find evidence of non-linearities in Oman, Qatar, and UAE but not in Bahrain, Kuwait and Saudi Arabia. Applying panel data with regime-shift techniques, Jouini [37] validates a non-linear long-run relationship between GCC stock market indices and three global factors (oil price, MSCI World index and US 1-month Treasury bill interest rate).
Recent studies provide evidence of an asymmetric effect of oil price increases and decreases on stock markets returns. In particular, increases in oil prices tend to have a greater impact on stock market returns than decreases in oil prices [38-40] . To reproduce this asymmetric effect, Mohanty et al. [41] introduce a dummy variable6 in the linear model and show that decreases in oil prices have a negative impact on GCC stock market returns, whereas increases in oil prices positively affect the stock market returns in Saudi Arabia and UAE only. Awartani and Maghyereh [42] employ DCC-GARCH model and find that the correlation between stock market returns and oil price changes varies over time.
Although the DCC-GARCH model allows for time-varying conditional correlation, it fails to reproduce the non-linear dependence that may exist between the variables and does not provide information about tail dependence. The tail dependence corresponds to the possibility of joint events such as low or high extreme event occurrence. To do this, Naifar and Al Dohaiman [43] propose an alternative approach based on copula theory to study the dependence structure between oil price changes and macroeconomic variables (stock market return, consumer price index and short term interest rate) in six GCC countries using three Archimedean copulas (Gumbel, Clayton and Frank)7. The main advantage of the copulas lies in separating the dependence structure from the marginal distributions of the series without making any assumptions about the distribution of the marginals. In particular, the authors consider two subperiods: before and after the financial crisis to check whether the financial crisis affects the dependence structure. They find different dependence structures in each subperiod. Before the crisis, they provide evidence of symmetric dependence, while after the crisis the dependence becomes asymmetric.
The later study provides interesting findings about the change in the dependence structure between oil price changes and GCC stock market returns during the recent global financial crisis, however it does not give any indication about the contagion effect and considers only oil-exporters. It is admitted that the impact of oil price changes on stock market returns depends on whether the country is an oil-importer or oil-exporter [44-47]. It seems to be positive in oil-exporters because increases in oil prices may induce higher income due to the low price elasticity of oil demand and generate a higher rise in expenditure and investment. In contrast, for oil-importers, increases in oil prices will lead to higher costs of production. This higher cost of production can reduce the profit of firms and therefore the dividends paid to shareholders. Consequently, the stock price may drop.
In this section, we firstly present the bivariate copula functions used to study the dependence structure between oil price changes and stock market returns. Secondly, we describe the method considered to estimate the copula parameter. Thirdly, we discuss the goodness of fit test applied to select the best copula. Finally, we introduce the local change point (LCP) testing procedure employed to test the stability of the copula parameter estimated and to determine the number and the localization of the change points if they exist.
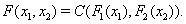
A copula is a function that allows to join different univariate distributions to form a valid multivariate distribution without losing any information from the original multivariate distribution [48-49]8. According to Sklar’s [50] theorem, any joint distribution function F of k continuous random variables x1,…,xk can be decomposed into k marginal distributions F1,…,Fk and a copula C that describes the dependence structure between the components.
Formally, let  be a two-dimensional random vector with joint distribution function
  and marginal distributions Fi, i= 1,2. There exists a copula C(u1,u2) such that:
 (1)
(1)
The theorem also states that if Fi are continuous then the copula C(u1,u2) is unique. An important property of a copula is that it can capture the tail dependence: the upper tail dependence exists when there is a positive probability of positive outliers occurring jointly while the lower tail dependence
  is a negative probability of negative outliers occurring jointly. Formally, and are defined respectively as:
 (2)
(2)
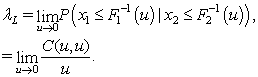 (3)
(3)
Where  and
and  are the marginal quantile functions.
In this paper, we consider four families of bivariate copulas that allow for different dependence structure between oil price changes and stock market returns. More precisely, we use elliptical copulas (Normal and Student), Archimedean copulas (Gumbel, Clayton and Frank), Survival copulas and Plackett copulas. In what follows, we proceed to the description of these copulas.
Normal copula: The Normal copula is the copula of the multivariate Normal distribution and is defined by:
 (4)
(4)
Where −1≤θ ≤1 is the linear correlation coefficient. φ-1 is the inverse of the univariate standard Normal distribution function. The Normal copula has zero tail dependence:
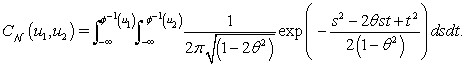
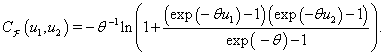
Student copula: The Student copula is defined by:
 (5)
(5)
Where −1≤θ ≤1 is the linear correlation coefficient.  is the inverse of the univariate standard Student distribution function with
  degree-of-freedom. The Student copula has also symmetric tail dependence:
The main limit of the elliptical copulas is that they allow for symmetric dependence only. However, it is more common to observe big losses together rather than big gains. We consider Archimedean copula to model such asymmetry.
Gumbel copula: The Gumbel copula was introduced by Gumbel [51] and is expressed as:
 (6)
(6)
Where 
The Gumbel copula is an asymmetric copula exhibiting greater dependence in the upper tail than in the lower tail dependence:  and
and  .
.
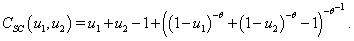
Clayton copula: The Clayton copula was introduced by Clayton [52] and is expressed as:
 (7)
(7)
Where 
The Clayton copula is also an asymmetric copula but exhibiting greater dependence in the lower tail than in the upper tail dependence:  and
and 
Frank copula: The Frank copula is introduced by Frank [53] and is expressed as:
 (8)
(8)
Where 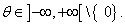
The Franck copula is a symmetric copula: 
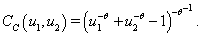
Survival copulas: Survival or Rotated copulas are the copulas of (1− u) and (1− v) instead of u and V respectively. Its function measures the asymmetric dependence on the opposite side of the distribution as compared to the original function. The Survival Gumbel copula measures left tail dependence instead of right tail dependence as compared to the Gumbel copula while the Survival Clayton copula measures right tail dependence instead of left tail dependence as compared to the Clayton copula.
Survival Clayton copula: The Survival Clayton copula is derived from the Clayton copula. This copula is defined by:
 (9)
(9)
Where  .
.
Survival Gumbel copula: The Survival Gumbel copula is derived from the Gumbel copula. This copula is defined by:
 (10)
(10)
Where 
The Plackett copula [54] is a symmetric copula. This copula is defined by:
 (11)
(11)
Where 
To estimate the parameters of the copula, we find in the literature parametric, semi-parametric and non-parametric methods [55-56]9. In this paper, we adopt a semi-parametric method. More precisely, we consider the canonical maximum likelihood (CML) method proposed by Genest et al. [57]. We have chosen this method because there are no assumptions about the parametric form of marginal distributions. Indeed, an incorrect specification of the marginal distribution can influence the estimation of the copula parameters. More precisely, the CML method leaves the marginal densities unspecified and uses the empirical probability integral transform in order to obtain the uniform marginals [0,1] needed to estimate the copula parameters. The estimation process is performed in two steps. In a first step, the dataset  t =1,...,T is transformed into uniform variates
  using the empirical Cumulative Distribution Function (CDF) distribution
  defined as follows:
 (12)
(12)
Where  represents the indicator function.
In a second step, the copula parameters θ are estimated as follows:
 (13)
(13)
Where  and
and  are pseudo-sample observations from the copula.
After estimating the parameters of the copula, a typical problem that arises is how to choose the best copula, i.e., the copula that provides the best fit to the data. For this purpose, we consider the information criterion, namely the log-likelihood (LL), the Akaike Information Criterion (AIC) and the Bayesian Information Criterion (BIC).
In addition, we employ the goodness-of-fit test of Genest et al. [58] which is based on a comparison of the distance between the estimated and the empirical copulas. The null hypothesis of this test is that the copula C belongs to a class  and the statistic of this test uses the distance of Cramér-von Mises given by:
 (14)
(14)
Where  is the density function associated with
  ,
,  is the estimator of and
  is Kendall’s process given by:
 (15)
(15)
Where K (t ) denotes the univariate distribution function and  is the empirical distribution function given by:
 (16)
(16)
Where  for each j =1,…,T.
We reject the null hypothesis when the observed value of ST is greater than the (1−α )th percentile of its distribution. In practice, we require knowledge about the limiting distribution of ST which depends on the unknown value of the copula parameter θ. To determine, the p-values associated with the statistic of the test, we consider a multiplier approach as described in Kojadinovic and Yan [59].
When estimating the selected copula, an assumption of invariability of the estimated parameter θ is needed. However, if during some period of time, the dependence structure between the series varies, then the parameter θ will not be constant and depends on time:  . In such a case, the joint distribution for
  can be modified and it takes the form
  with probability measure
  .
.
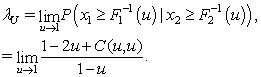
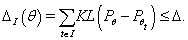
To test stability of the copula parameter over time, that is, to verify that the estimated copula parameter θ is constant and independent of time, Mercurio and Spokoiny [21] and Giacomini et al. [22] developed a test procedure provided by the amount of information of Kullback-Leibler called the local change point (LCP) testing procedure. This procedure tests the null hypothesis  within some interval I. Therefore, for the largest possible interval
  the small modelling bias condition should be fulfilled:
 (17)
(17)
Where θ is constant and 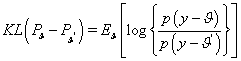 is a Kullback-Leibler divergence.
This procedure is adaptive and tests for sudden jump in the dependence parameter on the interval candidate. Its idea is to sequentially screen each interval  , k =1,…,K , where
  is a given start point with a family of nested intervals
  of the form
  , and the sequence
  determines the length of these intervals and checks each point
  as a possible change point location.
Test of homogeneity against change point alternatives: In the homogeneity test against change point alternatives, we want to check every point of an interval  , called the tested interval, on a possible change in the dependence structure at this moment. For that, we assume a larger testing interval I of form
 , so that is an internal subset within I . The null hypothesis of the test H0 is that there is no change in the dependence structure on the interval I , that is, the observations in I follow the model with the copula parameter θ :
 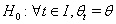 . The alternative hypothesis
  claims that the copula parameter θ changes spontaneously at some point τ on the interval , i.e.,
  such that
  for
for  and
and  for
for 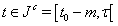 .
.
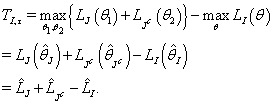
Let  and
and 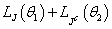 be the log-likelihood functions corresponding to
  and
and  respectively. The likelihood ratio test for the single change point with known fixed location τ of the interval I can be written as:
 (18)
(18)
For the unknown change point location, the test statistic for the interval I is defined as:
 (19)
(19)
The change point test compares this test statistic with a critical value λI which may depend on the interval and the nominal first kind error probability α. We reject the null hypothesis of homogeneity if  . The estimator of the change point is then defined as:
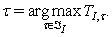 (20)
(20)
Parameters of LCP procedure: In order to apply the LCP testing procedure, we have to specify some parameters including the selection of interval candidates , internal points  and the choice of the critical value
  .
.
Selection of I and It is useful to take the set of numbers mk defining the length of Ik and in the form of a geometric grid. We fix the value m0 and define for k =1,…,K and c >1 , where [x] means the integer part of x . We set
 and
and  .
.
Choice of λI λI is selected to provide the overall first type error probability of rejecting the null hypothesis of homogeneity in the homogeneous situation.
Our database consists of daily oil prices and stock market indices in ten MENA countries over the period June 1, 2005 until February 11, 2013. The chosen period allows us to take into account the effect of the recent global financial crisis 2007-2009. As advanced by Reboredo and Rivera-Castro [60], using daily data is more appropriate to test contagion, since shock transmission due to contagion is very fast and dies out quickly after a few days. We consider only three days per week (Monday, Tuesday and Wednesday) to obtain synchronous days because all stock markets (except those of Morocco and Tunisia) are closed on Thursdays and Fridays while the international oil market is closed on Saturdays and Sundays. Moreover, we eliminate the observations when a stock or energy market was closed for holidays. Therefore, we obtain a total of 1939 observations.
The countries may be divided into three groups. (1) OPEC (Organization of the Petroleum Exporting Countries) oil-exporting countries including Kuwait, Qatar, Saudi Arabia and United Arab Emirates (UAE), (2) Non-OPEC oil-exporting countries including Bahrain and Oman and (3) oil-importing countries including Egypt, Jordan, Morocco and Tunisia.
As a proxy for stock markets, we use the major stock market index for each country extracted from MSCI (Morgan Stanley Capital International). As a proxy for the world oil price, we use the Brent crude oil price collected from the US Energy Informa Information Administration (EIA) website. We consider the Brent crude oil price rather than the West Texas Intermediate (WTI) crude oil price to represent the international oil market because the Brent crude oil price is widely being used as the benchmark for oil pricing10. In addition, Brent crude oil price is closely related to other crude oils such as WTI, Maya, Dubai [60]. All data are expressed in US dollars to avoid the impact of exchange rate.
These data are transformed into logarithm form and considered in first difference, so the series obtained correspond to stock market returns and oil price changes11. The application of standard unit root tests and unit root tests with structural breaks show evidence of stationarity12, which is a standard finding in the literature for such series. The descriptive statistics for the series are presented in Table 1.

Table 1: Descriptive statistics of the series.
We see that the average stock market returns are negative for all oil-exporters and positive for all oil-importers (except Jordan), reflecting the impact of the recent global financial crisis. Moreover, we observe that the UAE exhibits the highest risk degree, as measured by the standard deviation, followed by Egypt while Tunisia shows the least risk degree followed by Morocco. The oil price changes exhibit a higher average daily return (0.044%) and a higher standard deviation (2.226%) than stock market returns since oil prices doubled during the study period from $50.46 to $118.29. All series exhibit negative skewness (except the Tunisian stock market return) and show excess kurtosis. The Jarque-Bera test strongly rejects the null hypothesis of normality for all series, which justifies the choice of copula theory.
We adopt a two-step estimation method. First, we model the marginal distributions of stock market returns and oil price changes. Second, we focus on the dependence structure between the filtered series.
To model oil price changes and stock market returns, the most popular approach used is ARMA-GARCH model introduced by Bollerslev. This model is attractive because of its simplicity. However, it fails to reproduce some stylized features such as fat tails, asymmetry and persistence of shocks, and leverage effects observed in oil price changes and stock market returns. To overcome this shortcoming, some authors use GJR model of Glosten et al.while others authors consider the ARFIMA-FIGARCH model of Baillie et al. [26]. In this paper, we use the ARFIMA-FIAPARCH (Autoregressive Fractionally Integrated Moving Average-Fractionally Intergrated Asymmetric Power AutoRegressive Conditionally Heteroskedastic) model proposed by Tse [61].
Compared to ARFIMA-FIGARCH model, the ARFIMA-FIAPARCH model has the advantage of capturing important stylized features such as fat tails and leverage effects which correspond to negative correlations between past returns and future volatility.
The choice of this model can be justified empirically by the analysis of the autocorrelation function and the autocorrelation function of squared series which show that these functions decrease hyperbolically to zero as lags increase. In addition, the associated spectral densities seem not to be bounded, which may indicate the presence of long memory behavior in both mean and variance13.
Specifically, let rt be a times series of stock market returns or oil price changes at time t , we use the following model:
 (21)
(21)
 (22)
(22)
 (23)
(23)
Equation (21) represents the mean equation. μ > 0 is a constant  is the fractional integration parameter, L is the lag operator,
  and
and  are polynomials of order p and q respectively whose roots are distinct and lie outside the unit circle14.
  is the information set available at time t −1 .
Equation (22) defines the residual terms of the mean equation as a product of the conditional variance of the series ( ht ) and innovation ( et ). et refer to a sequence of independently identically distributed normal random variables.
Equation (23) corresponds to the FIAPARCH  process used to model the conditional variance of the series. process used to model the conditional variance of the series. w > 0 is a constant,
  is the fractional integration parameter,
 and
and  are polynomials of order P and Q respectively whose roots are distinct and lie outside the unit circle.
  is the power term that plays the role of a Box-Cox transformation of the conditional standard deviation
  .
.  is the leverage coefficient that accounts for the asymmetric effect of the volatility, in which positive and negative returns of the same magnitude do not generate an equal degree of volatility. When γ > 0 , negative shocks give rise to higher volatility than positive shocks. When γ = 0 and δ = 2 , the process in Equation (23) reduces to the FIGARCH
  process.
To estimate the model, we use the quasi-maximum likelihood method since the hypothesis of normality is often rejected for financial time series.
The estimation results of the ARFIMA-FIAPARCH model for each stock market return and oil price changes are displayed in Tables 2 and 3.

Table 2: Estimates of ARFIMA-FIAPARCH model for oil-exporters stock market returns.

Table 3: Estimates of ARFIMA-FIAPARCH model for oil-importers/MENA stock market returns and oil price change.
We see that the fractional integration parameter in mean dm is significant in the stock market returns of Bahrain, Kuwait, Oman, Qatar, UAE, Egypt and MENA, indicating the presence of long range dependence in the mean. The fractional integration parameter in volatility dv is significant in all countries, implying the existence of long range dependence in volatility. In particular, we observe that the degrees of dv in oil-exporters stock market returns are higher than those of oil-importers stock market returns, implying more persistence in volatility in oil-exporters stock markets.
It should be stressed that within the FIAPARCH model, we can test for the restrictions embodied in the FIGARCH model, i.e., γ = 0 and δ = 2 relying on the likelihood ratio (LR) type test. Formally, the LR test is a statistical test used to compare the in-sample performance of nested models. The statistic test is asymptotically Chi-squared distributed with a degree of freedom equal to the number of restrictions being tested. Let l0 denotes the log-likelihood value under the null hypothesis that the true model is FIGARCH and l1 is the log-likelihood value under the alternative hypothesis that the true model is FIAPARCH, the statistic test LR is given by  should follow a χ2(2). (χ2(2)=9.210 at 1% significance level). Here, we find that the statistic test clearly accepts the constraints implied by the FIGARCH-type specification at 1% significance level for the stock market returns of Qatar, Saudi Arabia, Jordan, Morocco, Tunisian and MENA. Hence, the FIGARCH adaptation appears to be the most satisfactory representation to describe the long memory behavior in the second conditional moment.
For the stock market returns of Bahrain, Kuwait, Oman, UAE, Egypt and oil price changes, the LR test exhibits the highest values, thus we can conclude that the FIAPACH structure prevails in capturing the dynamics which govern the second conditional moment. For these series, the leverage coefficient γ is positive and significant. Evidence regarding leverage effects implies that news in stock and oil markets has an asymmetric impact on volatility: bad news or negative shocks give more rise than positive shocks or good news. This specification seems to be adequate to model the series since the Ljung-Box statistic for serial correlation in residuals and squared residuals indicate the absence of autocorrelation and heteroscedastic effects.
In this subsection, we study the dependence structure between filtered oil price changes and filtered stock market returns over the whole period [1,T ] 15. For each country, we estimate the different copula functions, described in Section 2.1, and we retain the best copula which presents the smallest LL16, AIC and BIC. The choice of the selected copula is also confirmed by the goodness of fit test presented in Section 2.3. Table 4 reports the selected copula, the copula parameter estimates and the tail dependence coefficients.

Table 4: Copula parameters and tail dependence coefficients over the whole period.
We observe that Qatar, Saudi Arabia, UAE, Egypt and MENA region show similar dependence structures between oil price changes and stock market returns, as represented by the Survival Gumbel copula. Bahrain, Kuwait and Jordan exhibit same dependence structures described by the Clayton copula. The Gumbel copula gives a better fit for Oman, Morocco and Tunisia.
Focusing on copula parameters, for all countries we see that the copula parameter is positive indicating that all stock market returns and oil price changes are positively correlated. This finding is supported by other studies in the literature [26,27,29,42], who find positive dependence between oil prices and GCC stock markets. As expected, the copula parameters are higher in oil-exporters than oil-importers. For example, the Survival Gumbel parameter is higher in UAE, Saudi Arabia and Qatar (oil-exporters) than in Egypt (oil-exporter), the Clayton parameter is larger in Kuwait (oil-exporter) than in Jordan (oil-importer) and the Gumbel parameter is stronger in Oman (oil-exporter) than in Morocco and Tunisia (oil-importers). In particular, we see that UAE shows the highest Survival Gumbel parameter followed by Saudi Arabia and Qatar, while Tunisia presents the lowest Gumbel parameter followed by Morocco. A possible explanation is that this could be attributed to oil consumption, since UAE (leading Arab oil-consumer) experiences larger oil consumption compared to Saudi Arabia and Qatar, while Tunisia documents the least oil consumption relative to Morocco. Another explanation is that this could be explained by the volatility of the stock market as measured by the standard deviation, since UAE presents the largest risk degree, while Tunisia presents the lowest risk degree. This finding is consistent with that of Wang et al. who find that the effect of oil price shocks on stock market returns depends on the oil position of the country, oil consumption and the importance of oil to its national economy.
Turning to tail dependence, for all countries (except Oman, Morocco and Tunisia), there is evidence of lower tail dependence17 which means that downturns oil price changes and stock market returns are more highly correlated than upturns. When the energy and stock markets are down, the risk diversification is less effective due to there stronger dependence. Consequently, investor that includes oil as asset in a diversified portfolio or energy risk manager that considers VaR (or other downside energy risk measures) should be particularly concerned about downside risk exposure and should emphasize the left side of the portfolio return distribution. For Oman, Morocco and Tunisia, there is evidence of upper tail dependence18 which imply that oil prices and stock market indices crash together. This result is in line with that of Mohanty et al. [41], Arouri et al. [32] and Awartani and Maghyereh [42] who evidence of asymetric effect of increases and decreases in oil price on GCC stock market market returns.
Now, we test for the occurence of change-points in the dependence structure between oil price changes and stock market returns. Specifically, we check whether the copula parameters estimated are constant over period. Concretely, we apply the LCP testing procedure, described in Section 2.4, to determine the existence, the number and the localisation of unknown change points, and estimate intervals of homogneneity. This procedure is set with a geometric grid defined by m0 = 20 , c =1.25 and α = 0.05 .
For each country, we find that the null hypothesis of homogeneity can be rejected in favor of two change-points.
Figures 1 to 11 illustrate the estimated time-varying copula parameter and the intervals of homogeneity for all countries and MENA region. We can see that, in the first period (from the beginning to the first change point  ), the copula parameters are rather stable. In the second period (from the first change point to the second change point
  , the behavior of the copula parameters seems to vary indicating a change in the dependence structure. We can also see a third period (from the second change point
  to the end T ) where the copula parameters are again stable and the dependence structure between the series seems to the one found in the first period. Consequently, for all countries the null hypothesis of homogeneity of copula parameter is rejected in favour of two change points. The date of these two change-points and are reported in Table 5.

Table 5: Dates of change points.

Figure 1: Time-varying copula parameter for Bahrain.

Figure 2: Time-varying copula parameter for Oman.

Figure 3: Time-varying copula parameter for Kuwait.

Figure 4: Time-varying copula parameter for Qatar.

Figure 5: Time-varying copula parameter for Saudi Arabia.

Figure 6: Time-varying copula parameter for UAE.

Figure 7: Time-varying copula parameter for Egypt.

Figure 8: Time-varying copula parameter for Jordan.

Figure 9: Time-varying copula parameter for Morocco.

Figure 10: Time-varying copula parameter for Tunisia.

Figure 11: Time-varying copula parameter for MENA.
We see that the dates of first change points are all in 2008. The year of 2008 is characterized by a rise in oil prices which peaks in July 2008. The date of second break are in 2009/2010. These dates can be associated to recent global financial crisis. We see that the date of change points differ in each country. This can, in part, be attributed to each country’s stock market characteristics as well as the authority’s response to the financial crisis. In addition, we observe some similarities between Non-OPEC oil-exporters (Bahrain and Oman), OPEC oil-exporters (Kuwait, Saudia Arabia and UAE) and oil-importers (Morocco and Tunisia). This may be due to economic interdependence, therefore a change point can affect simultaneously the oil-exporters or oil-importers.
The evidence of the change in dependence structure between oil price changes and stock market returns does not necessarily indicate the existence of contagion effect. Therefore, we need to compare the values of copula parameters and tail dependence coefficients before and after the change points. The number of change points obtained above divide the sample into three subsamples.
Now, we re-examine the dependence structure between filtered oil price changes and filtered stock market returns for each country over three subperiods: pre-crisis period  during crisis period
  and post-crisis period . For each subperiod taken separately, we find the same copula that selected for the whole period19. However, we find different copula parameters and tail dependence coefficients depending on whether we are in calm period (pre-crisis and post-crisis) or crisis period. The obtained results are symmarized in Table 6.

Table 6: Copula parameters and tail dependence coefficients over subperiods.
We see that for all countries (except Kuwait and Jordan), the copula parameters and the tail dependence coefficienrs are greater during crisis period than calm one which means that the dependence structure between oil price changes and stock market returns is more intensified, and that the probability of observing large positive or negative returns across oil price changes and stock market returns simultaneously increases during crisis period. Thus, we can conclude to the existence of a contagion effect in sense of Forbes and Rigobon [1] and Chan-Lau et al. [2]. This result is in line with that of Arouri et al. [17] and Fayyad and Daly (2011) who report that the sensitivity of GCC stock markets to oil price changes has jumped following the global financial crisis. It is also similar to the one obtained by Wen et al. [4], Aloui et al. [62] and Zhu et al. [63] who find that the dependence structure between oil price changes and stock market returns has increased following the financial crisis. As advanced by Zhu et al., this result may be explained by a sharp decline in energy demand caused by the economic downturn which heavily affects the stock markets or by the rapid development of financial markets that increases the exposure of oil prices to financial turmoil.
As regards the Survival Gumbel’s dependence structure, UAE experiences not only the highest level of dependence between oil price changes and stock market returns but also the biggest increase in both copula parameter and lower tail dependence coefficient during crisis period (1.252 and 0.260) followed by Saudi Arabia, Qatar and Egypt. For the Gumbel’s dependence structure, Tunisia documents the least increase in both Gumbel parameter and upper tail dependence coefficient during crisis period (1.186 and 0.206) followed by Morocco and Oman. Based on this result, we can conclude that the contagion effect is more pronounced in oil-exporters than oil-importers and also depends on the risk degree of the stock market and the oil-consumption of the country.
These finding suggest some important implications. The presence of contagion in all countries (except Kuwait and Jordan) implies that the diversification will be less effective and that holding a portfolio with oil asset and stock market index during financial crisis is subject to systematic risk in these countries. Consequently, a portfolio of Kuwaiti or Jordanian stock market indices and oil during financial crisis can be better in terms of diversification.
In this paper, we examine the contagion effect between energy and stock markets in ten MENA countries during the period June 1, 2005 to February 11, 2013. For that, we focus on the dependence structure between daily oil price changes and stock market returns. In particular, we ascertain whether this dependence structure in oil-exporters is different from the one in oilimporters and whether it is affected by the recent global financial crisis.
The econometric approach adopted is based on three steps. In a first step, we fit an ARFIMA-FIAPARCH model for each returns series. We find evidence of persistence and asymmetry in both the mean and the volatility. In a second step, we focus on the dependence structure between filtered returns series using different copula functions. For all countries, we find evidence of positive and asymmetric dependence structure. In particular, we find that this dependence structure is affected by oil-position and consumption of the country as well as the volatility of the stock market. Finally, we check the stability of the copula parameters estimated using LCP testing procedure. We find significant change in the dependence structure. For all countries (except Kuwait and Jordan), we find that the copula parameters and the tail dependence coefficients are higher during financial crisis periods than normal periods, thus implying the presence of a contagion effect. We consistently find that the largest oil-exporters and consumers (UAE and Saudi Arabia) have not only the highest levels of dependence with the oil price but also the greatest raise in dependence during financial crisis compared to oil-importers, implying the severe impact of contagion effect on oil-exporters.
These empirical findings can be used to build profitable investment strategies. The fact that MENA stock market returns have differents dependence structures to oil price changes imply valuable risk diversification opportunities across countries.
1We find in the literature different definitions of contagion. In this paper, we retain two definitions of contagion in sense of Forbes and Rigobon and Chan- Lau et al. For a recent review on contagion, see Forbes [3].
2For a review of the econometric methods applied to measure contagion, see Kenourgios et al.
3MENA countries contain about 70% of the world’s oil reserves.
4In this section, we focus on the studies that have considered the MENA countries.
5These authors consider the case of France, UK and Japan.
6The dummy variable takes the value of 1 if the oil price changes are positive and 0 otherwise.
7The copula functions have been used by other authors to study the dependence structure between oil price changes and stock market returns in Vietnam and China, six EEC countries and ten Asia-Pacific countries.
8For an introduction to copulas, see Joe and Nelsen and for a recent review, see Patton.
9For a review of non-parametric methods, see Charpentier et al., Chen and Huang.
10The Brent crude oil price has been also considered by several authors as a proxy of the energy market.
11More precisely, we consider the stock market returns (resp. oil price changes)  defined by
  , where
  is stock market index (resp. oil price).
12The results of the unit root tests are not reported here but are available upon request.
13We do not report autocorrelation functions and spectral densities. These are available on request.
14 p and q are determined according to information criteria.
15 T corresponds to the size of the sample, in this case 1938.
16We note that the selected copula in terms of LL is one with lowest LL, since we minimize in our estimation (−LL) rather maximize (LL) .
17Recall that the Survival Gumbel and Clayton copulas are characterized by lower tail dependence.
18Note that Gumbel copula is characterized by upper tail dependence.
19In practice, we re-estimate the several copula presented above and we apply the goodness of fit test to select the best copula. We find the same copulas presented in Table 4. Here, we do not report the results. These are available on request.