Research & Reviews: Journal of Material Sciences
ISSN:2321-6212
ISSN:2321-6212
1Department of Metallurgical and Materials Engineering, Nnamdi Azikiwe University, Awka, Nigeria.
2Scientific Equipment Development Institute, Enugu, Nigeria.
3Department of Metallurgical and Materials Engineering, Enugu State University of Science & Technology, Enugu, Nigeria.
4Ajaokuta Steel Company, Kogi State, Nigeria.
Received: 17/04/2014; Revised: 22/05/2014; Accepted: 29/05/2014
Visit for more related articles at Research & Reviews: Journal of Material Sciences
An empirical evaluation of slag cement minimum setting time (SCMST) has been successfully carried out through optimization of gypsum addition to foundry slag in the course of the cement production. A model was derived and used as a tool for predictive analysis of the cement setting time based on gypsum input. The model aided optimization of gypsum addition indicates a minimum setting time of 14.1054 minutes at an optimum gypsum input concentration of 6.4847 %. Beyond 6.4847% gypsum addition, the slag cement setting time increases drastically; a situation typifying immiscibility and lack of homogeneity between the cement slurry and the extra gypsum addition. This is because increased gypsum addition (above a specified quantity) is unlikely to forms a coherent mass with a specified and fixed liquid volume, resulting to delayed and differential setting. The derived model expressed as; γ = 0.7168 α2 – 9.2965 α + 44.2478 is quadratic and single factorial in nature. The slag cement setting time per unit gypsum addition are as obtained from experiment and derived model are 4.75 and 4.996 mins./ % respectively. Statistical analysis of the experimental and derived model-predicted results for each value of the gypsum input concentration considered shows standard errors of 1.8974 and 1.5485% respectively. Deviational analysis indicates 10.46% as the maximum deviation of the model-predicted slag cement setting time from the corresponding experimental value. The validity of the model was rooted on the expression 0.0226 γ + 0.2101 α = 0.0162 α2 + 1.0001 where both sides of the expression are correspondingly approximately equal. The validity of the derived model-predicted results also was ascertained using SPSS 17.0. The results indicate check variance = 0.001, standard deviation = 0, and model operational confidence of 95.0% at a significant level: 0.05.
Evaluation, Optimization, Gypsum Addition, Slag Cement Setting Time
The growing need to support research and development aimed at improving the quality of cement produced through incorporation of industrial wastes and cheaper locally acquired material stems on the fact that cement plays a very important and unavoidable role in the building and construction sector. There is also need to evaluate other materials to produce materials of similar characteristics to cement.
The need to satisfy specification on application of cement has influenced the addition of materials in the course of cement production that would have the necessary performance characteristics [1]. As it concerns health and environment, it should be inoffensive. Finally, the incorporation of the waste should not impair concrete durability. Traditional assessment methods must therefore be adopted to evaluate these new materials [2]. The high content of soluble salt (Sugar) in ash has identified it as experimental waste [3]. The environmental impact and durability of concrete are closely connected to its transport properties, which control the kinetics of the penetration of water and aggressive agents into concrete [4]. Concrete diffusivity is practically linked to the movement of chemical species within the material and the leaching of certain chemicals [5].
The essential components of blast furnace slag has been discovered [6] to be of same oxide (such as lime, silica, and aluminum) as are present in Portland cement, but differ in proportion. Blast furnace slag is a by-product obtained in the manufacture of pig iron in the blast furnace. It has found application in the road and building industries and in the production of cementing materials, as an aggregate in concrete and in the manufacture of slag wool for thermal insulation.
The aim of this work is to evaluate empirically the slag cement minimum setting time (SCMST) through optimization of gypsum addition to foundry slag in the course of the cement production. A model would be derived and used as a tool for predictive analysis of the cement setting time based on gypsum input.
Materials used and their respective sources and details of the experimental procedure and associated process conditions are as stated in the past report [6].
Model Formulation
Experimental data obtained from research work [6] were used for this work. Computational analysis of the experimental data [6] shown in Table 1, gave rise to Table 2 which indicate that;


Table 1: Variation of setting time with the concentration of gypsum added [6]

Table 2: Variation of 0.0226 γ + 0.2101α with 0.0162 α2 + 1.0001
Introducing the values of the empirical constants e1, e2, e3 and e4 into equation (1) reduces it to;


Where
(γ) = Setting time (mins.)
e1 = 0.0226; Empirical constant (determined using C-NIKBRAN [7]
(α) = Concentration of gypsum added (%)
e2 = 0.2101; Empirical constant (determined using C- NIKBRAN [7])
e3 = 0.0162; Empirical constant (determined using C-NIKBRAN [7])
e4= 1.0001; Slag grade (determined using C-NIKBRAN [7])
Boundary and Initial Condition
Consider foundry slag paste of required consistency (in a cylindrical container) interacting with quantities of gypsum. The container’s atmosphere was not contaminated i.e (free of unwanted gases, dusts and other micro organisms). Range of gypsum addition: 1-5 %. Range of setting time considered (based added gypsum): 16 - 35 mins., mass of wastes used, resident time, treatment temperature, and other process conditions are as stated in the experimental technique [6].
The boundary conditions are: free movement of oxygen across the cylindrical container. At the bottom of the particles, a zero gradient for the gas scalar are assumed and also for the gas phase at the top of the slag paste. The treated slag paste was stationary. The sides of the waste particles are taken to be symmetries.
The derived model is equation (4). The computational analysis of Table 1 gave rise to Table 2
The validity of the model is strongly rooted on equation (2) where both sides of the equation are correspondingly approximately equal to 1. Table 2 also agrees with equation (2) following the values of 0.0226 γ + 0.2101α and 0.0162 α2 + 1.0001 evaluated from the experimental results in Table 1. Furthermore, the derived model was validated by comparing the setting time (of the slag cement) predicted by the model and that obtained from the experiment [6]. This was done using the 4th Degree Model Validity Test Techniques (4th DMVTT); computational, graphical, statistical and deviational analysis [8].
A critical comparative analysis of the results computed from experimental and model-predicted setting time was carried out to ascertain the degree of validity of the derived model. This was done by comparing setting time per unit gypsum addition obtained by calculations involving experimental results, and model-predicted results obtained directly from the model.
Setting time of slag cement per unit gypsum addition γg ( mins. /%) was calculated from the equation;

Therefore, a plot of setting time against concentration of gypsum addition as in Fig. 1 using experimental results in Table 1, gives a slope, S at points (1, 35) and (5, 16) following their substitution into the mathematical expression;


Figure 1: Coefficient of determination between setting time and concentration of gypsum added as obtained from the experiment [6].
Equation (6) is detailed as

Where
Δγ = Change in the setting time γ2, γ1 at two gypsum concentrations α2, α 1. Considering the points (1, 35) and (5, 16) for (α1, γ1) and (α2, γ 2) respectively, and substituting them into equation (7), gives the slope as 4.75 mins./ % which is the slag cement setting time per unit gypsum addition during the actual experimental process. Also similar plot (as in Fig. 2) using model-predicted results gives a slope. Considering points (1, 35.6681) and (5, 15.6853) for (α1, γ1) and (α2, γ2) respectively and substituting them into equation (7) gives the value of slope, S as 4.996 mins. /%. This is the modelpredicted slag cement setting time per unit gypsum addition. A comparison of these two values of the slag cement setting time per unit gypsum addition shows proximate agreement.

Figure 2: Coefficient of determination between setting time and concentration of gypsum input as predicted by derived model
Standard Error (STEYX)
The standard errors (STEYX) in predicting the setting time (using results from derived model, and experiment) for each value of the concentration of added gypsum are 1.5485 and 1.8974 % respectively. The standard error was evaluated using Microsoft Excel version 2003.
Correlation (CORREL)
The correlations between setting time and gypsum input concentration as obtained from derived model and experiment considering the coefficient of determination R2 from Figs. 1and 2 was calculated using Microsoft Excel version 2003.

The evaluations correlations are shown in Table 3. These evaluated results indicate that the derived model predictions are significantly reliable and hence valid considering its proximate agreement with results from actual experiment.

Table 3: Comparison of the correlations evaluated from D-Model predicted and ExD results based on gypsum input concentration
Comparative graphical analysis of Fig. 3 shows very close alignment of the curves from the experimental (ExD) and model-predicted (MoD) slag cement setting time relative to gypsum addition respectively. Furthermore, the degree of alignment of these curves is indicative of the proximate agreement between both experimental and model-predicted setting time.

Figure 3: Comparison of the setting times relative to concentration of gypsum input as obtained from experiment [6] and derived model.
The validity of the derived model was further verified through application of the regression model (Reg) (Least Square Method using Excel version 2003) in predicting the trend of the experimental results. Comparative analysis of Figs. 3 and 4 shows very close alignment of curves and significantly similar trend of data point’s distribution for experimental (ExD) and derived model-predicted (MoD) results of setting time. Fig. 5 shows that the calculated correlations between setting time and gypsum input concentration for results obtained from regression model gives 1.000. The slag cement setting time per unit gypsum addition as obtained from regression model is 5.0 mins./ %. These values are in proximate agreement with both experimental and derived model-predicted results.

Figure 4: Comparison of the setting time relative to concentration of gypsum input as obtained from experiment (ExD) [6], derived model (MoD) and regression model (Reg)

Figure 5: Coefficient of determination between setting time and concentration of gypsum added as predicted by regression model
The validity of the derived model-predicted results also was ascertained using SPSS 17.0. The results indicate check variance = 0.001, standard deviation = 0, and model operational confidence of 95.0% at a significant level: 0.05.
Comparative analysis of setting time from experiment [6] and derived model revealed insignificant deviations on the part of the model-predicted values relative to values obtained from the experiment. This is attributed to the fact that the surface properties of the slag material and the physiochemical interactions between the slag material and added gypsum (under the influence of the treatment temperature) which were found to have played vital roles during the process [6] were not considered during the model formulation. This necessitated the introduction of correction factor, to bring the model-predicted compressive strength to those of the corresponding experimental values.
Deviation (Dv) of model-predicted setting time from that of the experiment [6] is given by

Correction factor (Cr ) is the negative of the deviation i.e

Therefore
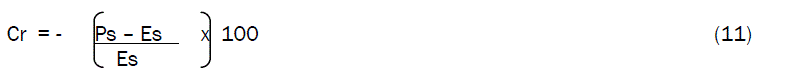
Where
Ps = Model-predicted setting time ( mins.)
Es = Setting time obtained from experiment (mins.)
Cr = Correction factor (%)
Dv = Deviation (%)
Introduction of the corresponding values of Cr from equation (11) into the model gives exactly the corresponding experimental setting time.
Comparative analysis of Figs. 6 shows that the maximum deviation of the model-predicted slag cement setting time from the corresponding experimental values is less than 11% and quite within the acceptable deviation limit of experimental results.

Figure 6: Variation of model-predicted setting time with its associated deviation from experimental values
These figures show that least and highest magnitudes of deviation of the model-predicted setting time (from the corresponding experimental values) are + 10.46 and – 2.32 % which corresponds to setting times: 15.6853 and 28.522 mins. /% as well as concentration of gypsum addition: 5 and 2 % respectively.
Analysis of Figs. 6 and 7 indicates that the orientation of the curve in Fig. 7 is opposite those of the deviation of model-predicted setting time in Fig. 6. This is because correction factor is the negative of the deviation as shown in equations (10) and (11). It is believed that the correction factor takes care of the effects of the surface properties of the slag material and the physiochemical interaction between the slag material and the added gypsum which (affected experimental results) were not considered during the model formulation. Fig. 7 indicate that the least and highest magnitudes of correction factor to the model-predicted compressive strength are – 10.46 and + 2.32 % which corresponds to setting times: 15.6853 and 28.522 mins. / % as well as concentration of gypsum addition: 5 and 2 % respectively.

Figure 7: Variation of correction factor (to model-predicted values) with setting time
The setting time predicted by the derived model (equation (6)); γ = 0.7168 α2 – 9.2965 α + 44.2478 is based on the concentration of gypsum addition. Optimization of gypsum addition was achieved by differentiating the derived models (equations (6)) with respect to α (and equating to zero) in order to determine the value of α at which γ is minimum.

Differentiation of equations (12) with respect to α reduces them respectively to;


The value of α = 6.4847 %, evaluated from equations (14) is the optimum concentration of gypsum addition which invariably gives the minimum setting time, γ as 14.1054 mins. on substituting the value of α = 6.4847 % into the derived model in equation (6).
Fig. 8 shows that beyond 6.4847% gypsum addition, the slag cement setting time increases drastically; a situation typifying immiscibility and lack of homogeneity between the cement slurry and the extra gypsum addition. This is because increased gypsum addition (above a specified quantity) is unlikely to forms a coherent mass with a specified and fixed liquid volume, resulting to delayed and differential setting.

Figure 8: Predicted minimum setting time of the slag cement at predicted optimum concentration of gypsum addition
Confirmation of the minimum and optimum values of γ and α respectively was carried out by substituting an assumed range of values of the concentration of gypsum addition α = 8, 10, 12 and 15 %.
An empirical evaluation of slag cement minimum setting time (SCMST) was successfully carried out through optimization of gypsum addition to foundry slag in the course of the cement production. A model was derived and used as a tool for predictive analysis of the cement setting time based on gypsum input. The model aided optimization of gypsum addition indicated a minimum setting time of 14.1054 minutes at an optimum gypsum input concentration of 6.4847 %. Beyond 6.4847% gypsum addition, the slag cement setting time increased drastically; a situation typifying immiscibility and lack of homogeneity between the cement slurry and the extra gypsum addition. This is because increased gypsum addition (above a specified quantity) is unlikely to forms a coherent mass with a specified and fixed liquid volume, resulting to delayed and differential setting. The slag cement setting time per unit gypsum addition are as obtained from experiment and derived model are 4.75 and 4.996 mins./ % respectively. Statistical analysis of the experimental and derived model-predicted results for each value of the gypsum input concentration considered shows standard errors of 1.8974 and 1.5485% respectively. Deviational analysis indicates 10.46% as the maximum deviation of the model-predicted slag cement setting time from the corresponding experimental value. The validity of the model was rooted on the expression 0.0226 γ + 0.2101 α = 0.0162 α2 + 1 where both sides of the expression are correspondingly approximately equal. The validity of the derived model-predicted results also was ascertained using SPSS 17.0. The results indicate check variance = 0.001, standard deviation = 0, and model operational confidence of 95.0% at a significant level: 0.05.