1Business School, Jilin University, Changchun, Jilin, 130012, P.R. China
2Mathematics School, Jilin University, Changchun, Jilin, 130012, P.R. China
Received: 29/08/2015 Accepted: 20/11/2015 Published: 30/11/2015
Visit for more related articles at Research & Reviews: Journal of Statistics and Mathematical Sciences
In this paper, we use a kind of cubic-spline-interpolation to approximate the Lorenz curves of urban and rural area in China, respectively. According to the Gini index reported by State Statistics Bureau of China in January 2014, we aggregate the Lorenz curves of urban and rural area in China, and obtain the national Lorenz curves of whole China from 2003 to 2013.
Cubic spline interpolation, Lorenz curve, Gini index, Lorenz curve aggregation.
Lorenz curve and Gini index are important tools to measure the income distribution of the residents. Normally Lorenz curve is defined on the interval[0,1]and it is increasing, convex, continuous curve. Else, Lorenz curve satisfies L(0) = 0, L(1) =1. As the Figure 1 shows, the curve OE1 E2 E3 E4 L is the Lorenz curve, the diagonal OL means income distribution is totally equal. On the other hand, the broken line OXL means the income is distributed nonuniform extremely. The bigger distance between Lorenz and diagonal, the more unequal income distribution is. A lot of papers have been published in this área [1-5]. The Lorenz curves of rural and urban area from 2003 to 2013 have been reported in China Statistical Yearbook, but the Lorenz curve of whole China has not published yet. In this paper, we firstly use a kind of cubic spline interpolation [6] to approximate Lorenz curves of urban and rural area in this paper, respectively. Then we propose an aggregation approach to obtain the Lorenz curve of whole China referring to the Gini index (2003-2013) reported by State Statistics Bureau in January 2014. We select the average income of rural area to average income of urban area ratio α appropriately, and obtain the national Lorenz curve and Gini index using our proposed aggregation approach, such that the Gini index of each year equals to the Gini index reported by the State Statistics Bureau of China exactly.
A kind of cubic spline interpolation
In this paper, we use a kind of cubic-spline-interpolation at a special endpoint condition(6) to estimate Lorenz curve. In this way, the advantages of the cubic spline interpolation are that it can fit grouped data exactly and maintain the convexity of the curve in most cases. The procedure is as following:
The Lorenz curve is a monotonously increasing convex function (Figure 1), this is means that the first derivative of the Lorenz curve is greater than zero . and second derivative of the Lorenz curve is non-negative. We approximate the Lorenz curve by a cubic spline interpolation function y = s(x) .
Denote the interpolation knots by  ,
,  , the corresponding values of the cubic spline function s(x) in the knots are
  ,
,  . The second derivative
  of s(x) in each interval is linear function. Let
  We have
 ,
, , where
  ,i =1,2...n . (1)
While 
 (2)
(2)
Here , mi satisfies the following equations:
 , i =1,2,3...n −1. (3)
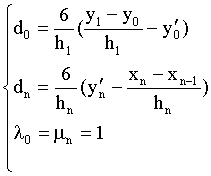
with two boundary conditions:
 (4)
(4)
Usually people take the boundary conditions as following:
 (5)
(5)
But under the boundary conditions(5)above, the cubic spline curve may not satisfy the convexity requirement.
Through the numerical experiment, we found when taking
 (6)
(6)
the approximated Lorenz curves we tested are always monotonously increasing and smooth convex function. This point is the key of our approach.
In this condition the formula of Gini index is
 (7)
(7)
A lorenz curve aggregation formula
Let P1 be the population of urban area, and P2 be the population of rural area, P = P1 + P2 denote the national population. The population of urban area to nation ratio is  , ,for rural area is
  .
.
Income distribution function and it’s inversion :
 (8)
(8)
where pi is cumulative population share, x is income
Density function of income distribution :
 (9)
(9)
Lorenz curve:
 (10)
(10)
Average income μi
 (11)
(11)
Derivation of Lorenz curve:
 (12)
(12)
i =1,2 (while i=1, it denotes urban area i=2, it denotes rural area:
Aggregation income distribution function:
 (13)
(13)
Our derivation of Aggregation Lorenz curve is as following :


 (14)
(14)
Where aggregation average income:
 (15)
(15)
Obviously we have
 (16)
(16)
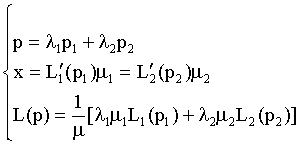
Our aggregation formula is as following:
 (17)
(17)
Estimating lorenz curve of China by aggregation approach
Firstly, according to the data from China Statistical Yearbook (2014) in [7], we do the numerical computations by cubic spline interpolation formula (3),(4) and (6), and obtain the Lorenz curve and Gini index of rural and urban area.(2003-2013). Then we estimate the Lorenz curve of whole China by our aggregation formula.
From the formula (17) we can see that when  are given, the aggregating Lorenz curve L( p) and the Gini index only depend on the ratio
  of each year (the values of μ1 and μ2 can magnify or reduce at this ratio). Comparing
the Gini index reported in State Statistics Bureau in January 2014, we adjust the value of α and calculate the aggregation Lorenz curves and Gini indexies (2003-2013), such that the calculation Gini index of each year equals to Gini index reported in State Statistics Bureau exactly. Finally we get the national Lorenz curve of China (2003-2013). The computation results are as following Tables 1 and 2.
In this paper, we proposed a kind of cubic spline interpolation to estimate Lorenz curve and an approach to aggregate the Lorenz curve of urban and rural areas. Through the numerical experiment, we apply theses tow approaches to the income data of rural an urban of China and get the aggregation Lorenz curves of China (2003-2013). The computation results show that these two approaches are effective. The results we get have some reference value.
The work is supported by grant (11271041) of Chinese National Science Foundation and Jilin University Philosophy and Social Science Fund (2011QY093).