At present days, it is a challenging job to detect network attacks as an unsupervised detection. Various methods proposed to work the problem regarding network attack and determine a solution using specialized signatures, but technique is expensive to follow out and hard to generate labeled traffic data sets for profiling. In this study, we focus on unsupervised approach to detect new kinds of network attacks not seen before. Clustering technique is used to find out inconsistent traffic flows. Clustering algorithm is applied for constructing specific filtering rules automatically so that it can characterize different attacks as well as provides easy interpreted information to the network operator. More ever rules united to make a signature, which can directly exported/transfer towards security devices like IDSs and/or Firewalls. This approach finds different attack without knowledge of traffic. Unsupervised Network Anomaly Detection Algorithm is used for knowledge-independent detection of anomalous traffic. UNADA uses a novel clustering technique based on Sub-Space-Density clustering to identify clusters and outliers in multiple low-dimensional spaces. The evidence of traffic structure provided by these multiple clustering is then combined to produce an abnormality ranking of traffic flows, using a correlation-distance-based approach.
Keywords |
| Network attack, Signature generation, clustering algorithm, Network security. |
INTRODUCTION |
| Now days to discover the network attack on internet world, it is challenging task numerous amount of attack are found
such as Denial of Service attacks (DoS) [1], Distributed DoS (DDoS) [2], web/host scans [3], and spreading worms or
viruses [4] and many more different attacks that daily threaten the integrity and normal operation of the network. The
main challenge in automatically detecting and analyzing network attacks is that these are a moving and ever-growing
target [5]. Main idea to detect and analyze network, which affected by an attack, is that these are a moving and evergrowing
target. Under this condition it is important to develop the security system, which can help to find out an attack or
generate the alternative solution, prevent from an attack. |
| There are different approaches are consider as providing security among these Two different approaches are mainly
consider for to find out a solution : signature-based detection[6] and anomaly detection[7]. |
| Signature-based detection systems developed to protect the network using signature matching technique and are highly
effective to detect those attacks which they are programmed to alert on but I cannot defend the network against unknown
attacks as well as it's not a cost effective technique because for building new signatures [6,8]. While, Anomaly detection
uses to detect anomalies as activities that deviate from this baseline. Such methods can discover new forms of network
attacks not considered before. Similarly, these techniques is not a cost effective technique Because it detects known
attacks, only a signature required for every attack every bit well as novel attacks cannot be detected [7,8]. |
| Under this circumstance, it is necessary to develop cost effective technique, which can help build solution for
unsupervised detection. The solution above mention challenges is clustering algorithms; it can used to detect both known or completely unknown attack as well as automatically produce interpret signatures to characterize them, both in an online
basis. The complete detection and characterization algorithm runs in three consecutive phases. |
| 1) The first measure lies in detecting an anomalous time slot where an approach might be concealed. For doing so, the
time series made for basic traffic metrics such as number of bits, data packets, and IP information flows per time slot
using the flow solution. Any generic anomaly detection based on time-series analysis [9, 10] then utilized in time series
to identify an anomalous slate. |
| 2) In the second stage, using as input the set of IP flows captured in the flagged time slot. The method uses robust
clustering techniques based on Subspace Clustering (SSC) [11], Density-based Clustering [12], and Evidence
Accumulation (EA) [13] blindly pull out the suspicious flows that compose the approach. |
| 3) In the third phase, the evidence of traffic structure provided by the clustering algorithms is applied to produce
filtering rules that characterize to detect the attempt[14] |
| The residue of paper highlighted as follows. Related work is reviewed in section II. The system model, architecture,
working of system model, advantages of our scheme described in section III. Implementation and proposed model given
in section IV. Implementation details and results addressed in section V. concludes the paper and presents some future
research work VI. Part of Reference used to write this work. |
RELATED WORK |
| Most approaches analyze statistical variations of traffic volume-metrics techniques (e.g., data packets, and IP
information) and/or other traffic features using either single link measurements or completely network-wide information.
The problem of network attacks and anomaly detection has extensively analyzed in the final ten. The main challenge in
automatically detecting and analyzing network attacks is that these are a moving and ever-growing target [5]. Taxonomy
allows previous knowledge to given to new attacks as well as providing a structured way to consider such attacks. The
proposed taxonomy aims to create categories that enable this to occur easily, so that similarities between attacks can
highlighted and used to combine new attacks. |
| A non-exhaustive list of methods includes the role of signal processing techniques (e.g., ARIMA, wavelets) on singlelink
traffic measurements [15], [16], and sketches applied to IP-flows [17] [18], Kalman filters [18] for network-wide
anomaly detection, anomaly detection algorithm based on time-series analysis [15] –[10], PCA [20] -[21] and sketches
applied to IP-flows and signature-based anomaly characterization [22]. And the sub-space approach is another wellknown
unsupervised anomaly detection technique, used in [20, 21] to detect network-wide traffic anomalies in highly
aggregated traffic flows. |
| To keep off the lack of robustness of general clustering techniques, I have prepared a parallel-multi-clustering approach,
combining the notions of Density-based Clustering [12], Subspace Clustering [11], and Evidence Accumulation [13]. The
particular details of the algorithm are fully documented in [23]. Clustering is performed in very-low-dimensional subspecies,
which is faster than clustering in high-dimensional spaces [24]. |
| The Fisher Score (FS) [25], basically measures the separation between clusters, relative to the total variance within each
subdivision. The vast volume of the unsupervised detection schemes proposed in the literature is based on clustering and
outliers detection, being [26,27] some relevant examples. In [26], the authors utilize a single-linkage hierarchical
clustering method to cluster data from the KDD’99 dataset, based on the standard Euclidean space for inter-patterns
similarity. In [28] reports improved results in the same data set, using three different clustering algorithms: Fixed-Width
clustering, an optimized version of k-NN, and one class SVM [27] presents a combined density-grid-based clustering
algorithm to improve computational complexity, obtaining similar detection results. |
| From literature work mention above some objective some solve the problem regarding network attacks, The main of the
our work to design a cluster base system for completely detect unsupervised detection and construct a signature for
anomalous flow of data. In order to accomplish the proposed idea. |
SYSTEM MODEL |
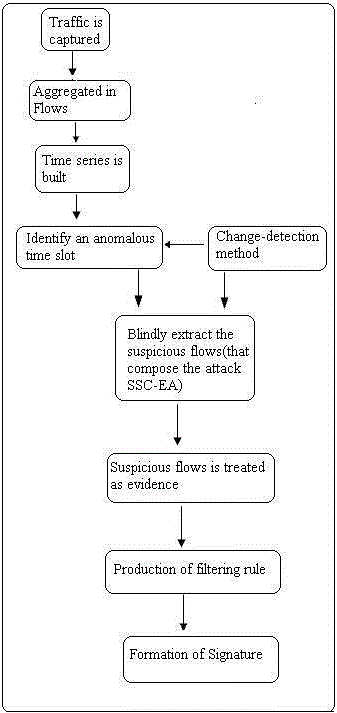
| Our main idea is to detect both known, as well as unusual people and unknown attack. This is caused by the production
of signature that determine the attack in an online basis algorithm that is being used for characterizing the attack will
persist in following stages[29], which is being represented by flow as depicted below in figure 1 . |
| This came after the three consecutive stages. Firstly, using a temporal sliding-window approach, traffic is caught and it is
aggregated in flows. This is performed using different stories of traffic aggregation. For simple traffic metrics such as
number of bytes, flows in each time slot, the time series made. In addition, any change-catching method used to identify
an anomalous time slot. In the second stage, unsupervised detection algorithm begins, using as input the set of IP flows
captured in the flagged time slot. The method uses robust clustering techniques based on Sub-Space Clustering (SSC) ,
Density-based Clustering, and Evidence Accumulation (EA), to blindly extract the suspicious flows that compose the attack. In the third stage, the evidence of traffic structure provided by the clustering algorithms is used to produce
filtering rules that characterize to detect the attack. |
SYSTEM IMPLEMENTATION |
A. Stages of Implementation |
| Step 1:- To capture the packet of data which takes as input all the IP flows in flagged time slot by using analyzer i.e.
Create Log file. |
| Step 2:- IP flows are additionally aggregated at different flow-resolution levels using different aggregation keys and
apply sliding time windowing scheme for every 1sec. |
| Step 3:- Create the feature space matrix by using following formula x(1) = [sipadd dipadd sport dport
nsipadd/ndipadd y(1)/ndipadd] |
| Similarly, we have to create feature space matrices (i.e. clusters) for all time windows data set.i.e., X=Σ(x1,x2…….xn)
and then apply Clustering algorithm and declare smallest group of cluster as outlier. |
| Step 4:- Detect anomalies using k-means clustering algorithm, evidence accumulation and outliers ranking. |
| Step 5:- Create a signature. Signature will be logged and updated in the signature table. Signature table can be use in
for online detection anomalous flow. |
| Step 6:- To detect the attack in the future this signature can ultimately be integrated to any standard security device.
There is filtering rules are combined into a new traffic signature that characterizes the attack in simple terms. |
B. K-Means Algorithm |
| K-means algorithm [24,29] as the underlying clustering algorithm to produce clustering ensembles. First, the data is split
into a large number of compact and small clusters; different decompositions are obtained by random initializations of the
K-means algorithm. The data organization present in the multiple clustering is mapped into a co-association matrix,
which provides a measure of similarity between patterns. The final data partition is obtained by clustering this new
similarity matrix [30]. |
| The primary steps of the K - means algorithm are as follows, |
| 1. Choose an initial partition with N clusters; repeat steps 2 and 3 until cluster membership stabilizes. |
| 2. Bring forth a new partition by assigning each pattern to its closest cluster centre. |
| 3. Compute new cluster of each centers. |
C. Evidence accumulation and outliers ranking |
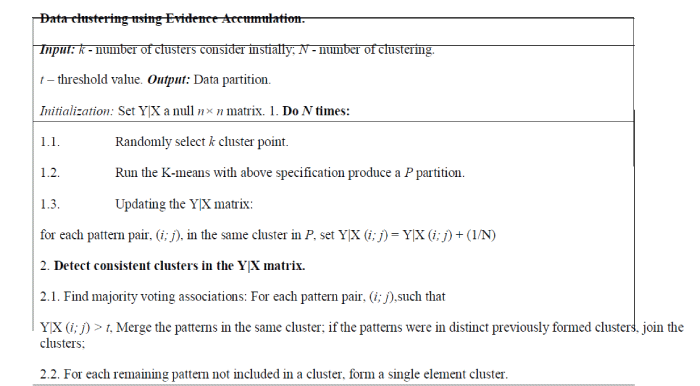
| The idea of evidence accumulation-based clustering is to fuse the results of multiple clustering into a single data
partition, by viewing each clustering result as an independent evidence of data governance. There are various potential
ways to gather evidence in the context of unsupervised learning: |
| (1) Combine results of different clustering algorithms. |
| (2) Produce different results by re-sampling the data. |
| (3) Running a given algorithm many times with different parameters or initializations. The overall method for evidence
collection-based clustering is below. |
 |
EXPERIMENTAL RESULT |
| For experimental propose we can use used analyzer i.e. NetworkActiv PIAFCTM [31], and MATLAB[32], the power of
the unsupervised algorithm to detect and construct a signature for different attack in real traffic. Initially we work with
packet traces, the shadows are not marked, and thus analysis will be determined to show how the unsupervised approach
can find anomalies and characterize different network attack without using signatures, labels, or scholarship. On that,
point is to detect the port scan attack, and it refers to TCP/UDP ports. Regarding filtering rules, these require the number
of sources and destinations and the fraction of packets combining them produces a signature. Surprisingly the extracted
signature matches quite closely the standard signature used to detect an attempt. |
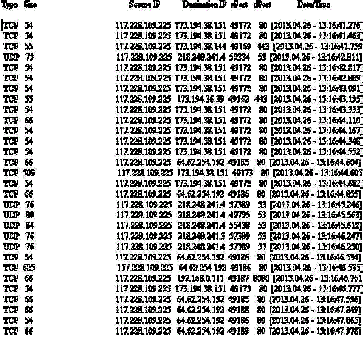
| We can create network packet transfer log file using NetworkActiv PIAFCTM in packet mode. At one time an operation
starts it can apply an output using various factors such as Type, Size, Source and Destination IP, Source and Destination
port and Time and date information shown in below figure 2. As after generating data, apply sliding time windowing
scheme for after a second and IP flow are aggregated at similar time the feature space matrix by using following formula
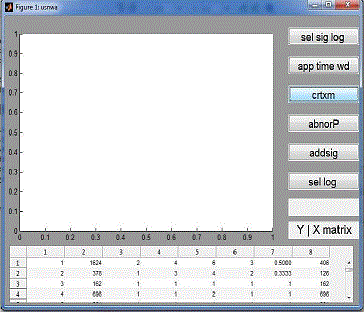
mention in step 3. It produces the number of cluster. It observed, the first column occurs tag values, second column
contains the flow of data i.e., Y. And (from column three to eight is feature space) third column is sip, fourth column dip,
the fifth column is a sport, sixth column is deported, seventh column is ratio of sources IP address to number of
destination IP address and eight columns is the proportion of flow of data to a number of destination IP address. Show in
figure 3. |
| The GUI of Our system has various button labeling functionality of each button shown below table 1. |
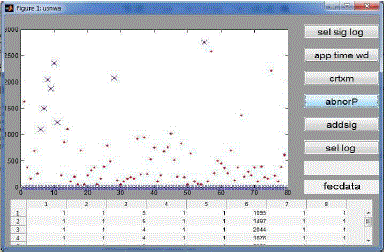
| To see the anomalies by using k-means clustering algorithm, evidence accumulation and outlier ranking.g. From that
outlier, we cause to gather the information about source IP, destination IP and time for that cause to trace back into the
feature space matrix, aggregation and log file. The detective work of a group of anomalous flows is to automatically
produce a lot of filtering rules to characterize the network attacks. Here it detects the port scan attack. Port scan attack
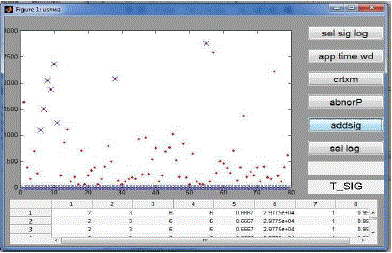
refers to scan TCP/UDP port as shown in figure 4. To produce the signature used addsig function from the GUI. It will update in the signature table. Lastly, I have detected anomalous traffic flows, and network attack such as port scan attack
as shown in figure 5. |
CONCLUSION AND FUTURE SCOPE |
| The completely unsupervised algorithm for detection of network attack that uses exclusively unlabeled data to identify
and characterize network attack without needing any form of signature, particular model, or canonical data distribution.
This allows detecting new, previously unseen network attack, even without using statistical learning. We establish how to
employ the algorithm automatically construct signatures of network attack without relying on any form of previous
information. An attack can applied to devise autonomous network security arrangements, in which the Subspace
clustering (SSC) and Evidence Accumulation based algorithm applied in latitude to any standard security device,
producing specific signatures to unknown anomalous events. Finally, Results confirm that the use of the algorithm for
on-line unsupervised detection and automatic generation of signatures is possible and easy to achieve for the network
attack and anomaly detection that analyzed. In this report, we have suggested an idea, which is still young, and a great
deal of work needs to be performed to fix the model perfectly. Though we have several challenges to be assembled to
solve more efficiently in our proposed model, we believe with our future research it is not far to establish such
infrastructure. |
Tables at a glance |
 |
 |
| Table 1 |
Table 2 |
|
| |
Figures at a glance |
 |
 |
 |
 |
 |
| Figure 1 |
Figure 2 |
Figure 3 |
Figure 4 |
Figure 5 |
|
| |
References |
- Carl, G.; Kesidis, G.; Brooks, R.R.; Rai, S., "Denial-of-service attack-detection techniques," Internet Computing, IEEE , vol.10, no.1, pp.82,89,
Jan.-Feb. 2006 doi: 10.1109/MIC.2006.5
- Wonjun Lee; Squicciarini, A.C.; Bertino, E., "Detection and Protection against Distributed Denial of Service Attacks in Accountable Grid
Computing Systems," Cluster, Cloud and Grid Computing (CCGrid), 2011 11th IEEE/ACM International Symposium on , vol., no., pp.534,543,
23-26 May 2011 doi: 10.1109/CCGrid.2011.28
- Selamat, S.R., "Web server scanner: scanning on IIS CGI and HTTP," Communications, 2003. APCC 2003. The 9th Asia-Pacific Conference
vol.3, no., pp.919,923 Vol.3, 21-24 Sept. 2003 doi: 10.1109/APCC.2003.1274232
- Zesheng Chen; Lixin Gao; Kwiaty, K., "Modeling the spread of active worms," INFOCOM 2003. Twenty-Second Annual Joint Conference of the
IEEE Computer and Communications. IEEE Societies , vol.3, no.,
- pp.1890,1900 vol.3, 30 March-3 April 2003doi: 10.1109/INFCOM.2003.1209211
- Zheng Wu; Yang Ou; Yujun Liu, "A Taxonomy of Network and Computer Attacks Based on Responses," Information Technology, Computer
Engineering and Management Sciences (ICM), 2011 International Conference on , vol.1, no., pp.26,29, 24-25 Sept. 2011doi:
10.1109/ICM.2011.363
- Ngoc Thinh Tran; Tomiyama, S.; Kittitornkun, S.; Tran Huy Vu, "TCP reassembly for signature-based Network Intrusion Detection systems," 9th
International Conference Electrical Engineering/Electronics, Computer, Telecommunications and Information Technology (ECTI-CON), 2012
pp.1,4, 16-18 May 2012 doi: 10.1109/ECTICon.2012.6254336
- Weiyu Zhang; Qingbo Yang; Yushui Geng, "A Survey of Anomaly Detection Methods in Networks," International Symposium on Computer
Network and Multimedia Technology, 2009. CNMT 2009., vol., no., pp.1,3, 18-20 Jan. 2009 doi: 10.1109/CNMT.2009.5374676
- Casas, P.; Mazel, J.; Owezarski, P., "Steps Towards Autonomous Network Security: Unsupervised Detection of Network Attacks," 4th IFIP
International Conference on New Technologies, Mobility and Security (NTMS), 2011 , pp.1,5, 7-10 Feb. 2011doi: 10.1109/NTMS.2011.5721067
- P. Barford, J. Kline, D. Plonka, A. Ron, “A Signal Analysis of Network Traffic Anomalies”, in Proc.
- ACM IMW, 2002.Pages 71-82ACM New York, NY, USA ©2002 ISBN:1-58113-603-X. doi>10.1145/637201.637210
- Cormode, G.; Muthukrishnan, S., "What's new: finding significant differences in network data streams," INFOCOM 2004. Twenty-third Annual
Joint Conference of the IEEE Computer and Communications Societies , vol.3, no., pp.1534,1545 vol.3, 7-11 March 2004 doi:
10.1109/INFCOM.2004.1354567
- L. Parsons et al., “Subspace Clustering for High Dimensional Data: a Review”, in ACM SIGKDD Expl. Newsletter, vol. 6 (1), pp. 90-105,
2004.L. Parsons et al., “Subspace Clustering for High Dimensional Data: a Review”, in ACM SIGKDD Expl. Newsletter, vol. 6 (1), pp. 90-105,
2004.
- Martin Ester , Hans-peter Kriegel , Jörg S , Xiaowei Xu , "A density-based algorithm for discovering clusters in large spatial databases with
noise", pages 226--231, publisher :AAAI Press.
- Fred, A.L.N.; Jain, A.K., "Combining multiple clustering’s using evidence accumulation," Pattern Analysis and Machine Intelligence, IEEE
Transactions on , vol.27, no.6, pp.835,850, Jun 2005doi: 10.1109/TPAMI.2005.113 URL:
http://ieeexplore.ieee.org/stamp/stamp.jsp?tp=&arnumber=1432715&isnumber=30761
- Casas, P.; Mazel, J.; Owezarski, P., "Knowledge-independent traffic monitoring: Unsupervised detection of network attacks," Network, IEEE ,
vol.26, no.1, pp.13,21, January-February 2012 doi: 10.1109/MNET.2012.
- P. Barford, J. Kline, D. Plonka, A. Ron, “A Signal Analysis of Network Traffic Anomalies”, Proceedings of the 2nd ACM SIGCOMM Workshop
on Internet measurment Pages 71-82 ACM New York, NY, USA ©2002 ISBN:1-58113-603-X doi>10.1145/637201.637210
- J. Brutlag, “Aberrant Behavior Detection in Time Series for Network Monitoring”, Proceedings of the 14th USENIX conference on System
administration Pages 139 - 146 USENIX Association Berkeley, CA, USA ©2000 .
- B. Krishnamurthy et al., “Sketch-based Change Detection: Methods, Evaluation, and Applications”, Proceedings of the 3rd ACM SIGCOMM
conference on Internet measurement Pages 234 - 247ACM New York, NY, USA ©2003 ISBN:1-58113-773-7 doi>10.1145/948205.948236.
- G. Dewaele et al., “Extracting Hidden Anomalies using Sketch and non Gaussian Multi-resolution Statistical Detection Procedures”, Proceedings
of the 2007 workshop on Large scale attack defense Pages 145-152 ACM New York, NY, USA ©2007 ISBN: 978-1-59593-785-8
doi>10.1145/1352664.1352675
- Soule et al., “Combining Filtering and Statistical Methods for Anomaly Detection”, Proceedings of the 5th ACM SIGCOMM conference on
Internet Measurement Pages 31-31USENIX Association Berkeley, CA, USA ©2005
- Lakhina, M. Crovella, C. Diot, “Diagnosing Network-Wide Traffic Anomalies”, Proceeding SIGCOMM '04 Proceedings of the 2004 conference
on Applications, technologies, architectures, and protocols for computer communications Pages 219-230 ACM New York, NY, USA ©2004
- [21] A. Lakhina, M. Crovella, C. Diot, “Mining Anomalies Using Traffic Feature Distributions” Proceedings of the 2005 conference on
Applications, technologies, architectures, and protocols for computer communications Pages 217-228 ACM New York, NY, USA ©2005
ISBN:1-59593-009-4 doi>10.1145/1080091.1080118
- G. Fernandes, P. Owezarski, “Automated Classification of Network Traffic Anomalies”, Security and Privacy in Communication Networks
Lecture Notes of the Institute for Computer Sciences, Social Informatics and Telecommunications Engineering Volume 19, 2009, pp 91-100 Print
ISBN 978-3-642-05283-5, DOI- 10.1007/978-3-642-05284-2_6 ISBN:1-58113-862-8 doi>10.1145/1015467.1015492
- P. Casas, J. Mazel, P. Owezarski, “Sub-Space Clustering & Evidence Accumulation for
- Unsupervised Network Anomaly Detection”, Proceedings of the Third international conference
- on Traffic monitoring and analysis Pages 15-28 Springer-Verlag Berlin, Heidelberg ©2011 ISBN: 978-3-642-20304-6
- Jain, “Data Clustering: 50 Years Beyond K-Means”, Published in Journal Pattern Recognition Letters archive Volume 31 Issue 8, June, 2010
Pages 651-666 Elsevier Science Inc. New York, NY, USA doi>10.1016/j.patrec.2009.09.011
- T. Jaakkola and D. Haussler, “Exploiting Generative Models in
- Discriminative Classifiers.”, Proceedings of the 1998 conference on Advances
- in neural information processing systems II Pages 487-493 MIT Press Cambridge, MA, USA ©1999
- L. Portnoy, E. Eskin, S. Stolfo, “Intrusion Detection with Unlabeled Data Using Clustering”,In Proceedings of ACM CSS Workshop on Data
Mining Applied to Security (DMSA-2001) pages :5-8,ISBN:0-262-11245-0
- K. Leung, C. Leckie, “Unsupervised Anomaly Detection in Network Intrusion Detection Using Clustering”, ACSC '05 Proceedings of the
Twenty-eighth Australasian conference on Computer Science - Volume 38 Pages 333-342 Australian Computer Society, Inc. Darlinghurst,
Australia, Australia ©2005 ISBN:1-920-68220-1
- Eleazar Eskin,Andrew Arnold,Michael Prerau,Leonid Portnoy,Sal Stolfo ,"A Geometric Framework for Unsupervised Anomaly Detection",
Applications of Data Mining in Computer SecurityAdvances in Information Security Volume 6, 2002, pp 77-101, DOI> 10.1007/978-1-4615-
0953-0_4, Print ISBN 978-1-4613-5321-8
- Pragati H. Chandankhede, Sonali U. Nimbhorkar, "Autonomous Networ Security for Detection of Network Attacks ", International Journal of
Scientific and Research Pu blications, Volume 2, Issue 1, January 2012 ,ISSN 2250-3153 , pp 1-4
- oonsanit, K.Jaruskulchai, C. ; Eiumnoh, "A.Parameter-Free K-Means Clustering Algorithm for Satellite Imagery Application", Information
Science and Applications (ICISA), 2012 International Conference on Information Science and Applications, 23-25 May 2012 Kyonggi
University, Suwon, Republic of Korea, pp 1 - 6 , ISBN: 978-1-4673-1402-2 , Digital Object Identifier : 10.1109/ICISA.2012.6220961
- www.networkactiv.com/PIAFCTM.html
- www.mathworks.in/products/matlab/
|