Keywords
|
| Data mining, clustering, k-means, multiobjective, AMOSA, GenClustMOO. |
INTRODUCTION
|
| Data mining [9] is the task of discovering interesting patterns from large amounts of data, can be stored in databases, data warehouses, or other related information repositories. Data mining is used to finding hidden information sources in a database. The overall goal of the data mining process is to extract information from a dataset and transform that process into an understandable structure for further use. Data mining is knowledge discovery from data extraction of interesting patterns of non-trivial, implicit, previously unknown value and potentially useful or knowledge from huge amount of data. A cluster is a collection of data objects that are similar to one another within the same cluster and are dissimilar to the objects in other clusters. Clustering is also called as data segmentation. In some applications clustering partitions large data sets into groups based on the similarity. Clustering is a form of learning by examples. Clustering allows us to run applications on several parallel servers (cluster nodes). Clustering is crucial for scalable enterprise applications can improve the performance by adding more nodes to the cluster. Clustering applications are used extensively in various fields such as AI, pattern recognition, economics, ecology, psychiatry and marketing etc.The k-Means is a simple learning algorithm for clustering analysis. |
| K-means[14],[15] is one of the Partitioning based technique in which it classifies the data into k groups, which together satisfy the following two needs, each group must contain at-least one object, and each object must belong to exactly one group. K-means clustering is an effective algorithm to extract a given number of clusters of patterns from a training set, the cluster locations can be used to classify patterns into distinct classes. The k-means clustering algorithm takes the input parameter as k and partitions a set of n objects into k clusters the resulting intra cluster similarity is high and the inter cluster similarity is low. Cluster similarity is measured using the mean value of the objects in a cluster called as the clusters centroid or center of gravity. In the k-means algorithm there is also drawback that is impractical to expect a user to specify the number of clusters k-value; it may find worse local optima. To overcome these drawbacks use the multiobjective clustering techniques. |
| In this paper proposed the multiobjective clustering technique. The goal of Multi Objective clustering [5] is to find clusters in a data set by applying several clustering algorithms corresponding to different objective functions .This has satisfy the three objective functions as the partitioning based on the Euclidean distance, the total symmetry of the clusters, and the last one is the cluster connectedness and processed by using AMOSA and genetic algorithm. The Multi Objective Optimization (MOO) problem has different perspective compared with one single objective. In the singleobjective optimization there is only one global optimum, but in MOO there is a set of solutions, called the Pareto- Optimal (PO) set, which are considered to be equally important which means local as well as global can be combined to form the best solution. The past work has with the number of Multi Objective Evolutionary Algorithms (MOEAs) have been evolved. The Evolutionary Algorithms (EAs) had came for solving multiobjective optimization in their populationbased technique ability to find multiple optimal solutions simultaneously. |
| The Genetic Algorithm (GA) [6] is an adaptive heuristic search algorithm based on the evolutionary ideas of natural selection and genetics. They provide best optimal solutions for a given objective or fitness function. This can be formed by means of complex, large, and multimodal landscapes. In GA‘s [1] the parameters are encoded in the form of strings or chromosomes in the search spaces. A fitness function is associated with each string that called as the degree of the solution that encoded in it. GA has processes different operators or parameters like selection, crossover, and mutation are used over a number of generations for generating potentially better strings as center point. |
| In Simulated Annealing (SA) [2] is popular search algorithm used for solving difficult optimization problem based on principles of statistical mechanics. A measure of the amount of domination between two solutions can be used to find by the SA. SA uses the principles of statistical mechanics based on the behavior of a large number of clusters at low temperature for finding minimum cost solutions to large optimization problems by minimizing the associated energy. In statistical mechanics investigating the ground states or low-energy states of matter is fundamental importance. These states of clusters are achieved at very low temperatures only. AMOSA which incorporates a novel concept of amount of dominance in order to determine the acceptance of a new solution. The PO solutions are stored in an archive. In Paretodomination is based AMOSA developed to accept the certain condition of rules between the current solution and a new solution with the difference between the number of solutions that they can dominate. By these in this paper see about the GAMOO and AMOSA optimization algorithm to find the best center points based on their performance. |
AMOSA AND GENCLUSTMOO WITH K-MEANS
|
| In these there are two modules are used to get the automatic k-value that is Clustering Using GenClustMOO and k- Means, Clustering Using AMOSA and k- Means. |
2.1. Clustering Using GenClustMOO and k- Means
|
| In GenClustMOO each cluster is divided into several small non-overlapping hyper spherical shaped in sub-clusters. Then each cluster is represented by the centers of these individual sub-clusters. Taken as example a particular string encodes the centers of k number of clusters and each cluster is divided into C number of sub-clusters. If the data set is of dimension d, then the length of the string will be C × k × d. Initialization procedure is partly random and partly based on two different single-objective algorithms in order to obtain a good as initial solutions. Then remaining solutions in the archive are initialized after running single linkage clustering algorithm for different values of k. Let for the ith chromosome we execute single linkage clustering algorithm with k = 3 then for each of these three clusters sub-cluster centers will be selected randomly from the points belonging to that particular cluster formed. These solutions works well for, when clusters present in the datasets are well-separated. Another set of solutions in the archive are generated using the k-means algorithm. |
| Assignment of Points |
| For the purpose of assignment, each sub-cluster is considered as a separate cluster. Let the particular string contain k number of clusters. Assignment of points is done based on the Euclidean distance condition. A data point xj is assigned to the (i, l) th sub cluster as in equation (1) C is equal to the total number of sub-cluster centers per cluster |
 |
| Symmetry Index |
| This cluster validity index is based on a newly developed point symmetry based distance dps(x ?, c ?), which is to calculated. Let a point be x. The symmetrical or reflected point of x with respect to a particular center c is 2 ×c ? − x ?. The new cluster validity function Sym is defined as equation (2) |
 |
| Measuring the points by Validity Measures |
| This [7] way of measuring the connectivity among a set of points using relative neighborhood graph. The distance between a pair of points is measured in the following way based on Euclidean distance based cluster validity index [19], I-index third objective function is an Euclidean distance based cluster validity index, I-index equation (3). |
 |
| Crossover Operation |
| In crossover mechanism it mates with two parents to produce the new string ie.offspring in the crossover set the range 0.25 up to particular range it select the data points and form the center value from that it generates the number of clusters . |
| Mutation Operation |
| A new string is generated from the crossover mechanism of particular range of value as 0.25 will be selected for the next step as mutation in which it kept the range value as 0.05 .According to the mutation it changes the string one bit to zero bit and vice versa then once it satisfied the objective function it gives the center value then calculates the k-means value. |
| Selection of the Best Pareto optimal Solution |
| The algorithms produce a large number of non-dominated solutions based on the final Pareto optimal front in moo. Each solution provides a way of clustering the given data set. All the solutions are equally needed from the logical point of view. But the user needs only a single solution. As semi-supervised method of selecting a single solution from the set of solutions is now developed. |
| The class labels some of the points called as test patterns are understable to us. The proposed GenClust-MOO produces a set of Pareto optimal solutions. The clustering associated with each solution from the final Pareto optimal set is used to assign the cluster labels of the test patterns based on the nearest center criterion. |
2.2. Clustering Using AMOSA and k –Means
|
| An AMOSA is a Multi Objective version of SA; several concepts have been newly integrated. AMOSA generally uses the concept of an archive where the non-dominated solutions are stored. There are two types of limits are kept on the archive size: a hard limit denoted by HL, and soft limit denoted by SL, where SL > HL. The non-dominated solutions are usually get stored in the archive then it get generated. In the process, if some members of the archive get dominated by the new solutions, then these are removed. If at some point of time, the size of the archive exceeds a specified value, and then the clustering process is invoked. In AMOSA, the initial temperature is set to Tmax. Then, one of the points is randomly taken from the archive. This is called as the current-pt or the initial solution. The current-pt is disturbed to generate a new solution called as new-pt and then for that objective functions are computed. The domination status of the new-pt is checked with the current-pt and the generated solutions which are stored in the archive. A new solution forming the dominance quantity called the amount of domination, Δdom (a, b), between two solutions a and b is defined as follows equation (4) |
 (4) (4) |
| where fi (a) and fi(b) are the ith objective values of the two solutions and Ri is the range of the objective function computed from the individuals in the population. M is the number of objectives. It should satisfied the following cases. |
| Case 1: New-pt is either dominated by the current-pt or it is non dominating with respect to the current-pt, but some points in the archive dominate the new-pt.The new-pt is accepted as current-pt with a probability |
 ..................(5) ..................(5) |
| In Equation (5) Δ[dom]avg denotes the average amount of domination of the new-pt by (k + 1) points, namely, the current-pt and k points of the archive. Also, as k increases, Δ[dom]avg will increase since here the dominating points that are farther away from the new-pt are contributing to its value. |
| Case 2: Neither the current-pt nor the points in the archive dominate the new-pt. This different in F represents the current-pt and E represents the new-pt, G represents the current-pt and I represent the new-pt, F represents the current-pt and I represent the new-pt. for all these cases, accept the new-pt as the current-pt. in the archive the any points are dominated by new points then remove them from it. Add new-pt in the archive. If archive size crosses the SL, apply single linkage clustering to reduce its size to HL. |
| Case 2: Neither the current-pt nor the points in the archive dominate the new-pt. This different in F represents the current-pt and E represents the new-pt, G represents the current-pt and I represent the new-pt, F represents the current-pt and I represent the new-pt. for all these cases, accept the new-pt as the current-pt. in the archive the any points are dominated by new points then remove them from it. Add new-pt in the archive. If archive size crosses the SL, apply single linkage clustering to reduce its size to HL. |
 |
2.3. Algorithm
|
| GeneticClustMOO Steps |
| 1. Start with the generation of set of an initial population of randomly selected solutions from the sub clusters to find the center of clusters, then go to step 2. |
| 2. Evaluate the fitness of all individuals with checking of validility index, symmetry then go to step 3. |
| 3. Repeatedly do the following: |
| 3.1. Select fitter individuals for reproduction |
| 3.2. Recombine between individuals |
| 3.3. Mutate individuals |
| 3.4. Evaluate the fitness of the modified individuals |
| 4. Satisfied the best solution as Pareto optimal for forming corresponding centers. |
| 5. Then apply k-means and find the best center point for number of clusters to be formed. AMOSA Steps |
| 1. From Initial solutions different random center points generated go to step2. |
| 2. Apply the SA which should satisfy the dominance and non dominance of cases |
| 2.1 Case1: New-pt is either dominated by the current-pt or it is non dominating with respect to the current-pt. |
| 2.2 Case 2: Neither the current-pt nor the points in the archive dominate the new-pt. |
| 2.3 Case 3: New-pt dominates the current-pt but k points in the archive dominate the new-pt. |
| 3. Satisfied the best solutions as Pareto optimal for forming corresponding centers go to step 4. |
| 4. Then apply k-means and find the best center point for no of clusters to be formed K-means Steps |
| 1. Arbitrarily choose k data-objects from Pareto optimal solution (D) as initial centroids; |
| 2. Repeat the process until it get converge, |
| 2.1Assign each object in the sub cluster of group di to the cluster has the closest centroid. |
| 2.2Calculate new mean for each cluster; |
| 2.3 Until convergence criteria is met. |
EXPERIMENTAL RESULTS
|
3.1 .Datasets
|
| There are 6 [4] real time datasets are used it can gives the performance analysis of existing system with the better results. |
| Iris: This datasets consists of 150 data points distributed over 3 clusters. Each cluster has consists of 50 points. This dataset represents differently classify irises data sets can characterized by four feature values .It has three classes Setosa, Versicolor and Virginica. It has two classes Versicolor and Virginica have a large amount of overlap and the class Setosa is linearly separable. |
| Glass: This is a glass identification data consisting of 214 instances having 9 features (an Id# feature has been removed). The study of the classification of the types of glass was motivated by criminological investigation. At the scene of the crime, the glass left can be used as evidence, if it is correctly identified. There are 6 categories present in this data set. |
| Wine: This is the Wine recognition data consisting of 178 instances having 13 features resulting from a chemical analysis of wines grown in the same region in Italy but derived from three different cultivars. The analysis determined the quantities of 13 constituents found in each of the three types of wines. It has three classes class 1 -59, class 2 -71, class 3 -48. |
| Liver disorder: This is the Liver disorder data consisting of 345 instances having 6 features each. The data has two categories as the first 5 variables are all blood tests which are thought to be sensitive to liver disorders that might arise from excessive alcohol consumption. Each line in the liver disorder data file constitutes the record of a single gender individual, it appears that drinks>5 is some selector on this database. |
| Vehicle: To classify a given silhouette as one of four types of vehicle, using a set of features extracted from the silhouette. The vehicle may be viewed from one of many different angles. The number of attributes is 18 and number of classes is 4number of samples as examples is 946. 100 examples are being kept by Strathclyde for validation. So StatLog partners will receive 846 examples. |
| Cancer: The Wisconsin Breast Cancer data set, it consists of 698 sample points. Each pattern has 9 features are corresponding to clump thickness, cell size uniformity, cell shape uniformity, marginal adhesion, single epithelial cell size, bare nuclei, bland chromatin, normal nucleoli and mitoses. There are two categories of the data: are malignant and benign. These two classes are known and linearly separable. |
Performance Measures
|
| In order to evaluate the performance of all the optimization clustering algorithms with datasets .It is used a measure quantify the performance of a classification model. It taken as the class labels of each point are known. The measures are Precision, Recall, Accuracy and F-Measure. |
Precision
|
| • P is called the proportion of the predicted positive cases .The fraction of a cluster that consists of objects of a specified class. Precision of cluster i with respect to class j is, where mij is the number of points which belong to cluster i and class j both, and mi is the total number of points in cluster i that were correct, are calculated using the equation (7). |
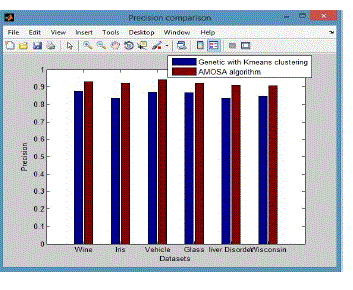
| From these shows the performance of the precision for genetic with k-means and AMOSA is shown in figure1and results are calculated and compared both the algorithm in table1 by which it shows the AMOSA is best. |
 |
Recall
|
| It is also called as sensitivity.The extent of which a cluster contains all objects of a specified class. The recall of cluster i with respect to class j is where mj is the number of objects in class j equation (8), |
 |
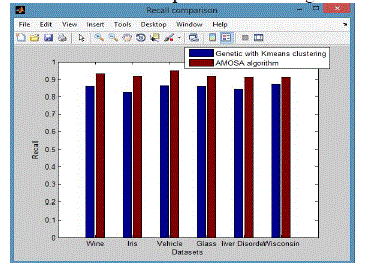
| From these shows the performance of the Recall for genetic with k-means and AMOSA is shown in figure 2 and results are calculated and compared both the algorithm in table 2 by which it shows the AMOSA is best. |
F-Measure
|
| The F-Measure computes some average of the information retrieval precision and recall metrics it can calculate the recall and precision of that cluster for each given class. A combination of both precision and recall that measures the extent to which a cluster contains only objects of a particular class and all objects of that class. The F-measure of cluster i with respect to class j is equation (9) |
 |
| F-measure (FM) is a measure of the quality of a solution given the true clustering. For F-measure, the optimum score i 1, with higher scores being “better”. |
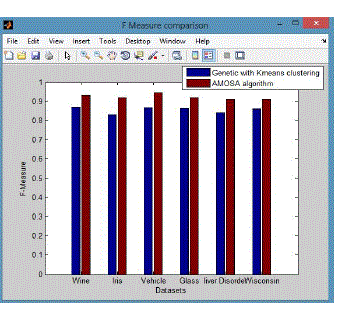
| From these shows the performance of the F-Measure for genetic with k-means and AMOSA is shown in figure 3 and results are calculated and compared both the algorithm in table 3 by which it shows the AMOSA is best. |
Accuracy
|
| It is the degree of closeness of measurements of a quantity to that quality actual (true) value.it is porporation of true results both true positives and true negative) in the population parameter test in equation (10). |
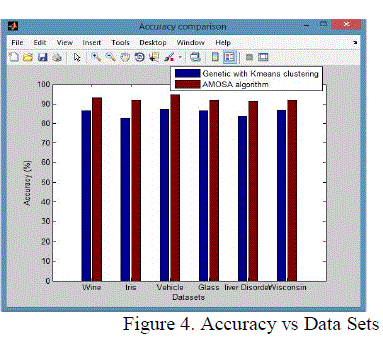
| From these shows the performance of the Accuracy for genetic with k-means and AMOSA is shown in figure 4 and results are calculated and compared both the algorithm in table 4 by which it shows the AMOSA is best. |
 |
CONCLUSION
|
| Thus using muti objective function it satified the automatic generation of number of clusters k-value .It compare with the two modules shows genetic with k-means is used as the global search and AMOSA used as the local search, when these are combined these improve the performance of the algorithm. It has generates the best solution based on Pareto optimal solution.Then it generates the automatic number of clusters k-value using k-means. By these it overcomes the drawback of k-means algorithm and usage of single objective function because it uses the multiobjective optimization which uses Pareto optimal front as the best solution. Hence it satisfied by generation of new algorithm for automatic clustering in unlabeled data sets. |
| But in genetic algorithm there is some drawback due to population diversity and convergence for improving these techniques can able to use other popular optimization techniques. |
ACKNOWLEDGMENT
|
| I wish to express my heartfelt regards and sincere thanks to my Project Guide Mr. G Komarasamy, Assistant Professor (Sr. Grade), Dept of CSE who had galvanized throughout the execution of my project. I thankful to my family members and friends for their encouragement and the best support to me in all needs of my project completion. |
Tables at a glance
|
 |
 |
 |
 |
| Table 1 |
Table 2 |
Table 3 |
Table 4 |
|
Figures at a glance
|
 |
 |
 |
 |
| Figure 1 |
Figure 2 |
Figure 3 |
Figure 4 |
|
References
|
- S .Bandyopadhyay& U .Maulik, “Nonparametric genetic clustering: comparison of validity indices”, IEEE Transactions on Systems, Man andcybernetics, Part C 31 (1), vol. 31, no. 1, pp. 120–125, 2001.
- S .Bandyopadhyay, S. Saha , U .Maulik& K. Deb, “A simulated annealing based multi-objective optimization algorithm (AMOSA)”, IEEETransactions on Evolutionary Computation 12, pp. 269–283, 2008.
- Chun Sheng Li, “Cluster Center Initialization Method for K-means Algorithm Over Data Sets with Two Clusters” , proceedings of InternationalConference on Advances in Engineering Procedia Engineering 24 ,pp. 324 – 328, 2011.
- D.N.A., Asuncion, UCI Machine Learning Repository, http://www.ics.uci.edu/ mlearn/MLRepository.html, 2007.
- J.Handl&J.Knowles, “An evolutionary approach to multi objective clustering”, IEEE Transactions on Evolutionary Computation ,vol.11,no.1,pp.5676,2007.
- U.Maulik&S.Bandyopadhyay, “Genetic algorithm-based clustering technique”, Pattern Recognition 2, pp.1455–1465, 1999.
- S. Saha& S. Bandyopadhyay, “Application of a new symmetry based cluster validity index for satellite image segmentation”, IEEE Geosciencesand Remote Sensing Letters 5, pp.166–170, 2008.
- S. Saha&S.Bandyopadhyay, “A generalized automatic clustering algorithm in a multi objective framework”, Applied soft computing 13, pp.89-108, 2013.
- Jiawei Han &MichelineKamber,“Data Mining: Concepts and Techniques” Second Edition by Elsevier Inc 2006.
- R.H. Eduardo, F.F.E. Nelson, “A genetic algorithm for cluster analysis, Intelligent Data Analysis”, 15–25, 2003.
- H.C. Chou, M.C. Su, E. Lai, “A new cluster validity measure and its application to image compression”, Pattern Analysis and Applications 7,205–220, July 2004.
- H. C Martin Law, P. Alexander Topchy& K .Anil. Jain,” Multiobjective Data Clustering”, IEEE Computer Society Conference on ComputerVision and Pattern Recognition, pp.1-7, 2004.
- UjjwalMaulik&, SanghamitraBandyopadhyay, “Genetic algorithm-based clustering technique”, Pattern Recognition 33 pp.1455-1465, 2000.
- A.M Fahim, A.M Salem , F.A Torkey& M.A Ramadan, “An efficient enhanced k-means clustering algorithm”, Science A 7(10),pp.1626-1633,2006.
- JoydeepGhosh& Alexander Liu,“The k-means Algorithm”, Bell Labs technical report, 1982.
- Paul S. Bradley, Usama M. Fayyad, “Refining Initial Points for K-Means Clustering”, 15th International Conference on Machine Learning(ICML98).
- KhaledAlsabti, Sanjay Ranka and Vineet Singh “An Efficient K-Means Clustering Algorithm”.ITL Hitachi America, Ltd.
- M.J.A Berry, G. Linoff, “Data Mining Techniques: For Marketing, Sales, and Customer Support.”, John Wiley & Sons, Berlin, 1997.
- U .Maulik, S. Bandyopadhyay, “Performance evaluation of some clustering algorithms and validity indices.” IEEE Trans. Pattern Anal. Mach.Intel. (PAMI) 24 (12), pp.1650–1654, 2002.
- H Margaret. Dunham, Data Mining- Introductory and Advanced Concepts, Pearson Education, 2006.
|