Keywords
|
| Complex combinatorial, Distributed generation, Harmony Search, Meta heuristic, Network reconfiguration. |
INTRODUCTION
|
| Distribution systems are normally configured radially for effective coordination of their protective devices. Due to the uncertainty of system loads and increased power demand, the operation of distribution system becomes complicated. Studies indicated that about 70% of total losses occur in distribution system only[1]. In order to reduce the required load demand and to reduce the power loss, the system must be expanded by increasing the substation capacity and number of feeders. However, this may not be easily achieved due to various constraints. So, power loss minimization techniques are employed to provide more capacity margin for the substation to meet the load demand. |
| Power loss reduction is one of the main targets in a power company aimed for increasing the profit margin. Although many techniques are available for reducing losses at the distribution level, network reconfiguration and distributed generation installation are most effective. Power loss in a distributed network will not be minimum for a fixed network configuration. So, there is a need for reconfiguration from time to time. Network reconfiguration is the process of altering the topological structure of feeders by changing the open/close status of sectionalizing and tie switches. Since many network reconfiguration combinations are possible, choosing the best optimal structure, without violating the constraints is a difficult task. Also the selection of best locations and size of DG units is also difficult. The advantages obtained from feeder reconfiguration are, for example, real power loss reduction, balancing system load, bus voltage profile improvement, increasing system security and reliability, and power quality improvement. For heavy reactive power loads, network reconfiguration and for heavy active power loads, distributed generation placement cannot effectively reduce the real power losses[1]. If these two methods are compinedly optimized, better results will certainly be obtained than that of any one method. So far, both the network reconfiguration and DG placement are considered seperately. In the proposed method, they are dealt simultaneously. Since network reconfiguration and distribution generation placement are complex combinatorial, non differentiable constrained optimization problem, many algorithms are poposed in the past. |
| Merlin and Back first proposed the network reconfiguration problem using branch and bound technique. Civanlar et al. Suggested heuristic algorithm. Nara et al. Presented a solution using genetic algorithm. Zhu presented a refined genetic algorithm. In this paper, HSA has been proposed to solve the distribution system network reconfiguration problem in the presence of distributed generation. The algorithm is tested on 33 bus system and has been coded in MATLAB language. |
| This paper organized as follows. In Section II, the problem formulation is given; Section III outlines the Harmony Search Algorithm; Section IV provides the application of HSA; Section V develops the test results and Section VI gives conclusions. |
II. FORMULATION OF OPTIMIZATION PROBLEM
|
| A. Objective Function |
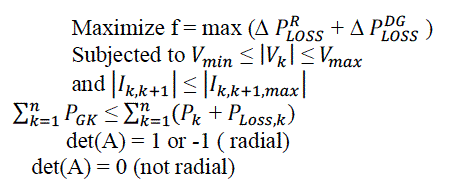
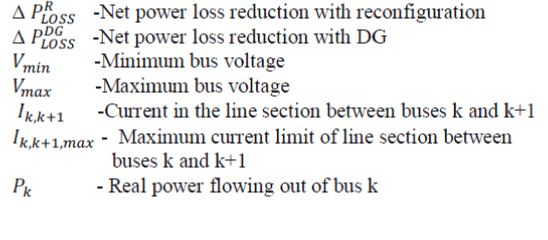
| The objective of the present optimization problem is to minimize the network power loss and maximize the voltage regulation. The imposed operating constraints are voltage profile of the system, current carrying capacity of the feeder and radial structure of distribution system. The objective function is given by, |
 |
| where |
 |
| B. Power Flow Equations |
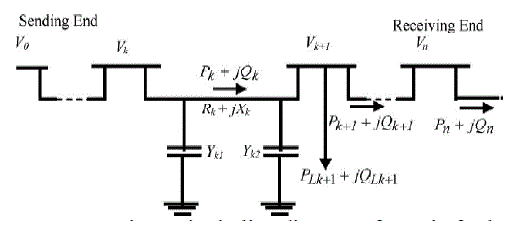
| By the following equations, the power flows are computed. |
 (2) (2) |
 (3) (3) |
 |
| The power loss in the line section with buses k and k+1 is computated as |
 (5) (5) |
| By summing up the losses of all line sections of the feeder, the total power loss is given by, |
 |
| C. Power Loss Using Network Reconfiguration |
| After reconfiguration , the power loss in the line section with buses k and k+1 is computated as |
 |
| By summing up the losses of all line sections of the feeder, the total power loss is given by, |
 (8) (8) |
| D. Power Loss Using Network Reconfiguration |
| Net power loss reduction in the system is the difference of the equations (7) and (8). i.e., |
 |
| E. Power Loss Reduction Using DG Installation |
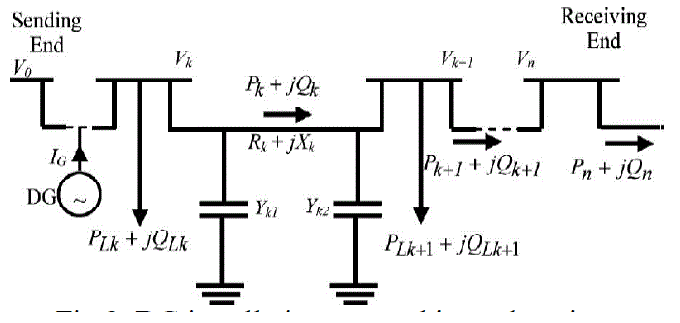
| When a DG is installed at an arbitrary location, the power loss is given by, |
 (10) (10) |
| Net power loss reduction is the difference of equations (10) and (12) is given by, |
 (11) (11) |
| The positive sign indicates that the system loss reduces with installation of DG. |
| F. Sensitivity Analysis For DG Installation |
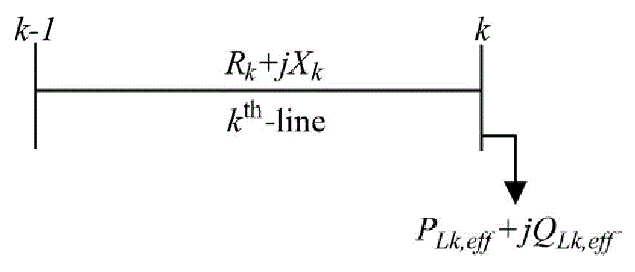
| To compute sensitivity factors of candidate bus locations to install DG units, sensitivity analysis is used. For the given line section as shown, |
| Active power loss in the k th-line between k-1and k buses is given by |
 (12) (12) |
| Now, the loss sensitivity factor (LSF) can be obtained with the equation |
 (13) (13) |
III. HARMONY SEARCH ALGORITHM
|
| The Harmony Search Algorithm (HSA) is a new meta heuristic population search algorithm proposed by Geem, Kim and Loganathan. HSA was derived from the natural phenomena of musicians behavior when they collectively play their musical instruments (population members) to come up with a pleasing harmony (global optimal solution). This state is determined by an aesthetic standard (fitness function). The HS algorithm, is simple in concept, few in parameters, and easy in implementation, has been successfully applied to various benchmarking, and real-world problems like travelling salesman problem . The main steps of HSA are as follows: |
| Step 1: Initialize the problem and algorithm parameters |
| Step 2: Initialize the harmony memory |
| Step 3: Improvise a new harmony |
| Step 4: Update the harmony memory |
| Step 5: Check the termination criterion |
| These steps are described in the next five subsections |
| A. Initialize the problem and algorithm parameters |
| The HS parameters are specified in this step. These are harmony memory size ( HMS), or number of solution vectors in the harmony memory; harmony memory considering rate(HMCR); pitch adjusting rate (PAR); and number of improvisations (NI) or stopping criterion. The harmony memory (HM) is a memory location where all solution vectors (sets of decision variables) are stored. The parameters HMCR and PAR are used to improve the solution vector and these are defined in step 3. |
| B. Initialize the harmony memory |
| In this step, the HM matrix is filled with as many randomly generated solution vectors as the HMS: |
 (14) (14) |
| C. Improvise a new harmony |
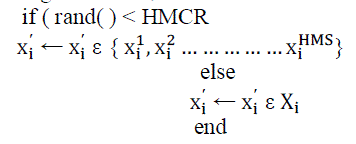
| A New Harmony vector x → ′ = ( x1; ′ , x2 ′ …………. . xn ′ ) is generated based on three criteria: 1) memory consideration, 2) pitch adjustment, and 3) random selection. Generating a new harmony is called improvisation. HMCR, which varies between 0 and 1, is the rate of choosing one value from the historical values stored in the HM, while (1-HMCR) is the rate of randomly selecting one value from the possible range of values, as shown below. |
 (15) (15) |
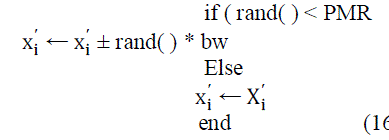
| where rand( ) is a uniformly distributed random number between 0 and 1 and X is the set of the possible range of values for each decision variable, i.e.. For example, an HMCR of 0.85 indicates that HSA will choose decision variable value from historically stored values in HM with 85% probability or from the entire possible range with 15% probability. Every component obtained with memory consideration is examined to determine if pitch is to be adjusted. This operation uses the rate of pitch adjustment as a parameter as follows: |
 (16) (16) |
| where bw is an arbitrary distance bandwidth for the continuous design variable and rand( ) is uniform distribution between 0 and 1. Since the problem is discrete in nature, bw is taken as 1. |
| D. Update harmony memory |
| If the new harmony vector has better fitness function than the worst harmony in the HM, the new harmony is included in the HM and the existing worst harmony is excluded from the HM. |
| E. Check stopping criterion |
| The HSA is terminated when the stopping criterion (e.g. maximum number of improvisations) has been met. Otherwise, steps 3 and 4 are repeated. |
IV. SOLUTION METHODOLOGY
|
| Getting the optimal solution for combined network reconfiguration and DG allocation using conventional methods is difficult because they are complex combinatorial optimization problems. So, a nature inspired evolutionary algorithm, HSA, that is based on the improvisation process of music players is applied. |
| The main idea is to get best combinations of open/closed switches and place an optimal size of capacitors at sensitive buses so that the combined network must give minimum real power loss and improve the voltage profile in the system. |
| In general, the structure of solution vector for reconfiguration of a radial distribution system is expressed by Arc No.(i) and SW. No.(i) for each switch i. Arc No.(i) identifies the arc (branch) number that contains the ith open switch, and SW. No.(i) identifies the switch that is normally open on Arc No.(i). For large distribution networks, it is not efficient to represent every arc in the string, since its length will be very long. To memorize the radial configuration, it is enough to number only the open switch positions. The solution vector must contain the open switch numbers and DG values. Hence the first part of variables in the solution vector is open switch numbers and second part of variables is sizes of the DG settings. The second part of the solution vector is DG values required to be placed at different nodes in the system. If a network has n buses and s is number of available DG sizes, then there are (s+ 1)n possible combinations of solution are possible. This requires a lot of computational burden. In order to reduce the computational efficiency and dimension of the solution vector, voltage stability indices are used to select most sensitive nodes which require reactive power compensation. The format of the solution vector in Harmonic Memory (HM) matrix is |
 |
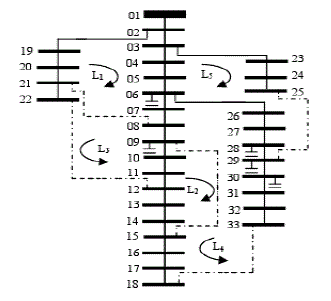
| In order to explain the proposed method, a standard IEEE 33-bus distribution system is considered. It consists of 32 normally closed switches and 5 normally opened switches as shown in Fig. 4. This network contains one tie switch in each loop and these are designated as 33, 34, 35, 36, and 37. In the solution process only tie switches are used to form solution vectors of the HMS. |
| The computation of voltage stability indices help to select optimal locations (most sensitive nodes) for DG placement in the system. For this network optimal locations are computed as 6, 28, 29, 30 and 9 which require reactive power compensation to minimize power loss and improve voltage profile. Thus the second part contains three variables and these are DG sizes. Throughout the optimization process the dimension of second part of the solution vector is constant and only optimal size of the capacitor at a node will vary. The solution vector (HMS) for this configuration is represented as: |
 |
| Reconfiguration DG Sizes |
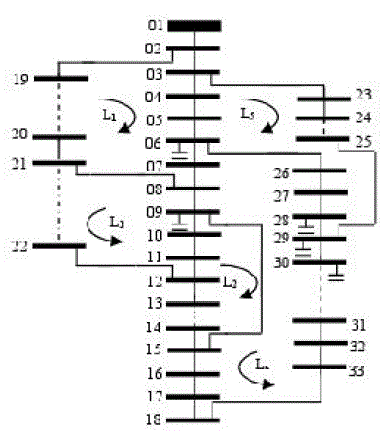
| The DG sizes are chosen randomly from 0 to maximum size of the capacitors available. For other solution vector (HMS), a radial network, shown in Fig. 5, is randomly generated with open tie switches 19, 13, 21, 30, and 24 without violating the radiality constraint. |
| For the above configuration the solution vector is represented as: |
 |
| In the fashion, all the other possible solution vectors randomly are generated without violating the radial structure or islanding any load in the network. For this network, total number of solution vectors generated are less than or equal to highest numbers of switches in any individual loop. The total Harmony Matrix ( HM) generated randomly with objective function values is shown below. |
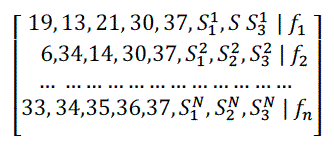 |
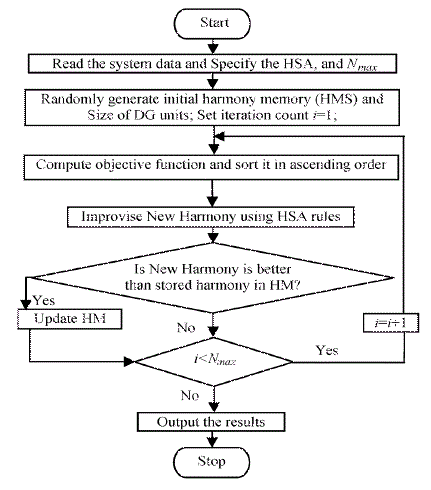
| The objective function values shown in the last column of the HM matrix are sorted in ascending order to eliminate the worst solution vectors in the next iteration. The new solution vectors are updated. Using the new solution vectors, the worst vectors of previous iteration will be eliminated with a new random vectors selected from the population that has less objective function value. This procedure is repeated until termination criteria is satisfied. The flow chart of the proposed algorithm is shown in Fig. 6. |
V SIMULATION RESULTS
|
| To demonstrate the application of the proposed method, test system comprising of 33 buses are considered. The substation voltage is considered as 1 p.u. The algorithm was developed in MATLAB and simulations are carried out. |
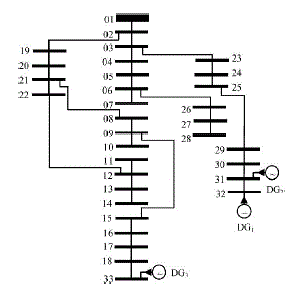
| The test system is a 33 bus, 12.66 kV, radial distribution system[9]. It consists of five tie lines and 32 sectionalize switches. The normally open switches are 33 to 37 and the normally closed switches are 1 to 32. The line and load data of the network is obtained and the total real and reactive power loads on the system are 3715 kW and 2300 kVAr. The parameters of HSA algorithm used in the simulation of network are HMS=6, HMCR=0.9, PARmin=0.4, PARmax=0.9, maximum iterations = 5000.Using sensitivity analysis sensitivity factors are computed to install the DG units at candidate bus locations for scenarios III, IV, and V. After computing sensitivity factors at all buses, they are sorted and ranked. Only top three locations are selected to install DG units in the system. The limits of DG unit sizes chosen for installation at candidate bus locations are 0 to 2 MW. The optimal structure of network after simultaneous reconfiguration and DG installation for scenario V is shown in Figure 7. |
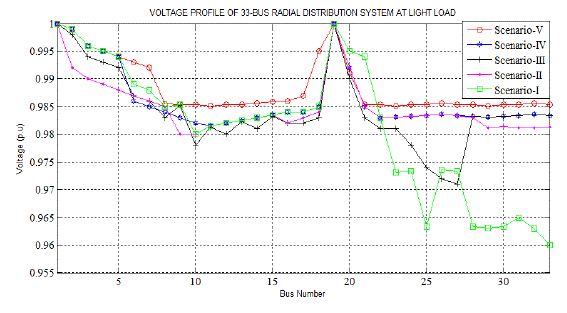
| The voltage profile curve of all scenarios at light load conditions is shown in Figure 8. The graph shows how the voltage varies with bus number. The bus number is taken along the x-axis since it is an independent quantity and the voltage is taken along y-axis because it is a dependent quantity. The bus number is from 1 to 33 and the voltage in per unit is taken from 0.955 to 1. It is seen that the voltage reaches 1 p.u at bus number near 1 and 19. |
| In the simulation of network, five scenarios are considered to analyze the superiority of the proposed method. |
| Scenario I: The system is without reconfiguration and distributed generators (Base case); |
| Scenario II: same as Scenario I except that system is reconfigured by the available sectionalizing and tie switches; |
| Scenario III: same as Scenario I except that DG units are installed at candidate buses in the system; |
| Scenario IV: DG units are installed after reconfiguration of network; |
| Scenario V: System with simultaneous feeder reconfiguration and DG allocation. |
| From the below figure it is clear that for scenario V i.e., system with simultaneous feeder reconfiguration and DG installation, the voltage profile is highest than other scenarios. |
VI. CONCLUSION
|
| A new algorithm has been presented to solve the network reconfiguration problem in the presence of distributed generation (DG) for minimizing the real power losses. An efficient meta heuristic HSA is used in the optimization process of the network reconfiguration and DG installation. The proposed method is tested on a IEEE 33 bus system at light load level. The results show that simultaneous network reconfiguration and DG installation method is more effective in reducing power loss and improving the voltage profile compared to other methods. The ratio of percentage loss reduction to DG size is highest when number of DG installation locations is three. In earlier approaches, network reconfiguration and DG placement in distribution networks are considered independently. However, in the proposed method network reconfiguration and DG installation are dealt simultaneously for improved loss minimization and voltage profile. |
Figures at a glance
|
 |
 |
 |
 |
| Figure 1 |
Figure 2 |
Figure 3 |
Figure 4 |
 |
 |
 |
 |
| Figure 5 |
Figure 6 |
Figure 7 |
Figure 8 |
|
| |
References
|
- R.Srinivasa Rao, “ An Hybrid Approach for Loss Reduction in Distribution Systems using Harmony Search Algorithm”, World Academy of Science, Engineering and Technology, 2010, pp. 745-751.
- R. Srinivasa Rao, S. V. L. Narasimham, M. R. Raju, and A. Srinivasa Rao, “Optimal network reconfiguration of large-scale distribution system using harmony search algorithm,” IEEE Trans. Power Syst.,vol. 26, no. 3, pp. 1080–1088, Aug. 2011.
- W. Rosehart and E. Nowicki, “Optimal placement of distributed generation,” in Proc. 14th Power Systems Computation Conf., Sevillla, 2002, pp. 1–5, Section 11, paper 2.
- C. Wang and M. H. Nehrir, “Analytical approaches for optimal placement of distributed generation sources in power systems,” IEEE Trans.Power Syst., vol. 19, no. 4, pp. 2068–2076, Nov. 2004.
- Z. W. Geem, “Novel derivative of harmony search algorithm for discrete design variables,” Appl. Math. Computat., vol. 199, no. 1, pp.223–230, 2008.
- S. Ghosh and K. S. Sherpa, “An efficient method for load-flow solution of radial distribution networks,” Int. J. Elect. Power Energy Syst. Eng.,vol. 1, no. 2, pp. 108–115, 2008.
- S. Das, A. Mukhopadhyay, A. Roy, A. Abraham, and B. K. Panigrahi, “Exploratory power of the harmony search algorithm: Analysis and improvements for global numerical optimization,” IEEE Trans. Syst.,Man, Cybern. B, Cybern., vol. 41, no. 1, pp. 89–106, 2011.
- Z. W. Geem, C. Tseng, and Y. Park, “Harmony search for generalized orienteering problem: Best touring in China,” in Proc. ICNC, 2005, vol. 3612, pp. 741–750, Springer Heidelberg.
- M. E. Baran and F. Wu, “Network reconfiguration in distribution system for loss reduction and load balancing,” IEEE Trans.Power Del., vol. 4,no. 2, pp. 1401–1407, Apr. 1989.
- J. S. Savier and D. Das, “Impact of network reconfiguration on loss allocation of radial distribution systems,” IEEE Trans. Power Del., vol.2, no. 4, pp. 2473–2480, Oct. 2007.
- E.Afzalan, M.A Taghikhani and M.Sedighizadeh, “Optimal Placement and Sizing of DG in Radial Distribution Networks Using SFLA”, International Journal of Energy Engineering, vol. 2(3): pp.73-77.
- Subin Sunny and P.Balaji, “The Better Optimization Technique for the Placement of DG In Order To Reduce Overall Cost of Power System”, International Journal of Engineering and Advanced Technology (IJEAT) ISSN: 2249 – 8958, Volume-2, Issue-5. pp.159-162, 2013.
- Zong Woo Geem, “State-of-the-Art in the Structure of Harmony Search Algorithm”.
|