ISSN ONLINE(2320-9801) PRINT (2320-9798)
ISSN ONLINE(2320-9801) PRINT (2320-9798)
Mr.Arun .M1, Mrs.Prathipa.R2,Mr.Krishna.P.S.G3
|
| Related article at Pubmed, Scholar Google |
Visit for more related articles at International Journal of Innovative Research in Computer and Communication Engineering
This paper presents an automatic defect identification system for detecting defects of steel products from captured digital radiographic images based on defect classification and segmentation. Image classification will be used for automated visual inspection to classify defect protects from quality one. It will be performed through textures analysis and probabilistic neural network. The textures are extracted using wavelet filters with co-occurrence features. The defect detection process involves the pre-processing, segmentation and morphological filtering to make processing system more flexible with accuracy. Manual inspection used to define the existence of defect becomes an urgent and important task in order to make sure the evaluation is accurate for radiographer to make decision. But, the manual inspection might give in consistent results especially when there are plentiful defects needs to be evaluated due to human factor. Automated defect inspection and evaluation system could assist radiographer to assess the properties of defect accurately. The pre-processing stage is used to improve the image quality by removing the noise if it contaminated in an image or smoothening an image to make better segmentation defect region using Gaussian filtering or top hat transformation. Here the segmentation process will be done based on clustering model and in that fuzzy c means clustering will be approached for effective partitioning a defect region from other parts. After this process, Morphological filtering will be used to smooth the segment the region by removing the back ground noise and false defects. Finally, the defects are extracted with better accuracy. The simulated results will be shown that the used algorithms for this process generate accurate detection of defects rather than previous methods and other clustering models.
INTRODUCTION |
| Many automated manpower saving systems have been developed (and employed) to reduce the production cost and improve the quality of steel products. However, in the finishing product, quality assurance with respect to surface defects is partly automated and mostly performed by manual inspection. The global economic development has gradually led steel production industries to increase its production rate ensuring simultaneously stringent limit on the quality of product. In order to meet the growing demand for high-quality product in short duration, the use of intelligent visual inspection systems is increasingly essential in production lines. The use of automated inspection technique is necessary at each level of production to improve the quality of product as well as to eliminate the need of a human intervention in a hazardous environment. This will facilitate to make the surface information available immediately after the rolling process. This has an obvious benefit in terms of quality assurance. The surface defects often arise as a result of systematic process problems, such as (partially) damaged machinery or metallurgical drift. Thus, the early detection of defects can also have a direct cost benefit in terms of saving of time as well as to prevent rejection from being generated in large quantities, in downstream. In the literature, there are methods of defect detection inside steel casting [1], on fabric surface [2]–[4], glass plates [5],liquid crystal display images [6], etc. The defect detection in steel casting typically relies on X-ray image processing to localize any internal flaw. However, surface defect detection can be performed by processing the surface images [7]. |
1.1 Defect types of steel products |
| There are certain major difficulties in defect detection of hotrolled steel surface. These are as follows. The classification of local area of surface defects on hot-rolled steel surface is a challenging task due to the variability in manifestations of the defects grouped under the same defect label. Surface defects of steel plates can be broadly categorized into two main groups: a) textural defects and b) geometric defects. Textural defects, such as heavy scale, rolled in scale, salt and pepper, slab edge, and so on, can be detected by the methods based on textural analysis. Geometric defects, such as cracks, scratches, etc., can be detected by algorithms based on morphological filtering. In addition, these defects on steel surface can be effectively identified from the uniform images with the small-sample statistics like the mean and variance of gray levels. They can also be detected using simple thresholding or edgedetection techniques. However, the large variety of defects requires different threshold values for different types of defects. However, a good defect detection system should detect all types of defects equally by the same algorithm. There is a great deal of scales with different colors and appearances on the surface of steel plates, which makes the background detection task difficult. In spite of careful arrangement of uniform illumination over the steel surface, the problem of vibration-induced uneven illumination is difficult to overcome. Therefore, a suitable defect detection algorithm of hot-rolled steel surfaces needs to be insensitive to scales and uneven illumination to the maximum possible extent. |
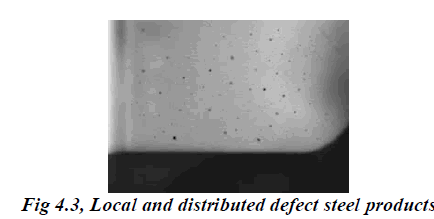
| Two principal types of defects are encountered with respect to the space localization:1) local defect and 2) distributed defect. Local defects are limited in space but may appear in a discontinuous fashion on different places of the surface. For example, scratches, crack, rupture, blister, bruise, head mark, etc., belong to this category. On the other hand, distributed defects are spread (continuously) over the large area of the surface. For example, rolled in scale, salt and pepper, scale grain, and slab edge are categorized in this group. Local defect, being constrained in space, is principally the outcome of imperfect rolling. On the other hand, the distributed defect is mainly attributed to short comings in metallurgical mixing in upstream. Alternatively, the defects may be classified into two types based on appearance:1) geometric defects such as scratches, cracks, head mark, rupture, spall, waviness, whip, etc., and 2) textural defects such as rolled in scale, salt and pepper, scales in grain, slab edge, etc. Defect classification is as important as defect detection for gradation of the steel sheets because the usability and associated penalty posed by various utilities depend on both the amount of the defect and the type of defects. Moreover, due to disturbance created in the intensity profile, some of the water droplets and dirt are detected as defects or disturbances initially. These false alarms are reduced to a large extent in the defect classification stage. Instead of categorizing the defective samples in different classes, we, in this research, discriminate the defect-free samples from the defective ones. |
II SYSTEM ANALYSIS |
2.1 Existing Approaches |
| • PCA and KNN classifier |
| • Edge detection and Histogram thresholding method |
| • Global threshold method |
2.2 Principal Component analysis |
| PCA is a mathematical procedure that uses an orthogonal transformation to convert a set of observations of possibly correlated variables into a set of values of linearly uncorrelated variables called principal components. The number of principal components is less than or equal to the number of original variables. This transformation is defined in such a way that the first principal component has the largest possible variance (that is, accounts for as much of the variability in the data as possible), and each succeeding component in turn has the highest variance possible under the constraint that it be orthogonal to (i.e., uncorrelated with) the preceding components. Principal components are guaranteed to be independent only if the data set is jointly normally distributed. PCA is sensitive to the relative scaling of the original variables. Depending on the field of application, it is also named the discrete Karhunen–Loève transform (KLT), the Hotelling transform or proper orthogonal decomposition (POD). |
2.3 Drawbacks |
| • Poor discriminatory power |
| • High computational load |
2.4 Discrete Wavelet Transform: |
| In mathematics, a wavelet series is a representation of a square-integrable (real or complex ) function by a certain orthonormal series generated by a wavelet. This article provides a formal, mathematical definition of an orthonormal wavelet and of the integral wavelet transform. |
2.5 Definition |
| A function ψεL2(R) is called an orthonormal wavelet if it can be used to define a Hilbert basis, that is a complete system, for the Hilbert L2(R) of square integrable functions. The Hilbert basis is constructed as the family of functions |
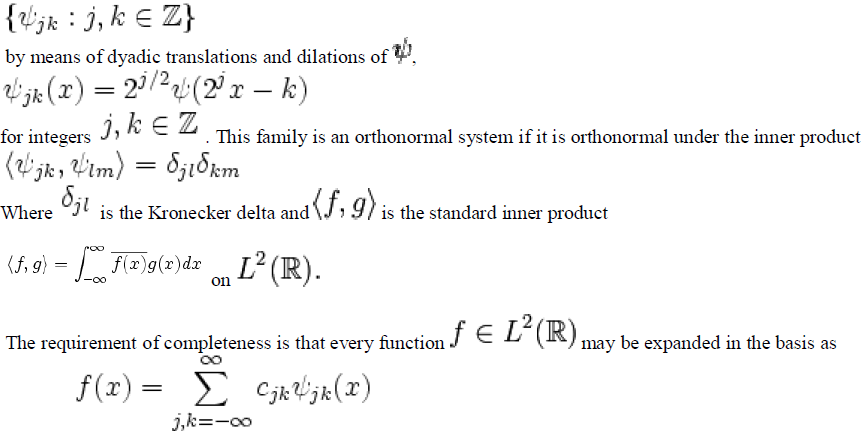 |
| With convergence of the series understood to be convergence in norm. Such a representation of a function f is known as a wavelet series. This implies that an orthonormal wavelet is self-dual. |
2.6 Drawbacks |
| • Loss of edge details due to shift variant property. |
2.7 KNN Classifier |
| In pattern recognition, the k-nearest neighbor algorithm (k-NN) is a method for classifying objects based on closest training examples in the feature space. k-NN is a type of instance-based learning, or lazy learning where the function is only approximated locally and all computation is deferred until classification. The k-nearest neighbor algorithm is amongst the simplest of all machine learning algorithms: an object is classified by a majority vote of its neighbors, with the object being assigned to the class most common amongst its k nearest neighbors (k is a positive integer, typically small). If k = 1, then the object is simply assigned to the class of its nearest neighbor. |
| The same method can be used for regression, by simply assigning the property value for the object to be the average of the values of its k nearest neighbors. It can be useful to weight the contributions of the neighbors, so that the nearer neighbors contribute more to the average than the more distant ones. (A common weighting scheme is to give each neighbor a weight of 1/d, where d is the distance to the neighbor. This scheme is a generalization of linear interpolation.) |
III SYSTEM DESIGN AND IMPLEMENTATION |
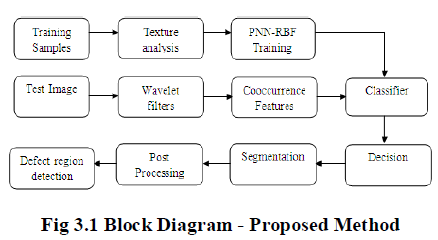 |
3.1 Steps Involved |
| Step 1. Load Training Samples. |
| Step 2. Texture Analysis is applied to Training samples. |
| Step 3. Train it with PNN - RBF. |
| Step 4. Now apply the Test image and pass it to the Wavelet filter. |
| Step 5. Find the co occurrence features. |
| Step 6. Use Classifier to classify Test Image with the Trained Samples . |
| Step 7. Decision is taken and passed on to segmentation. |
| Step 8. Post processing is done. |
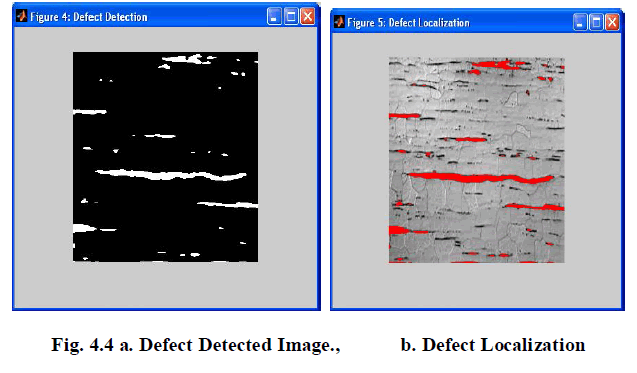
| Step 9. Defect region is detected. |
IV SIMULATED RESULTS |
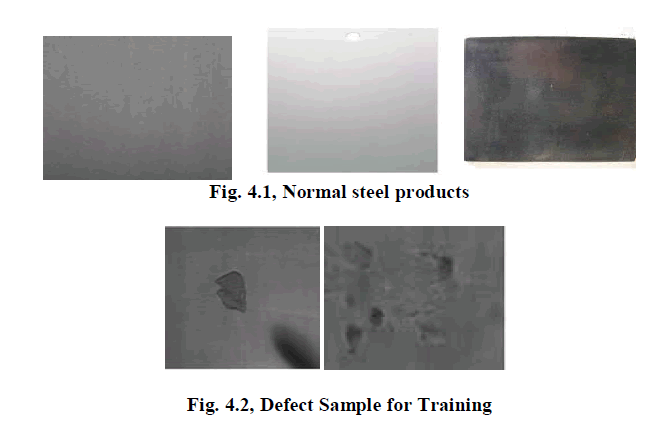
4.1 Some of Normal and Defect Samples for training: |
 |
 |
4.2 Performance Analysis: |
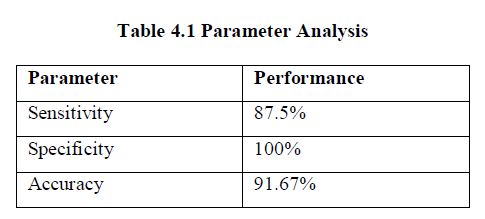
| The performance of classifier can be evaluated through following parameters, |
| Sensitivity: It measures the proportion of actual positives which are correctly identified |
| Sensitivity = Tp. / (Tp + Fn) |
| Specificity: It measures the proportion of negatives which are correctly identified. |
| Specificity = Tn./(Fp + Tn) |
| Total accuracy: (Tp+Tn)./(Tp+Tn+Fp+Fn) |
| Where, |
| Tp = True Positive: Defective correctly classified as defective metal,Fn = False negative: Defective incorrectly |
| Tn = True negative: Normal correctly classified as normal |
| Tn = True negative: Normal correctly classified as normal |
 |
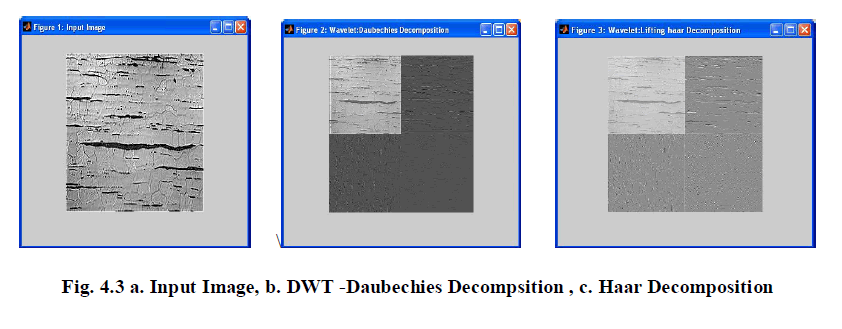
4.3 Snapshot for wavelet filters based texture representation |
 |
 |
V CONCLUSION |
| Paper presented that automatic defect detection from defect free environment with supervised classifier and unsupervised segmentation approach. Here, wavelet type and lifting scheme with co-occurrence features were used for characterize the textures regions to discriminate the normal surface and defective surface. It was well suited for this automatic process using learning machine with radial basis kernel function. For training and classification, probabilistic type network has involved with RBF kernel. Here. Spatial fuzzy clustering algorithm was utilized effectively for accurate defect detection to locate it in the input original sample. The performance of this classification was evaluated with metrics of sensitivity and accuracy. Finally it shown that used classifier with texture descriptors provided better classification accuracy and compatibility. |