In this paper, we study the performance of various classifier models for predicting disease classes using genetic microarray data. We analyze the best from among the four classifier methods namely Naïve Bayes, J48, IB1 and IBk. Classification is a technique to predict the best classifier. Classification is used to classify the item according to the features of the item with respect to the predefined set of classes. Naive Bayes algorithm is based on probability and j48 algorithm is based on decision tree. In this paper, we classify the dataset using classes and we found the J48 classifier performs better in accurately predicting the disease classes.
Keywords |
| Prediction, Naive Bayes, J48, IB1, IBk. |
INTRODUCTION |
| Data mining is growing in various applications widely like analysis of organic compounds, medicals diagnosis, product
design, targeted marketing, financial forecasting, automatic abstraction, predicting shares of television audiences etc.
Data mining refers to the analysis of the large quantities of data that are stored in computers. Data mining is not
specific to one type of media or data [1]. Data mining should be applicable to any kind of information repository. Data
mining is being put into use and studied for databases, including relational databases, object-relational databases and
object oriented databases, data warehouses, transactional databases, unstructured and semi-structured repositories such
as the World Wide Web, advanced databases such as spatial databases, multimedia databases, time-series databases and
textual databases, and even flat files[2]. |
| Classification analysis is the organization of data in given classes. Also known as supervised classification, the
classification uses given class labels to order the objects in the data collection.Classification approaches normally use a
training set where all objects are already associated with known class labels [3]. The classification algorithm learns
from the training set and builds a model. The model is used to classify new objects. Classification is a statistical
operation in which certain objects are put into groups or classes according to their characteristics, sometimes called
attributes, found on a training set. There are many approaches to classification in literature, like Decision trees, neural
networks, Support vector machines and Bayesian networks, among others.From the aforementioned classifying
methods, the Bayesian approach is the most commonly used to deal with uncertainty, because it is based on the
probability theory. |
RELATED WORK |
Naive Bayes classifier |
| A well-known classifier is the Naive Bayes classifier, a simple type of Bayesian network that explodes the
conditional independence assumption among attributes given the class. In real life, this assumption does not hold most
of the time. However, Naive Bayes classifiers have proven to be successful.Generally, in a Naive Bayes classifier the attributes are discrete, but in most real-life situations, attributes are continuous [4].The naive Bayes classifier greatly
simplifies learning by assuming that features are independent given class. Although independence is generally a poor
assumption, in practice naive Bayes often competes well with more sophisticated classifiers. Our broad goal is to
understand the data characteristics which affect the performance of naive Bayes. |
Decision tree algorithm J48: |
| J48 classifier is a simple C4.5 decision tree for classification. It creates a binary tree. The decision tree approach is
most useful in classification problem. With this technique, a tree is constructed to model the classification process.
Once the tree is built, it is applied to each tuple in the database and results in classification for that tuple. |
Algorithm J48: |
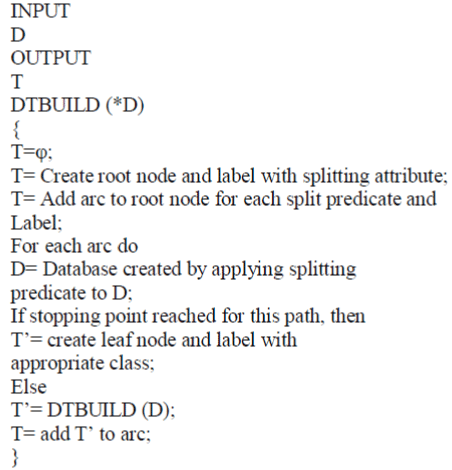 |
| While building a tree, J48 ignores the missing values i.e. the value for that item can be predicted based on what is
known about the attribute values for the other records. The basic idea is to divide the data into range based on the
attribute values for that item that are found in the training sample [5]. J48 allows classification via either decision trees
or rules generated from them. |
IB1 Classifier |
| IB1 classifier uses a simple distance measure to find the training instance closest to the given test instance, and predicts
the same class as this training instance. If multiple instances are the same (smallest) distance to the test instance,the
first one found is used. The IB1 algorithm, is the simplest instance-based learning classification method [13]. IBL
algorithms are derived from the nearest neighbour pattern classifier (Cover & Hart, 1967). They are highly similar to
edited nearest neighbour algorithms (Hart, 1968; Gates,1972; Dasarathy, 1980), which also save and use only selected
instances to generate classification predictions. While several researchers demonstrated that edited nearest neighbour
algorithms can reduce storage requirements with, at most, small losses in classification accuracy, they were unable to
predict the expected savings in storage requirements. IBL algorithms are instead incremental and their goals include
maximizing classification accuracy on subsequently presented instances [6]. The similarity and classification functions
determine how the set of saved instances in the concept description are used to predict values for the category attribute.
Therefore, IBL concept descriptions not only contain a set of instances, but also include these two functions. |
| In IB1 method, the similarity function used here is: |
 |
| Where the instances are described by n attributes. We define f(xi yi;) = (xi,- yi)2 for numeric-valued attributes and f(xi,
yi) = (xi ≠ yj) for Boolean and symbolic-valued attributes. Missing attribute values are assumed to be maximally
different from the value present. If they are both missing, then f(xi, yi) yields 1. IB1 is identical to the nearest
neighbour algorithm except that it normalizes its attributes' ranges, processes instances incrementally, and has a simple
policy for tolerating missing values. |
IBK (K - Nearest Neighbour) |
| IBK is a k-nearest-neighbour classifier that uses the same distance metric. The number of nearest neighbours can be
specified explicitly in the object editor or determined automatically using leave-one-out cross-validation focus to an
upper limit given by the specified value. IBK is a knearest- neighbour classifier. A kind of different search algorithms
can be used to speed up the task of finding the nearest neighbours. A linear search is the default but further options
include KD-trees, ball trees, and so-called “cover trees”. The distance function used is a parameter of the search
method. The remaining thing is the same as for IBL—that is, the Euclidean distance; other options include Chebyshev,
Manhattan, and Minkowski distances. Predictions from more than one neighbour can be weighted according to their
distance from the test instance and two different formulas are implemented for converting the distance into a weight. |
CRITERIA USED FOR COMPARISON EVALUATION |
Accuracy Classification |
| All classification result could have an error rate and it may fail to classify correctly. So accuracy can be calculated as
follows. |
| Accuracy = (Instances Correctly Classified / Total Number of Instances)*100 %(2) |
Mean Absolute Error |
| MAE is the average of difference between predicted and actual value in all test cases. The formula for calculating MAE
is given in equation shown below: |
 |
| Here ‘a’ is the actual output and ‘c’ is the expected output. |
Root Mean Squared Error |
| RMSE is used to measure differences between values predicted by a model and the values actually observed. It is
calculated by taking the square root of the mean square error as shown in equation given below: |
 |
| Here ‘a’ is the actual output and c is the expected output. The mean-squared error is the commonly used measure for
numeric prediction. |
Confusion Matrix |
| A confusion matrix contains information about actual and predicted classifications done by a classification system. The
classification accuracy, mean absolute error, root mean squared error and confusion matrices are calculated for each
machine learning algorithm using the machine learning tool. |
| The tables presented above, represent the various accuracy measures for various classifier models used to predict the
disease using the gene data. The best classifier model is found out using the various criteria used for evaluation. The
criteria used for evaluation include mean absolute error, root mean squared error, relative absolute error and root
relative square error. |
| The tables presented above, represent the various accuracy measures for various classifier models used to
predict the disease using the gene data. The best classifier model is found out using the various criteria used for
evaluation. The criteria used for evaluation include mean absolute error, root mean squared error, relative absolute error
and root relative square error. |
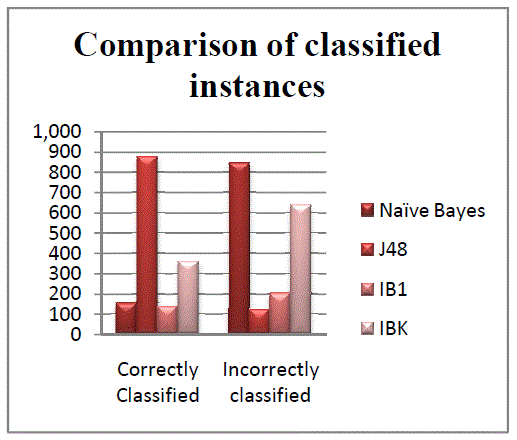
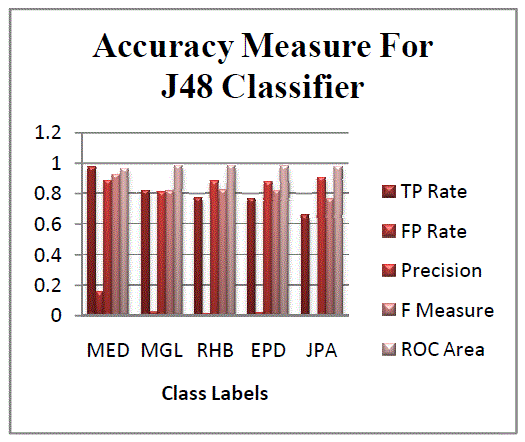
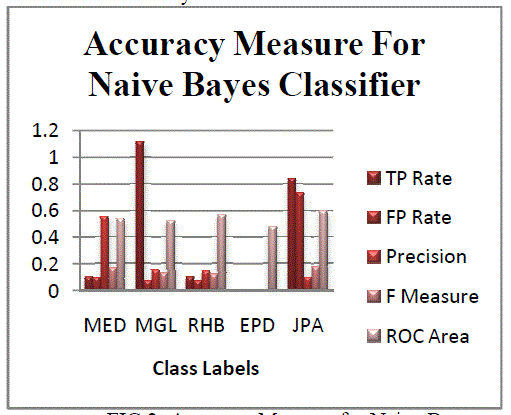
| The Figures 1 and 2 illustrate the various statistics of classifiers. Figure 1 represents the correctly and incorrectly
classified instances for all classifiers. Figure 2 illustrates the accuracy measures for all classes in Naïve Bayes
Classifier.Figure 2 and Figure 3 represents the accuracy measures of different classes. The gene data has been classified
with accordance to five classes. The five classes describe five types of heredity disorder. Thus using these predictions
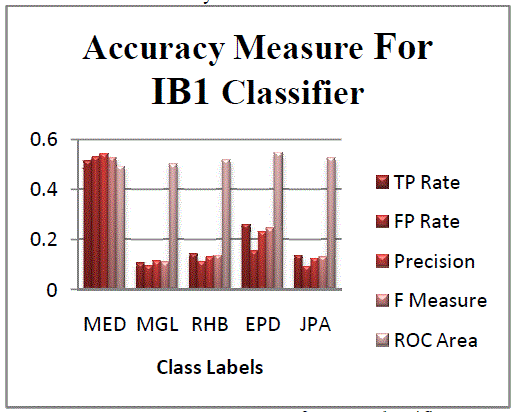
one can easily identify for one gene pattern, the occurrence of heredity disorder.The figure 4 represents the accuracy
measure of the data using IB1 classifier. From the graph the disorder class MED is found to be classified with more
errors. Comparatively the other classes have less error compared to MED class disorder. |
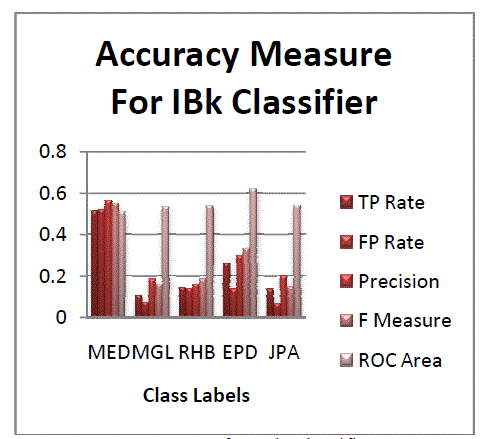
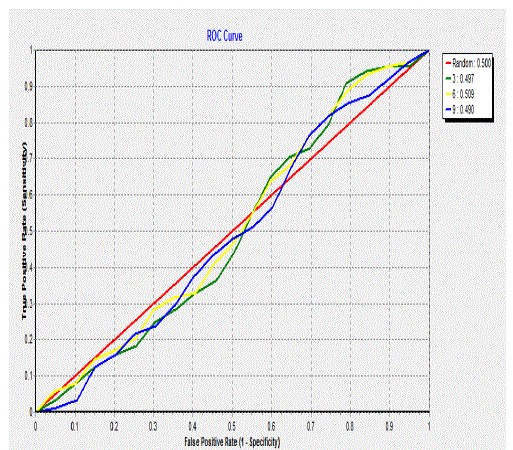
| Figure 5 and 6 represent the accuracy measure for IBk classifier and Roc curve for a class. From all the conclusions it
is clear that j48 classifier performs better than other classifiers. May be the experimental results could vary from dataset
to dataset depending upon the attributes and instances. |
CONCLUSION AND FUTURE WORK |
| Data mining can be defined as the extraction of usefulknowledge from large data repositories. In this paper,
theclassification algorithms namely Naïve Bayes, J48, IB1 and IBk classifiers are used for classifying gene data in
order to predict heredity disorders. Byanalysing the experimental results it is observed that the J48 classifier yields
better result than other classifier. As development of this paper, we would try obtain better results based upon iterating
the training set data. How far does the accuracy increases as the training data increases. |
Tables at a glance |
 |
 |
 |
 |
 |
| Table 1 |
Table 2 |
Table 3 |
Table 4 |
Table 5 |
|
Figures at a glance |
 |
 |
 |
| Figure 1 |
Figure 2 |
Figure 3 |
 |
 |
 |
| Figure 4 |
Figure 5 |
Figure 6 |
|
References |
- Almuallim, H. and Dietterich, T.G., Learning with many irrelevant features. In Proceedings AAAI-91, volume 2, pp. 547-552, 1991.
- Blum, A.L., and Langley, P, Selection of Relevant Features and Examples in Machine learning. Artificial Intelligence, 97, pp. 245-271, 1997.
- Boz, O. Feature Subset Selection by Feature Relevance. Submitted for the ICML 2002.
- Breiman, L., Friedman, J.H., Olshen, R.A., and Stone, P.J,Classification and Regreession Trees. Wadsworth International Group. Belmont, CA, 1984.
- Cardie, C. Using Decision Trees to Improve Case-based Learning. ICML , pp. 25-32, 1993.
- Caruana, R., and Freitag, D, Greedy Attribute Selection. In: Cohen, W.W., and Hirsh, H. (eds). Proceedings of the 11th International Conference on Machine Learning. San Mateo, CA: Morgan Kaufmann, pp.28-36, 1994.
- Domingos, P. and Pazzani, M. Beyond Independence: Conditions for the Optimality of the Simple Bayesian Classifier. In Proceedings of the ICML 1996, pp.105-112, 1997.
- Domingos, P. and Pazzani, M. On the Optimality of the Simplie Bayesian Classifier under Zero-One Loss. Machine Larning, 29(2/3): 103-130,November/December 1997.
- Duda, R.O. and Hart, P.E, Pattern Classification and Scene Analysis. New York, NY: Wiley and Sons, 1973.
- Yugalkumar and G. Sahoo, ?Analysis of Parametric & Non Parametric Classifiers for Classification Technique using WEKA,? Int.Jour.Information Technology and Computer Science, 7, pp. 43-49, 2012.
- C. Lakshmi Devasena, ?Effectiveness Prediction of Memory Based Classifiers for the Classification of Multivariate Data Set,? CS &IT-CSCP2012, Volume 2, pp. 413?424. DOI: 10.5121/csit.2012.
- C. Lakshmi Devasena, Sumathi.T, Gomathi.V.V and Hemalatha.M,?Effectiveness Evaluation of Rule Based Classifiers for the Classification of Iris Data Set,? Bonfring Int. J. Man MachineInterface, 1(1): 5 ? 9, 2011.
- C. Lakshmi Devasena, T. Sumathi, V.V. Gomathi, R. Malarkodi and M. Hemalatha,. ?Predicting Effectiveness of Rule based Classifiers for a Classification Problem,? Proc. of Int. Conf. on Networks,Intelligence and Computing Technologies, 1(2): 559 ? 563. (ISBN: 978-81-8424-742- 8), 2012.
- G. Nalinipriya, A. Kannan and P. Anandhakumar, ?Performance Analysis of Classifiers for Multivariate Coronary Artery Disease Dataset using Renowned Metrics,? European Journal of ScientificResearch, Vol. 86, No 4, pp.565 ? 572, September, 2012.
|