International Journal of Innovative Research in Computer and Communication Engineering
ISSN ONLINE(2320-9801) PRINT (2320-9798)
ISSN ONLINE(2320-9801) PRINT (2320-9798)
B.Chandirika1, S.Selvarani2
|
| Related article at Pubmed, Scholar Google |
Visit for more related articles at International Journal of Innovative Research in Computer and Communication Engineering
A landmark is a recognizable natural or man-made feature used for navigation, a feature that stands out from its near environment and is often visible from long distances. In modern use, the term can also be applied to smaller structures or features that have become local or national symbols. This article presents an approach for mining landmark images from heavily contaminated image collections gathered from the Internet that achieves greater accuracy in traditional problems like landmark recognition. People, particularly tourists, are interested in viewing photos of landmarks across world-wide locations. To automatically identify landmarks from existing photo collections, methods based on only metadata, only content or a fusion of both are used. Certain computer vision techniques are also used to select iconic images for selected locations. Social tags with associated spatio-temporal information can be readily plugged into general techniques for landmark recognition. In this paper image mining techniques were applied on the accompanying metadata to determine independent ranking of images. In the first stage of processing, images are clustered based on global appearance descriptors, and the clusters are refined using certain geometric constraints. Using structure from motion techniques, the system then registers the iconic images to efficiently produce the different aspects of the landmark. To improve coverage of the scene, these aspects are subsequently extended using additional, non-iconic views. Photographs relevant to each landmark tag were retrieved and distinctive visual features were extracted from them. The results for landmarks include names, geographic hierarchy and its visual features
KEYWORDS |
| Landmark Images, Clustering, Ranking, Visual Features, Tags |
1. INTRODUCTION |
| More and more of the Earth’s cities and sights are photographed each day from a variety of digital cameras, viewing positions and angles, weather and illumination conditions; more and more of these photos get tagged by users and uploaded to photo-sharing websites. Main goal is to efficiently identify all photos that actually represent the landmark of interest, and to organize these photos to reveal the spatial and semantic structure of the landmark. In particular, popular services like Flickr [1] for images and YouTube [2] for video have revolutionized the availability of web-based media resources. There are several challenges like Contamination, Diversity and Scale. |
| Contamination: When dealing with landmark photo collections, it has been observed that keywords and tags are accurate only approximately 50% of the time. A large fraction of the input images comprises of “noise,” or images that are unrelated to the concept of interest. |
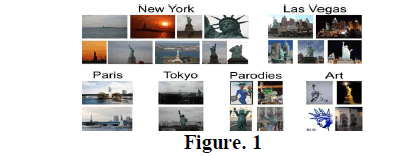
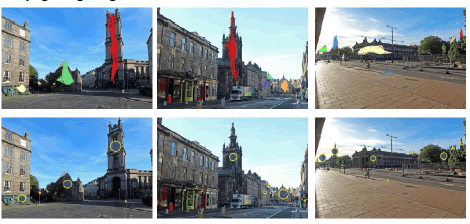
| Diversity: The issues of contamination aside, even “valid” depictions of landmarks have a remarkable degree of diversity. Landmarks may have multiple aspects, they may be photographed at different times of day and in different weather conditions (Figure 1). The figure represents the diversity of photographs depicting “Statue of Liberty”. There are copies of the statue in New York, Las Vegas, Tokyo, and Paris. The appearance of the images can vary significantly based on time of day and weather conditions. Further complicating the picture are parodies (e.g., people dressed as the statue) and non-photorealistic representations. |
| Scale: The typical collection of photos annotated with a landmark-specific phrase has tens to hundreds of thousands of images. |
 |
| In particular, the annotation and metadata provided by users is often inaccurate [3] and noisy; photos are of varying quality; and the sheer volume alone makes content hard to browse and represent in a manner that improves rather than degrades as more photos are added. In addition, hoping to capture the long tail" of the world's landmarks, it is not possible to train classifiers for every one of these landmarks. These challenges can be overcome by using community-contributed media to improve the quality of representation for landmark and location-based searches. |
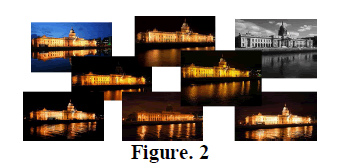 |
| Figure 2. An example of images returned from a Flickr. It is straightforward to see that all images are visually very similar and have been taken from a relatively similar position[4] |
| To tackle the landmark problem, First, tags are used (short text labels associated with images by users) and then the location metadata to detect tags and locations that represent landmarks or geographic features. Then, visual analysis of the images associated with discovered landmarks are done to extract representative sets of images for each landmark. This two-stage process is advantageous, since visual processing is computationally expensive and often imprecise and noisy. Then reduced set of images are given as input for generating a diverse and representative set of images for a landmark based on identifying “canonical views" [5, 6]. Using various image processing methods, clustering is done for the landmark images, as well as generates links between those images that contain the same visual objects. Based on the clustering and on the generated link structure, the top representative images for each such view is selected. The work of Tsai et al. [7], for example, attempted to match landmark photos based on visual features, after altering a set of images based on their location context. In [3], the authors investigated the use of “search-based models" for detecting landmarks in photographs. In that application, the focus was the use of text-based keyword searches over web image collections to gather training data. The first part of the process is described in detail in [8], and consists of a geographic clustering step followed by a scoring step for each tag in each cluster. The second part of our proposed landmark identification is identifying individual tags. This set of tags and their location clusters is the input for our image analysis effort of creating representative views. |
II. GENERAL SYSTEM ARCHITECTURE & FEATURES |
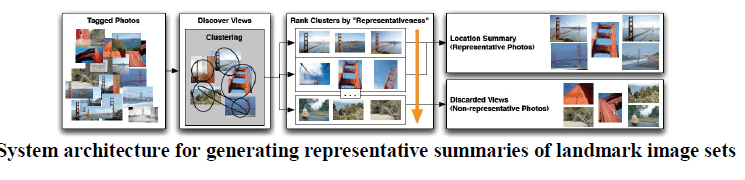 |
| The general approach for our visual location summarization framework is illustrated in Figure 1. First, given a set of images (and their extracted visual features) associated with a landmark, visual clustering can be performed across the set of images and various common views of that landmark. Then, a set of heuristics can be applied over these visual clusters to order them according to their representativeness of the landmark. Within each visual cluster, ranking the individual images according to their representativeness can also be done. In the end, a set of summary images are extracted by selecting the highest-ranked images from the highest-ranked clusters and discarding low-ranked clusters and low-ranked images. lobal color and texture features can capture the recurrent spatial layouts of typical photographs. For example, in photographs of Coit Tower, a shot of a white structure centered against a blue sky was expected. However, many other locations have similar patterns. Local feature descriptors can help to identify the actual structural elements of the real-world object and ensure that the intended object is actually contained in the photograph; however, these local descriptors do little to help us identify the common photographic compositions used to portray these landmarks. By combining these two types of descriptors, it can be ensured that the photos selected have both the expected photographic composition and actually contain the target landmark. |
III. PROCESSING STEPS |
Image Clustering: |
| Visual features can be used to discover the clusters of images within a given set of photos for any landmark. The hope is that the clustering will expose different views of the landmark: a variety of angles, different portions of the structure, and even exterior vs. interior photos. Clustering can be performed using a cluster algorithm which is a standard and straight-forward approach. The global (color and texture) features, Local (SIFT) features are not used for clustering due to their high dimensionality, but are later incorporated for ranking clusters and images. In any clustering application, the selection of the right number of clusters is important to ensure reasonable clustering results. |
 |
Geometric verification and iconic image selection: |
| Geometric verification can be done to select the iconic image selection. Different clustering techniques can be used for selection. Spatial and Content Based Clustering Networks and Weighted Centroids at Feature Level Spatial clustering, based on tag location only, was also unsuitable as landmark boundaries in each image were undefined, and clustering techniques based on proximity may group tags from unrelated landmarks. |
 |
Re-clustering and Ranking: |
| Lower-ranked clusters can be discarded and hidden from the user, since they are presumed to contain lessrepresentative photographs. Several heuristics can be used to identify representative clusters, hypothesizing that such clusters should (1) contain photos from many different users (i.e., there is a broad interest in the photos from this cluster), (2) be visually cohesive (the same objects are being photographed or the same type of photos taken) and (3) contain photos that are distributed relatively uniformly in time. |
Cluster scoring mechanisms: |
| • Number of users: The number of users that are represented in photos from a cluster. This metric can be used instead of the number of photos to avoid a situation where many photos from a single user bias the results. |
| • Visual coherence: The visual features are described to measure the intra-cluster distance (the average distance between photos within the cluster), and the inter-cluster distance (the average distance between photos within the cluster and photos outside of the cluster). The ratio of inter-cluster distance to intra-cluster distance is calculated and used. A high ratio indicates that the cluster is tightly formed and shows a visually coherent view, while a low ratio indicates that the cluster is noisy and may not be visually coherent, or is similar to other clusters. |
| • Cluster connectivity: SIFT features can be used to reliably establish links between different images which contain views of a single location. If a cluster's photos are linked to many other photos in the same cluster, then the cluster is likely to be representative, as these links may imply a similar view or object that appears in many photos. The metric is based on the average number of links per photo in the cluster. |
| • Variability in dates: Standard deviation of the dates in which the photos in the cluster were taken into account. Preference is given to clusters with higher variability in dates, since this indicates that the view is of persistent interest. Low variability in dates indicates that the photos in the cluster were taken around the same time and that the cluster is probably related to an event, rather than a geographic feature or landmark. |
Representative Images: |
| Representative images will exhibit a mixture of qualities: (1) representative images will be highly similar to other images in the cluster, (2) representative images will be highly dissimilar to random images outside the cluster, and (3) representative images will feature commonly-photographed local structures from within the set. |
Reconstruction –Iterated Process |
| • Low-Level Self Similarity: To measure whether images are similar to other images in the cluster, the centroid of all of the images are taken in low-level global (color and texture) feature space and rank images but to their distance from the centroid. Each feature dimension is statistically normalized to have a mean of zero and unit standard deviation and the centroid is the mean of each feature dimension. The images within each cluster are then ranked by their Euclidean distance from the centroid. |
| • Low-Level Discriminative Modeling: To measure the dissimilarity between a given image within a cluster and images outside of a cluster, a discriminative learning approach can be applied by taking the images within the cluster to be pseudo-positives and the images outside the set to be pseudo-negatives. Recent efforts have suggested that such light-weight discriminative models (fused with low-level self-similarity) can actually greatly improve the performance of image ranking for a number of applications[10]. |
| • Point-wise Linking: The above-mentioned low-level self-similarity and discriminative modeling methods use global low-level features and mostly capture recurrent global appearances and patterns. These metrics do not necessarily capture whether or not any two images are actually of the same real-world scene, or contain the same objects. The overlap between any two given images can be discovered through the identification of correspondences between interest points in these images. |
| Representative images for each tag can be extracted using four different techniques: |
| 1. Tag-Only: This method serves as a baseline for the system performance, randomly selecting ten images with the corresponding tag from the dataset |
| 2. Tag-Location: In this second baseline, the system can randomly choose ten images with the corresponding tagthat fall within one of the tag's extracted location clusters |
| 3. Tag-Visual. Images are selected by our system, running the visual analysis described above on all photos. |
| 4. Tag-Visual-Location: Images are selected, by running the visual analysis as described above on photos that fall in one of the extracted clusters. |
IV. CONCLUSION |
| Rich information about locations and landmarks can be learned automatically from user contributed media shared on the web. In particular, a collection's locations of interest can arise from geo-spatial photographing patterns. Meaningful tags that represent these locations and landmarks can be learned from tags that users frequently associate with the images. Finally, Visual models of landmarks and geographic features can be learned through mining the photos acquired and shared by many individuals, potentially generating a summary of the frequently-photographed views by selecting canonical views of the landmarks and rejecting outliers. |
V. FUTURE WORK |
| A few complicating issues still arise from the nature of landmarks, and the way users apply tags to photos. For instance, some geographic landmarks can act as a point from which to photograph, rather than the target of the photo; such photographs are often tagged with the geographic landmark which is the source of the photo. For example, Coit Tower is a frequently-photographed landmark, but many of the photographs associated with the tag Coit Tower are actually photographs of the San Francisco skyline, taken from the observation deck at the top of the tower. Similarly, for museums and other buildings, the expected representative views are split between outside views of the building, as well as recognizable internal architectural aspects. User might also photograph particular artworks and other nonrepresentative interior views of such landmarks. Future work might explore the best approaches for incorporating such a system into a standard web-based image search engine. Also solutions should be there to merge the results with traditional web-based results, new result presentation technique can be used to leverage the knowledge of visual clusters and map locations. Some answers are easier than others, but it is all certainly quite promising. |
References |
|