ISSN ONLINE(2320-9801) PRINT (2320-9798)
ISSN ONLINE(2320-9801) PRINT (2320-9798)
| K.Vimala Assistant Professor, National Engineering College, Kovilpatti, Tuticorin, Tamilnadu, India |
| Related article at Pubmed, Scholar Google |
Visit for more related articles at International Journal of Innovative Research in Computer and Communication Engineering
Electrocardiogram (ECG) is an electrical recording of the heart and is used to measure the rate and regularity ofheartbeats.The cardiac arrhythmias are identified and diagnosed by analyzing the ECG signals. In this paper, the human stress assessment is the major issues taken to identify arrhythmia, where thefeature extraction is done using Discrete Wavelet Transform (DWT) technique for the purpose of analyzing the signals. The DWT technique is used to denoise the ECG signal by removing the corresponding wavelet coefficients and also used to retrieve relevant information from the ECG input signal. The classification of the stress causing arrhythmia from ECG signal is performed by the Hidden Markov Model.
Keywords |
| Electrocardiogram (ECG), Stress, Arrhythmia, WaveletTransform, Hidden Markov Model (HMM). |
INTRODUCTION |
| The heart is a hollow muscular organ which pumps theblood through the blood vessels to various parts of the body by repeated, rhythmic contractions. Any disturbance in the heart rhythm leads to various cardiac diseases and also causes sudden death. Though cardiac arrhythmias are the major leading causes of death, if detected on time it can be treated properly. Heart arrhythmia cancause too slow or too fast performance of the heart and are detected using ECG signals. |
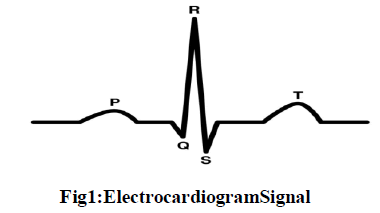
| ECG signal records the electrical performance of the heart. The ECG signal tracing has different wave such as the P wave, QRScomplex andthe T wave. Figure 1 shows an electrocardiogram signal. These data include positions and/or magnitudes of the QRS interval, PR interval, QT interval, ST interval, PR segment, and ST segment. The P wave is the result of slow moving depolarization of the atria. QRS complex comprises of Q, R and Swaves shows ventricular depolarization.The T-wave is the result of repolarization of the ventricles, and is longer in duration than depolarization. Based on the above data, doctors can correctly diagnose human heart diseases. Therefore, analyzing the ECG signals of cardiac arrhythmia is very important for doctors to make correct clinical diagnoses. |
| The electrocardiogram (ECG) signal always contaminated by noise and artifacts. The noises may be muscular noise, powerline interferences and baseline wandering. The removal of these noises leads to efficient analyzing of the ECG signal. |
| Stress is a person’s response to a stressor, which is due to environmental condition or a stimulus. The stress is a body’s method of reacting to a challenge. The “fight or flight” response when a person perceives threat helpsthe bodyexert energy to fight or run away. The types of stress are acute stress, which is a psychological condition which arises in response to a terrifying event and chronic stress, is due to the emotional pressure suffered for a prolonged period by an individual over which he or she has no control. |
 |
| The chronic stress takes a more significant toll on body than acute stress. The responses to acute stressors do not impose a health burden on young, healthy individuals but the chronic stress in older or unhealthy individuals may have long-term effects in their health. |
| The chronic stress causes heart problems in several different ways such as causes severe chest pain and rapid increase in the heart rate. The person with heart problems undergoes stress will cause severe chest pain or sudden death. The identification of stress causing arrhythmias manually by analyzing the electrocardiogram signal is complicated. So, the automatic analysis of ECG using computer systems would be very helpful for accurate detection of stress causing arrhythmias like ventricular tachycardia and ventricular fibrillation. |
II. RELATEDWORK |
| An extensive survey has been taken focusing on thedetailed description about the preprocessing of the ECG signal, feature extraction and the classification methods. The main task is the selection of the wavelet, before starting the feature extraction. The selection of wavelet is based on the typeof signal to beanalyzed. The Discrete Wavelet Transform technique is selected for the removal of noises in the ECG signal. The Daubechies wavelet function is chosen as the discrete wavelet transform technique. In daubechies, db4 is selected because of its similarity with QRS complex of the ECG signal [8]. The reduction of noises in the ECG signal retains the ECG morphology effectively [7]. |
| The clinically information in the ECG signal is mainly concentrated in the intervals and amplitudes of its features. The features were extracted from the discrete wavelet coefficients of the ECG signal. The time interval and morphological features from the ECG signals are used in the classification of ECGs into normal rhythm and arrhythmic [2]. |
| The arrhythmia is classified based on the site of its origin. The human stress assessment leads to the arising of deadly arrhythmia like ventricular arrhythmia. The life-threatening ventricular arrhythmia causes due to chronic stress are Ventricular Tachycardia and Ventricular Fibrillation [12]. The detection of this life threatening arrhythmia is difficult because of its waveform and frequency distribution changes with time. |
| Normally the amplitude of ECG signal decreases as ventricular fibrillation duration increases [13]. Regarding the classification of cardiac arrhythmias, a large number of methods have already been proposed. The classification approaches such as are neuro-fuzzy [3], support vector machines [6], discriminant analysis, hidden markov models, and neuro-genetic [9]. Among the statistical approaches, the HMMs have drawn attention since Coast’s pioneer work [4]. For automated analyzing of arrhythmia detection has proliferated since the early 1960’s and many are used clinically. These systems use only the QRS complex and the R-R interval to group arrhythmias by origin into ventricular or supraventricular categories and to further analyze ventricular arrhythmias. The main advantage of hidden markov model is that the Markov chain topology preserves structural characteristics while state parameters account for the probabilistic nature of the observed data. In this paper, the hidden markov model is employed to accurately detect each beat by its wavefront components so that the stress related ventricular arrhythmia analysis can be achieved. |
III. DATASET |
| The ECG records are obtained from the MIT-BIHDatabase from Physionet. The ECG signals are obtained from the Massachusetts Institute of Technology–Beth Israel Hospital (MIT-BIH) Arrhythmia Laboratory. The databases selected for analyzing the ECG signals to detect the arrhythmias are MIT-BIH Normal Sinus Rhythm Database, MITBIH Arrhythmia Database and MIT-BIH Malignant Ventricular Arrhythmia Database.The number of records collected from the MIT-BIH Normal Sinus Rhythm Database is 18 and from the MIT-BIH Arrhythmia Database are 48 and from MIT-BIH Malignant Ventricular Arrhythmia Database are 22. |
IV. METHODOLOGY |
| The main goal of the proposed system is to identify the stress related arrhythmias using the electrocardiogram signals. The system involves the process of denoising the ECG signal, feature extraction and classifying the ventricular arrhythmia. The development of the system is divided into the following modules: 1.Preprocessing, 2.Feature extraction and 3.Classification. |
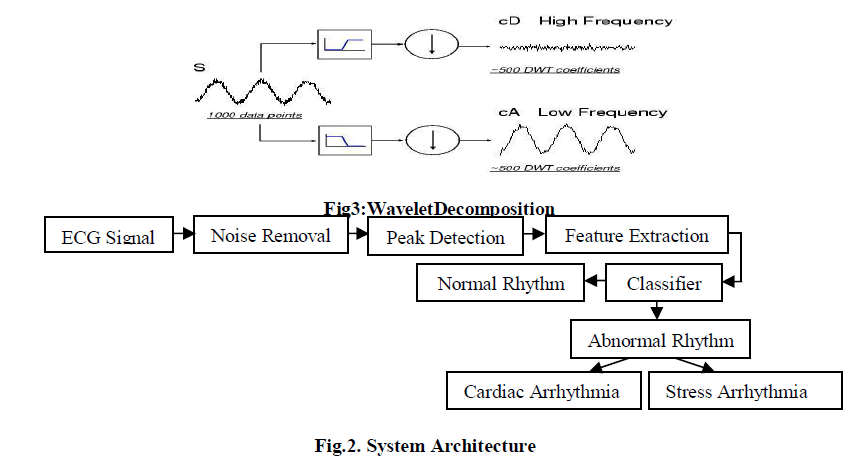
| The preprocessing module mainly deals with the process of removing the noises from the ECG signal and the signal is decomposed into several sub-bands. The next module is the feature extraction from the ECG signal. The final module deals with the classification technique used for the ECGanalysis. The Figure 2 shows the proposed system. This work is implemented by using MATLAB software. |
A. Preprocessing |
| The ECG signals are overlapped with noises and artifactswhich lead to inaccurate diagnosis of the arrhythmias. The noises occurred dueto the movement of muscles, powerline interferences, and baseline drift and so on. The removing of noises from ECG signals is done using the Discrete Wavelet transform. The wavelet transform has the property of multi- resolution which gives both time and frequency domain information in asimultaneous mannerthrough variablewindow size.The wavelet transform is scaledand shiftedversion of the time mother wavelet. The mother wavelet DWT is expressed by: |
| where, 'a' and ‘b’ are the scaling and the shifting factor, respectively and R is the wavelet space. |
| The basic principle of DWT is to decompose the signal into finer details. The time-frequency representation of DWT is performed by repeated filtering of the input signal with a pair of filters namely low pass filter and high pass filter. The coefficient corresponding to the low pass filter is called as Approximation Coefficients (CA) and high pass filtered coefficients are called as Detailed Coefficients (CD). The approximate coefficients are decomposed into the detail and approximate at the further levels and the process continues. Among the various wavelet bases, the daubechies family of wavelet is very efficient. In this paper, the daubechies family of wavelet db4 is used for decomposition. The daubechies4 is selected because of its similarity with the QRS complex of the ECG signal. The Figure 3 shows the basic filtering using wavelet decomposition. The signal with1000 data points is decomposed into 500 data points of high frequency detailed coefficients and 500 data points of low frequency approximation coefficients. |
 |
| From the denoised signal the R-peak is detected which is used for extracting the features and also useful in identifying the QRS complex of the ECG signal. Using the QRS complex, the ventricular arrhythmias can be detected accurately from the abnormal ECG signal. |
B. Feature Extraction |
| The second module deals with the extraction of features from the ECG signal. The ECG signals are the representative signals of cardiac physiology which are mainly used in the diagnosing of cardiac disorders. The wavelet transform provides a very general technique that can be applied to the applications of signal processing. Many features can be obtained and also be used in compressed domain using the wavelet coefficients. The db4 is a discrete wavelet transform which is applied on the ECG signal and are convert to the wavelet coefficients. The obtained coefficients characterize the behavior of the ECG signal and the number of these coefficients are small than the number of original signal.This reduction of feature space is particularly important for identification and diagnostic purposes. |
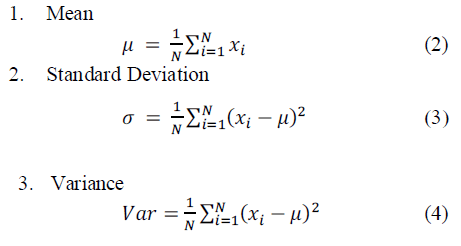
| The various features such as mean, standard deviation, and variance of the peak amplitudes of the signal and also the mean of the intervals are extracted from the noiseless ECG signal. The stress causing arrhythmia detection mainly depends on the feature values. Some of the features and its equations are: |
 |
C. Classification |
| Based on the features extracted, the classifier classifies the ECG signal into normal and abnormal rhythm. The hidden markov model is used for the classification of the ECG signals. |
| A hidden Markov model is a stochastic finite state machine. The Hidden Markov Model is a double-layered finite state stochastic process, with a hidden Markovian process that controls the selection of the states of an observable process. In general, an HMM has N states, and transitions are available among the states. At different times, the system is in one of the states; each transition between the states has an associated probability, and each state has an associated observation output (symbol).An HMM is characterized by the followings: |
 |
| A complete specification of a HMM requires specification of model parameters, specification of the three probability measuresA,B, π.HMMparametersusethefollowingset: |
| Λ={A,B, π} (8) |
| The HMM training consists of estimating the model parameters set Λ from the observation sequence O. The model comprises of seven states and for each state the initial priority matrix, transition matrix and emission matrix are assigned. These are givenas input to thestochastic process.In the learning process the Baum-Welch algorithm is used to compute the maximum likelihood for the model. The maximum likelihood estimates the hidden states and observation sequence. Then the Baum-Welch algorithm is used to classify the arrhythmia from the ECG signal. The HMM classifies the ECG signal into a normal rhythm or anabnormal rhythm. |
V. EXPERIMENTAL RESULTS |
| The ECG signal obtained from the MIT-BIH database is preprocessed to remove the noises using daubechies4 (db4) wavelet. The input signal is shown in Figure 4. The signal is plotted with time in the x-axis against amplitude in the yaxis. The noises in signal such as baseline wandering and powerline interferences are removed using the db4 wavelet function and the noiseless signal is shown in the Figure 5. |
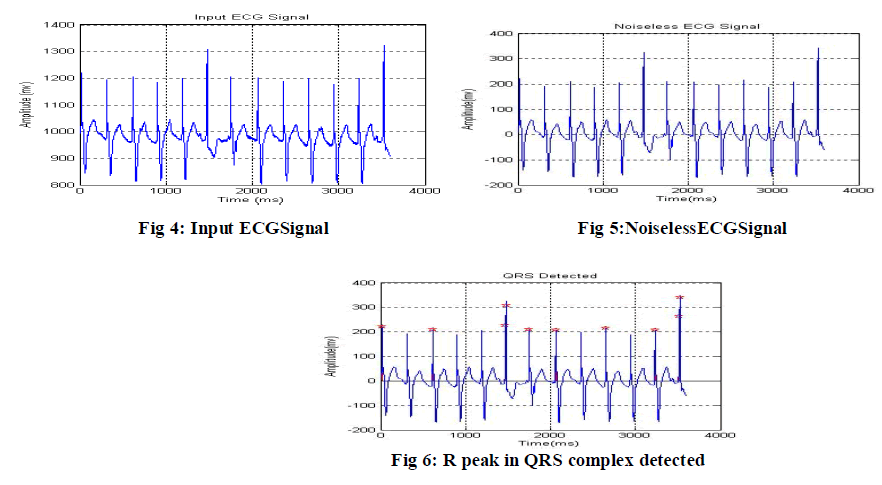 |
| The fig 6 shows the detection of R peak from the ECG signal, which helps in feature extraction such as Mean, Max, Min and Standard Deviation. The daubechies4 (db4) gives the best result in denoising the ECG signal when comparing with other daubechies wavelet families. The comparison results of the statistical values of the noisy ECG signal with denoised ECG signal using db4 wavelet is shown in the Table 1. |
 |
| For the performance evaluation, the ECG records are selected from the Arrhythmia database. The common statistical metrics used for evaluating the performance of the classification results are sensitivity, specificity and accuracy. The overall performance shows the capability of the stress arrhythmia detection with high accuracy. |
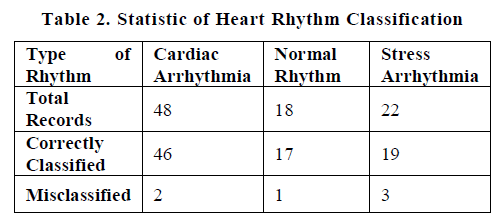 |
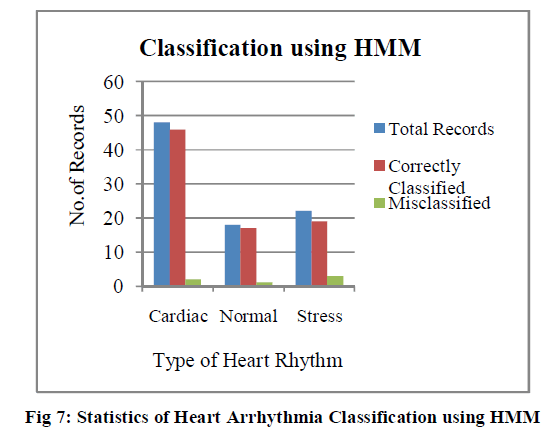
| The Table 2 shows the correct classified and misclassified data samples of type of heart rhythm. The total records of cardiac arrhythmia are48 and the misclassified record is2. The total records of normal rhythm are 18 and the misclassified record is 1. The totalrecords of cardiac arrhythmia are 22 and the misclassified record is 3.Figure.7 shows the number of misclassified ECG records to the total number of records. |
 |
VI. CONCLUSION |
| The identification of human stress assessment relatedarrhythmia from the ECG signal is difficult because of its timevarying morphological features. The ECG signal is first preprocessed to remove the noises from it. The Daubechies4 wavelet transform is used for removing the noises. The QRS complexes in the ECG signal are detected for the purpose of identifying the slow rhythm or fast rhythm and also for detecting the arrhythmic diseases. The various features of the ECG signal are extracted and the hidden markov model is used for the classification of the stress arrhythmic. The automated system developed for the detection of ventricular arrhythmia yields an accuracy of 93.18%. In future work, the ECG signals can be segmented and obtain the feature values from the segmented ECG and based on those feature values the stress arrhythmia can be detected using hidden markov model. |
References |
|