Keywords |
| WSN, trust-aware routing, energy efficient routing, secure routing, sensor energy, throughput, jitter,
control overhead, simulation, dropping ratio, delay. |
INTRODUCTION |
| Wireless Sensor Networks (WSNs) are invading our everyday life with their proliferating applications which cover
environmental observation, homeland security, building and factory monitoring and personal healthcare [2]. The small
dimensions of sensor nodes combined with their low cost, further contribute towards wider penetration leading to
exponentially increase of the number of deployed sensor nodes in the near future [2]. Due to recent technological
advances, the manufacturing of small and low-cost sensors has become technically and economically feasible. These
sensors measure ambient conditions in the environment surrounding them and then transform these measurements into
signals that can be processed to reveal some characteristics about phenomena located in the area around these sensors.
A large number of these sensors can be networked in many applications that require unattended operations, hence
producing a wireless sensor network (WSN). Even from their earliest deployments, sensor networks have been attacked
by adversaries interested in intercepting the data being sent or reducing the ability of the network to carry out its tasks.
As the applications of WSNs1 become more complex and widespread, the ability to protect such systems has become
increasingly important. Although military applications seem to have the strictest security requirements, issues like data
confidentiality, data integrity and network availability are also important to any WSN application [2]. The
implementation of trust aware routing framework aims to secure routing solutions in wireless sensor networks. And in
this paper we are studying the performance of the framework in various nodes arrangements. |
| Rest of the paper is organized as assumptions in II, implementation in III, performance evaluation in IV, graphical
analysis in V, and conclusion in VI. |
ASSUMPTIONS |
| In a data collection task, a sensor node sends its sampled data to a remote base station with the aid of other
intermediate nodes. There could be more than one base stations, our routing approach is not affected by the number of
base stations. Still for simplification purpose we are assuming here only one base station. We assume a data packet has
at least the following fields: the sender id, the sender sequence number, the next-hop node id (the receiver in this one
hop transmission), the source id (the node that initiates the data), and the source’s sequence number [3]. |
IMPLEMENTATION |
| Data transmission accounts for a major Portion of the energy consumption. We evaluate energy efficiency by the
average energy cost to successfully deliver a unit-sized data packet from a source node to the base station, be given
enough attention when considering energy cost since each re-transmission causes a noticeable increase in energy
consumption. If every node in a WSN consumes approximately the same energy to transmit a unit-sized data packet,
we can use another metric hop-per-delivery to evaluate energy efficiency [3]. |
| A. SIMULATION IN WSN |
| Implementation of WSNs can be done using various tools. Network simulators like OPNET, NetSim and NS2 can be
used to simulate a wireless sensor network. Here we are using NS-2 as a network simulator with TCLscripting and C++
programming language. NS-2 as a non-specific network simulator can support a considerable range of protocols in all
layers. For example, the ad-hoc and WSN specific protocols are provided by NS-2. Secondly, the open source model
saves the cost of simulation, and online documents allow the users easily to modify and improve the codes [4]. |
| B. METHODOLOGY |
| In energy module, each node relies on its neighbourhood table to select an optimal route, considering energy
consumption and reliability. The neighbour energy cost is calculated by |
| Nb_energy_cost= (e_unit/p_succ)+ e_b |
| where e_unit= e_b/distance |
| p_succ= probability of the request message being acknowledged |
| According to neighbourhood table of energy values forwarding decision is taken [5]. In this simulation, we are
considering a network of 100 wireless sensor nodes and one base station at the centre of the network. |
PERFORMANCE EVALUATION |
| In performance evaluation we are considering two different node arrangement networks and comparing the results of
the two scenarios. Out of the two networks, we have timely results of one of the networks. |
| The following table shows the result values of the 10*10 flat grid Network as the simulation time progresses in three
cases i. e. a normal network, a network with attackers and a network without attacker nodes. The various simulation
parameters are considered to evaluate the results with simulation. |
| In the following table, the overall network performance is calculated for the 10*10 network arrangement. |
| The table 3 shows the performance analysis of the random arrangement of the 100 node network with and without
attack |
GRAPHICAL ANALYSIS |
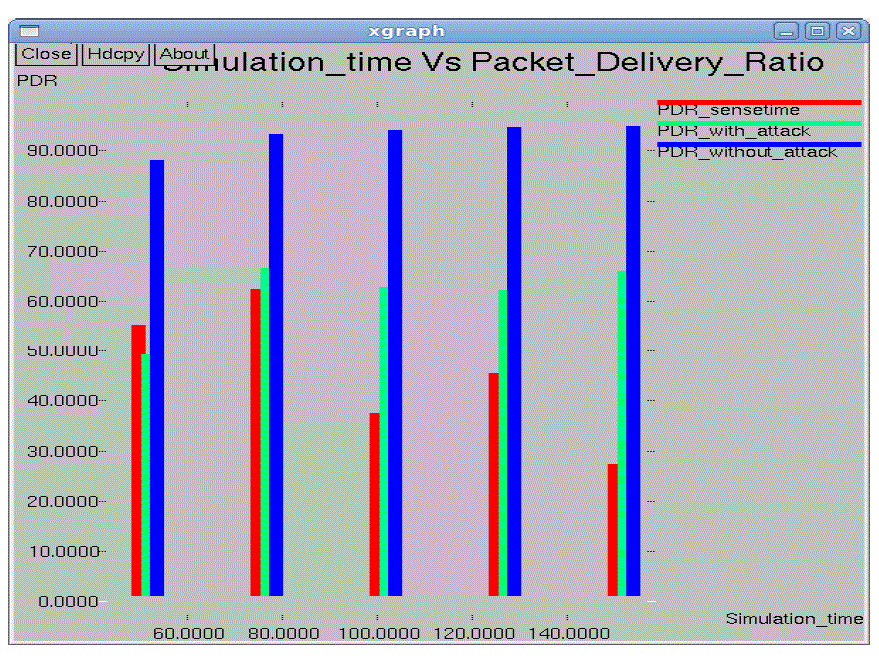
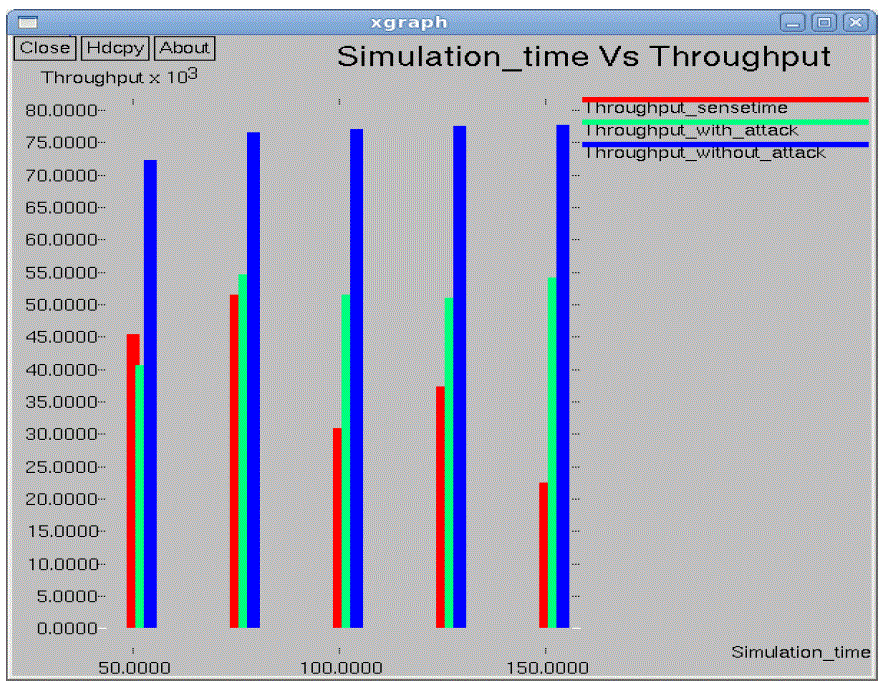
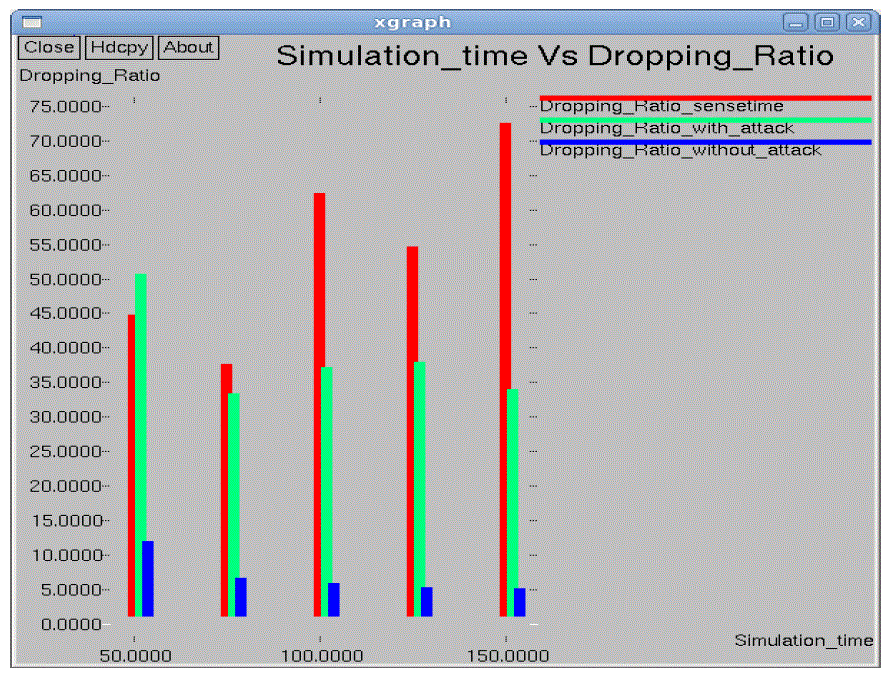
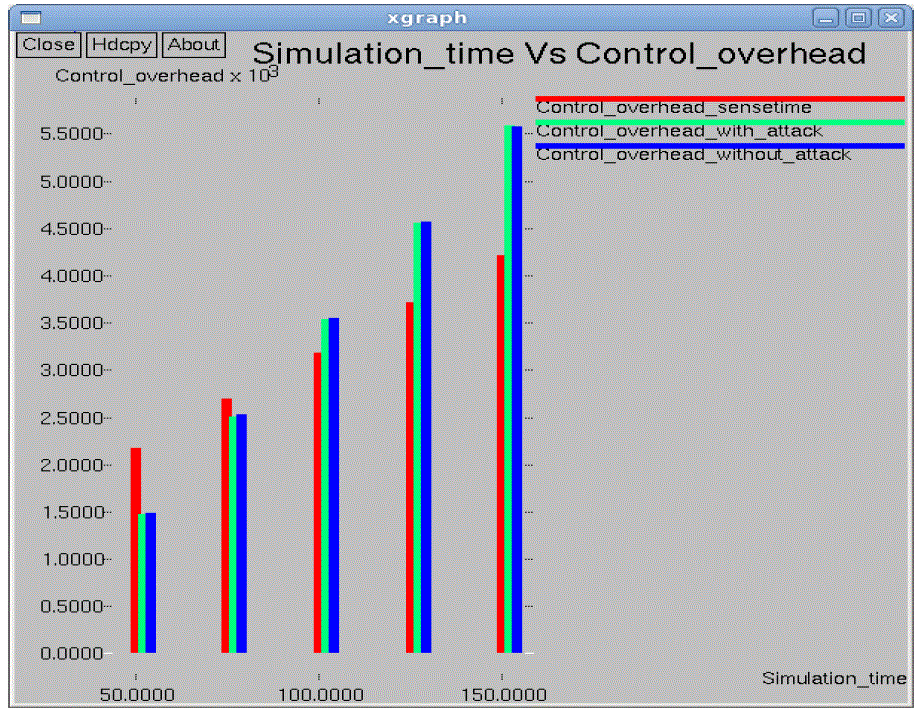
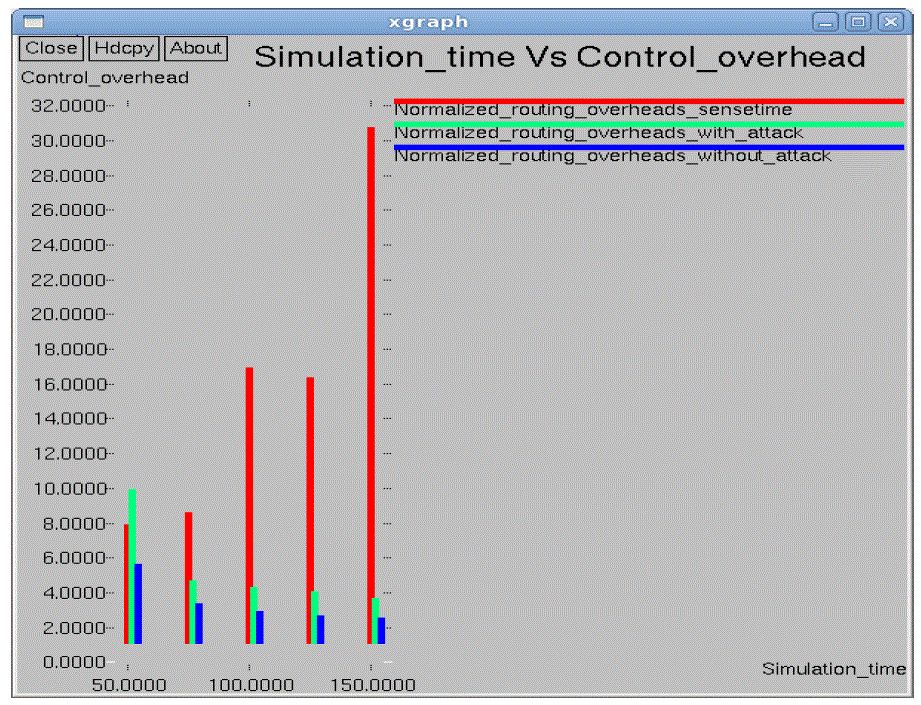
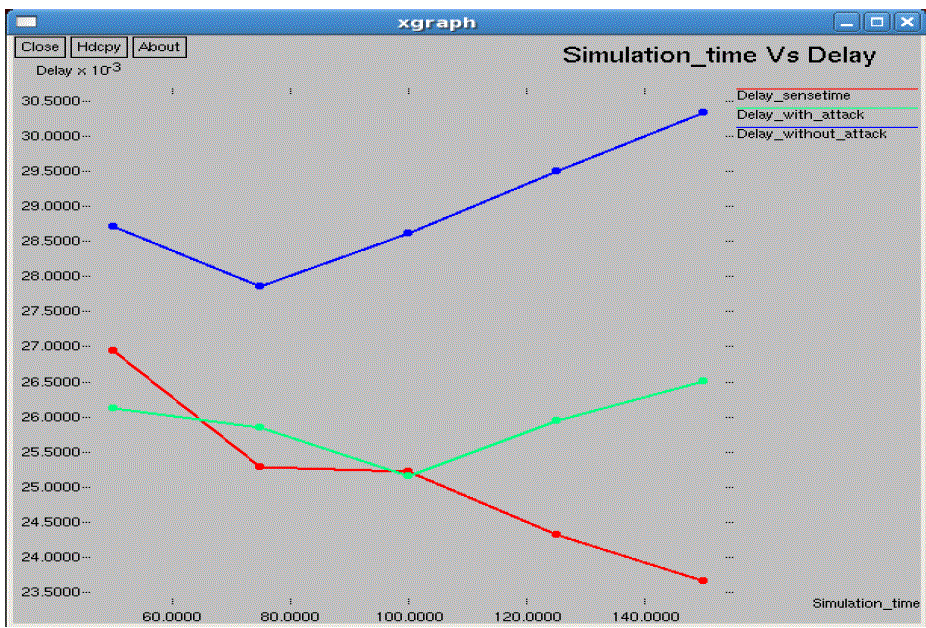
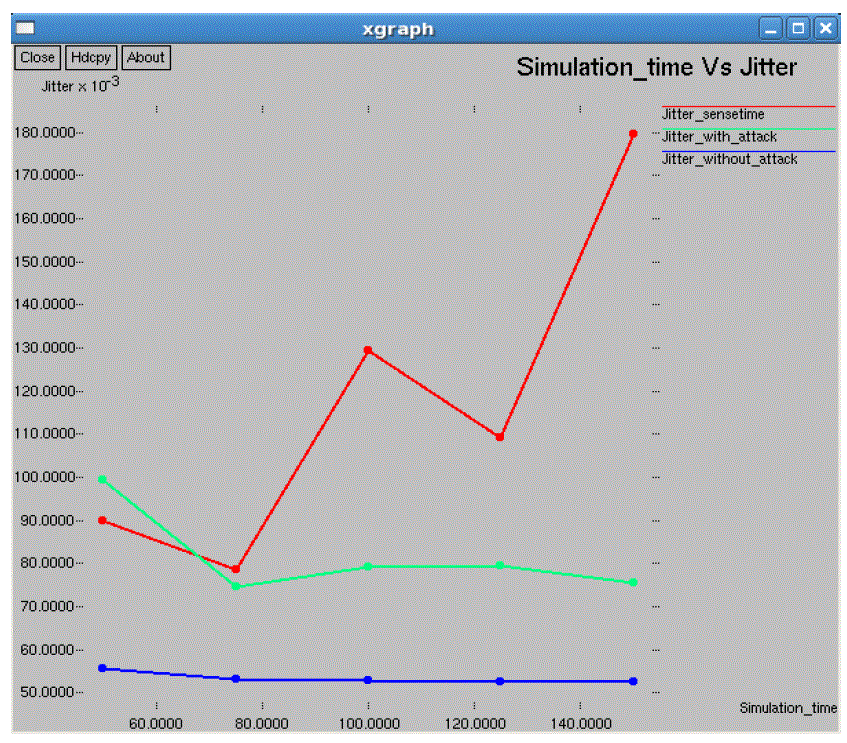
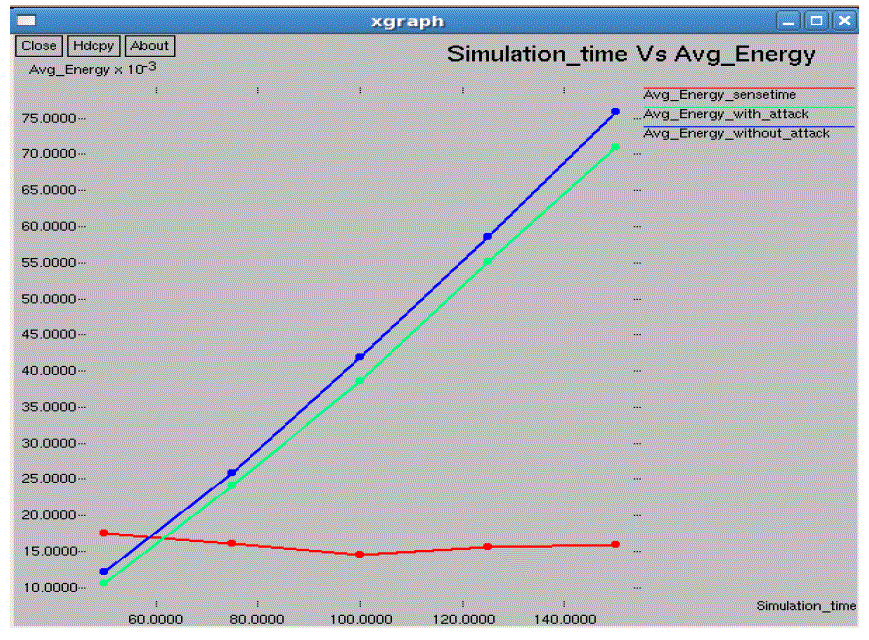
| In the performance evaluation process graph play an important role. While studying the two different types of node
arrangement networks we got some performance graphs. Out of those we are showing here the graphs for the 10*10 flat
grid network. While doing the graphical analysis we considered the three cases a normal network, a TARF enabled
network with attack and a TARF enabled network without attack. |
| The following graphs consider various parameters like average energy, throughput, delay, jitter, dropping ratio,
normalized routing overheads, control overheads, packet delivery ratio etc. |
CONCLUSION |
| In this paper we studied the implementation methodology of the TARF. According to that we evaluated the
performance results of the various scenarios of the networks. According to the comparison the experimental result
shows that as the network scenario changes for the wireless sensor nodes the performance of the network changes in
terms of throughput, average energy consumption and other parameters with and without attacker nodes. |
ACKNOWLEDGEMENT |
| It is a pleasure to acknowledge the assistance of my guide Prof. R. K. Krishna, Assistant Professor,
Department of Electronics and Telecommunication Engineering, R.C.E.R.T, Chandrapur for his valuable guidance,
continuous support and advice and constant encouragement throughout my project work. I am also grateful to Prof.
Nitin J. Janwe, Head, Department of Computer Technology, R.C.E.R.T., Chandrapur for his last minute instructions
which helped me to focus my work in the right directions. |
| I would like to extend my gratitude to honorable Dr. K. R. Dixit, Principal, R.C.E.R.T., Chandrapur, for being
a constant source of inspiration. |
| Finally, I would like to extend my thanks to all those who have contributed, directly or indirectly to make this
project successful. |
Tables at a glance |
|
|
Figures at a glance |
 |
 |
 |
 |
| Figure 1 |
Figure 2 |
Figure 3 |
Figure 4 |
 |
 |
 |
 |
| Figure 5 |
Figure 6 |
Figure 7 |
Figure 8 |
|
References |
- J. N. Al-Karaki, A. E. Kamal, ?Routing Techniques in Wireless Sensor Networks: A Survey?, IEEE Wireless Communication, pp 6-28, December 2004.
- T. Zahariadis, H. Leligou, P. Karkazis, P. Trakadas, ?Energy efficiency and implementation cost of trust aware routing solutions in WSNs?, IEEE Computer Society, 14th Panhellenic Conference on Informatics, pp 194-198, 2010.
- G. Zhan, W. Shi, and J. Deng, ?Design and Implementation of TARF: A Trust Aware Routing Framework?, IEEE Transactions on Dependable and Secure Computing, Volume: 9 , Issue: 2, 2012.
- Ms. DipaliDikondwar, Prof. R. K. Krishna, ?Implementation of energy efficient and trust aware routing for WSNs ? Energy Consideration?, International Journal of Scientific and Engineering Research (IJSER), Vol. 4, Issue 7, ISSN 2229-5518, July, 2013.
- G. Zhan, W. Shi, and J. Deng, ?TARF: A trust aware routing framework for wireless sensor networks?, in proceeding of the 7th European Conference on Wireless Sensor Networks (EWSN?10) 2010.
|