2African Institute for Mathematical Sciences (AIMS), South Africa
3Pan African University, Institute for Basic Sciences, Technology and Innovation, Nairobi, Kenya
4Jomo Kenyatta University of Agriculture and Technology, Nairobi, Kenya
Received date: 06/01/2018; Accepted date: 14/03/2018; Published date: 19/03/2018
Visit for more related articles at Research & Reviews: Journal of Statistics and Mathematical Sciences
Queues are common scenario faced in the modern day Banks and other financial Institutions. Queuing theory is the mathematical study of waiting lines; this can also be applicable queues in the banking system. This study examine the queuing system at Guarantee Trust Bank (GTB) putting into consideration the waiting time spend by Customers, Service time spend by a Customer and the average cost a customer loses while in queue and the service cost of each server in order to optimize the system. The First Come First Serve (FCFS) Multi-Server queuing model was used to model the queuing process. The waiting time was assumed to follow a Poisson distribution while the service rate follows an Exponential distribution. This study adopted a case study approach by randomly administering questionnaires, interviews and observation of the participants. The data were collected at the GTB cash deposit unit for four days period. The data collected were analysed using TORA optimization window based software as well as standard queuing formula. The results of the analysis showed that the average queue length, waiting time of customer with a minimum Total Cost that utilize the system is by using five Servers against the present server level of Three Servers which incur a high total cost to both the Customers and the system.
Customers waiting time, Service time, Service cost, Waiting cost, Optimal service level
Queue or waiting lines are omnipresent as seen in our daily lives ranging from Businesses of all types, industries, schools, hospitals, cafeteria, banks, book stores, theatres, libraries, post offices, and petrol pumps all have queuing problems. Queues are also found in shops where machines wait to be repaired, in tool cribs where mechanics wait to receive tools and in telephone exchanges where incoming calls wait to be handled by the operators. Queues occur whenever there is competition for limited resources [1]. Queuing theory is also known as the theory of overcrowding. It is the branch of operational research that explores the relationship between the demand on a service system and the delays suffered by the users of that system [2]. Though queues are inevitable in daily routines of human beings, queuing system is main to introduce order into a system, a form of equity, fairness and justices to the system due to limited resources. This have drastically changed today due to high volume of customers that influx the system, this supposed orderly system have been bereaved by overcrowding customers. Time waste in the system that could have been used to attain other business targets by customers, customersÃÆâÃâââ¬Ãââ⢠dissatisfaction, balking from queues etc. are the ordeal of the day due to inability to maximize the available resources (Servers). Therefore, there is every need for this study which aimed at incorporating the Waiting Cost and Service Cost function with the Multi-Server Queuing model of First Come First Serve (FCFC) in order to evaluate the optimal service level. This study is crucial in the sense that it will shade more light on available literatures done by countless scholars in the quest to tackle queuing problems and incorporate the Cost functions in evaluating the appropriate optimal service level. This model can be adopted by policies makers and decision makers while considering service welfare in the Banking sector.
A queuing model of system is an abstract representation whose purpose is to isolate those factors that relate to the systemÃÆâÃâââ¬Ãâââ¢s ability to meet service demands whose occurrences and durations are random [2,3] opines that Queuing models are used to represent the various types of queuing systems that arise in practice, the models enable in finding an appropriate balance between the cost of service and the amount of waiting [4] uses the M/M/Z/8: FCFS model then converted it into M/M/1/8: FCFS to know which one is more efficient, a line or more lines. To do this, first they establish the optimization model of queuing and calculate the optimal model of queuing. Second, they derived the optimal number of service stations to improve operational efficiency. Thirdly, they derived the optimal service rate and the service efficiency by the operating costs. Based on these aspects, the results of their analyses were effective and practical. Constantin [1] introduced queuing processes and find the steady state solution to the M/M/1 queue. He briefly introduced the use of Markov chains, Poisson processes, and a Birth-Death process, their relevant formulations and the results yielded tremendous success. Kembe [5] adopted the use of Multi-server queuing system that as well included the cost functions for waiting and service costs into the system in order to evaluate the optimal total cost of the system. The results of their analyses showed a great stride in optimizing the service cost to the system.
This study therefore incorporated the cost functions in order to evaluate the optimal service level. The calculated the number of servers (Accountants) required so that a given percentage of Customers do not exceed a given waiting period of time and the average number of customers in the queue do not surpass a given threshold. The model assumes that Customers would leave without service if they wait above a particular period especially during busy days like Mondays and Fridays. Long waiting time for the Customers and the over utilization of Accountants have been the major challenges facing the Banking system in Nigeria precisely the Guarantee Trust Bank (GTB) located at Ahmadu Bello way, Jos Plateau State, Nigeria.
The study adopted the use of case study approach by collecting primary data from the Bank premises over the period of four days. The use of descriptive survey sample questionnaire were used to obtain the data from the correspondents while the waiting time and service time were evaluated using the aid of observations using a stopwatch and writing materials. To phase sampling approach was used to collect the data, the first phase adopted the use of simple random sampling technique to issue out the questionnaire randomly to the participants, while in the second phase the stratified simple random sampling was used to record the information relating to waiting time and service time as observed from the queuing system at the Bank Deposit section. Each day was considered to be strata, the use of trained (with regards to ethics, data privacy, courtesy, data entry, etc.) Research Assistant was employed during data collections and imputations. The following assumptions were made for queuing system at the Cash Deposit section of the Bank:
1. The arrival of Customers follows a Poisson distribution at an average rate of ? Customer per minute.
2. The queue discipline is First-Come, First-Served (FCFS) before any of the server there is no precise preference upon any arrival.
3. The Service times are distributed exponentially, with an average of ÃÆââ¬Å¡Ãâõ Customers per minute.
4. There is no bound to the number of queues (infinite calling source capacity)
5. The service providers are working inexhaustible to their full potential in line with the expectations of their employer
6. The average arrival rate is greater than the mean service rate.
7. Server, in this stance, represents only Accountants in the cash deposit section, not other Management members like CEOs, MDs, Security or cleaners.
8. Service rate is independent of line length; service providers do not hasten up due to the congested line. The PearsonÃÆâÃâââ¬Ãâââ¢s Chi-Square goodness of fit test was used to verify whether the arrival rate follows a Poisson distribution given as:
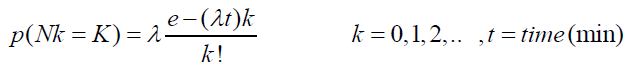 (1)
(1)
Where K represents the actual number of arrivals in a period of distribution t and the service rate follows an Exponential distribution, the parameter ÃÆââ¬Å¡Ãâõ by using the maximum likelihood estimator as given by:
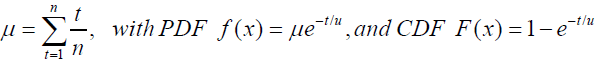 (2)
(2)
Where ÃÆââ¬Å¡Ãâõ = mean number of customers and t is the time taken for customer to receive service.
Model Specification
This study adopted M/M/C: (FCFS/8/8) (birth ÃÆâÃâââ¬Ãâââ¬Å death process) multi-server queuing model. In this model, it is shown that if 1/μ is the mean service time for one server to handle one customer, then the mean rate of service completion when there are customers in the system is
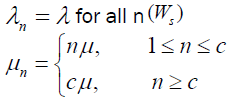 (3)
(3)
The probability of 0 customers in the system (Po) and the probability of n customers in the system Pn are given by
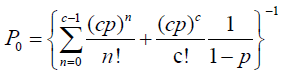 (4)
(4)
The capacity utilization in the system is  . We can use the above equation
 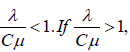 then the waiting line becomes larger and larger i.e., the waiting line becomes infinite if the process runs long enough.
When C=1 (i.e., there is one service facility), equation (4) reduces to
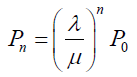 (5)
(5)
From equation (4),
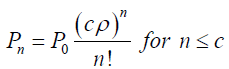 (6)
(6)
Also from equation (4),
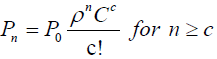 (7)
(7)
With C service facilities, the average number of customers in the queue is
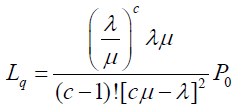 (8)
(8)
The average number of customers in the system (waiting plus service) is
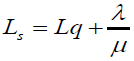 (9)
(9)
The expected waiting time in the queue for an arrival is
 (10)
(10)
The expected total time spent in the system (waiting plus service) is
 (11)
(11)
Introducing Cost into the Model
In order to evaluate and determine the optimum number of servers in the system, two opposing cost must be considered in making these decision;
i) Service costs
ii) Waiting time cost of customers
Economic analysis of these costs helps the management to make a trade-off between the increase costs of providing better service and the decreased waiting time costs of customers derived from providing that service.
Expected service cost
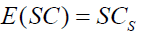 (12)
(12)
Where
S=Number of servers
CS =Service cost of each server
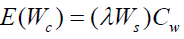
Expected waiting costs in the system
Where
? =Number of arrivals
Ws=Average time an arrival spends in the system
Cw=Opportunity cost of waiting by customers
Adding (12) and (13) we have,
Expected total cost E(TC) = E(SC) + E(WC) (14)
Expected total cost: 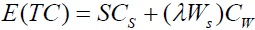 (15)
(15)
Where we further reduce equation (14) as:
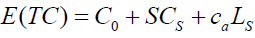
Where
Cs: The fixed cost of the operation system per unit of time.
Cs: The marginal cost of a registration agent (i.e., accountant at the cash deposit post) per unit of time (or total minute service cost).
Ca: The cost of waiting based on time spent in the queue and in the system.
Cost of Waiting Time (WC)
One unit of waiting time of a customer was estimated on the basic wage of ? 18,000 minimum wage salary scale. The mean waiting cost per customer is
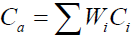
Where
Ci = Minute-wage of a customer belonging to civil servant or private cooperate business organization category
Wi = Weight of the category i (which is extracted from the total of the sample)
TORA Optimization System Software
A Windows-based software that offers lots of automated or tutorial mode to operational research models such as linear programming, transportation models, queuing models, project planning, etc. the automatic method that was used in this study provides a final solution to real life large mathematical programming models.
Data Analysis and Interpretation
The TORA optimization window base ÃÆââ¬Å¡Ãâî software as stated earlier was used to compute the performance measures of the Multi-server queuing system at GTB Ahmadu Bello Way Branch. Consider the input data below:
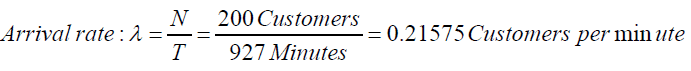
The system capacity, N=200 customers
The inter-arrival time for 200 customers, T=927 minutes
The time taken for 200 customers to be served, S=1426 minutes
We also have;

The CustomersÃÆâÃâââ¬Ãââ⢠Response To questionnaire
Questionnaires were administered to the customers at the GTB Cash deposit Post. Out of 230 questionnaires that were administered, 200 customers responded. Out of these 200 respondents, there were 123 men with 50 businessmen, 7 Sergeants, 5 Doctors, 4 Privates, 3 Chiefs, 2 Professors, 1 Captain, 1 Inspector, 4 lawyer, and 46 various Government parastatal workers. There were 77 female customers with 30 businesswomen, 2 Doctors, 1 Professor, 10 Corp members, 14 Students and 20 Government workers. Out of which 33% have spent 0 ÃÆâÃâââ¬Ãâââ¬Å 5years banking with GTB, 47% have spent 5 ÃÆâÃâââ¬Ãâââ¬Å 10 years, 20% have spent 10 ÃÆâÃâââ¬Ãâââ¬Å 15years. 52% are not satisfied with the banking system of GTB, 43% seem satisfied and 5% undecided. 97% witness dalliance in the queue at GTB and 3% do not. 62% spend 0 ÃÆâÃâââ¬Ãâââ¬Å 30 minutes, 28% spend 1hour and 7% spend 2hours, only 3% spend 3hours and above. 80% think something should be done, 15% disagree and 5% undecided. 72% suggested more helping hands should be employed at the cash deposit unit, 28% think the bank should encourage division of labour and 8% reserved their comments. 60% of the customers are civil servants of which 15% earn #18000(minimum wage),30% earn between #20,000 - #50,000, 12% earn #120,000 - #200,000 and 3% earn #240,000 ÃÆâÃâââ¬Ãâââ¬Å above. 40% owned various business sectors of which 20% generate at most #20,000 monthly, 15% generate #50,000 monthly, 4% generate #100,000 and 1% generate #500,000 ÃÆâÃâââ¬Ãâââ¬Å above. 85% agreed that the congested queue affects their earnings, 11% did not agree and 4% were undecided. 95% think something should be done about the queue out of which 73% suggested that the bank should employ more hands, 19% encourage division of labour and 8% undecided.
GTB ManagementÃÆâÃâââ¬Ãâââ¢s Response to Questionnaire
The Management of GTB Ahmadu Bello Way Branch, after a lengthy discussion said there are four Accountants(Servers) presently been used at the cash deposit post and the Management think that these present servers will go a long way in decongesting the queuing system at the Branch. The Manager said they of course noticed the congestion at the cash deposit post and have taken drastic measures to decongest the queuing system. Measures such as employing hardworking Accountants at the cash deposit unit, encouraging division of labour, minimizing lunch hour breaks and above all compensating exceptionally hardworking Accountants with huge bonuses like grants, incentives, loans and holidays. An estimated budget of #251,000 is spent monthly to maintain the system. He further disclosed that Accountants with higher qualifications earn more. Though the estimated budget is not enough according to him but it has gone a long way in decongesting the queuing system at his Branch and chose not to comment further (Tables 1-5).
| Parameter M/M/C/FCFS/8/8 | Value |
| Arrival rate(?) | 0.21575 (per minute) |
| Service rate(ÃÆââ¬Å¡Ãâõ) | 0.14025 (per minute) |
| Number of servers | 4, 5, 6, 7 and 8 depending on the scenario |
Table 1. Input parameters for TORA optimization window based ÃÆââ¬Å¡Ãâî software
| Scenario | S | Lambda | Mu | L’da eff | Po | Ls | Lq | Ws | Wq |
|---|---|---|---|---|---|---|---|---|---|
| 1 | 4 | 0.2158 | 0.1403 | 0.2158 | 0.2124 | 1.5887 | 0.0503 | 7.3634 | 0.2333 |
| 2 | 5 | 0.2158 | 0.1403 | 0.2158 | 0.2144 | 1.5482 | 0.0099 | 7.1759 | 0.0458 |
| 3 | 6 | 0.2158 | 0.1403 | 0.2158 | 0.2147 | 1.5402 | 0.0018 | 7.1386 | 0.0085 |
| 4 | 7 | 0.2158 | 0.1403 | 0.2158 | 0.2147 | 1.5386 | 0.0003 | 7.1316 | 0.0015 |
| 5 | 8 | 0.2158 | 0.1403 | 0.2158 | 0.2147 | 1.5384 | 5E-05 | 7.1304 | 0.0002 |
Table 2. Performance measures of M/M/C/FCFS/8/
| Weight category Ws | Percentage (%) distribution | Number of customers | Monthly earned income (?) | Total income earned (WiCi) |
|---|---|---|---|---|
| Civil servants | 60 | -- | -- | |
|
15 | 30 | 540000 | #6060000 |
| b) #20000 ÃÆâÃâââ¬Ãâââ¬Å #50000 | 30 | 60 | 1200000 | -- |
| c) #120000-#200000 | 12 | 24 | 2880000 | -- |
| d) #240000 ÃÆâÃâââ¬Ãâââ¬Å above | 3 | 6 | 1440000 | -- |
| Business | 40 | -- | -- | -- |
| a)ÃÆââ¬Å¡ÃâàÃÆââ¬Å¡Ãâà#20000 | 20 | 40 | 8,00,000 | #4100000 |
| b)ÃÆââ¬Å¡ÃâàÃÆââ¬Å¡Ãâà#50000 | 15 | 30 | 1500000 | -- |
| c)ÃÆââ¬Å¡ÃâàÃÆââ¬Å¡Ãâà#100000 | 4 | 8 | 800000 | -- |
| d) #500000 - above | 1 | 2 | 1000000 | -- |
| Total | 100 | 200 | -- | #10160000 |
Table 3. Summary of GTBÃÆâÃâââ¬Ãâââ¢s Customers monthly earned and generated income
| Scenario | (s) | ? | WS | ?WS | Co | Co | CW | SCs | (?Ww)Cw | E(TC) |
|---|---|---|---|---|---|---|---|---|---|---|
| 1 | 4 | 0.2158 | 7.3634 | 1.589 | #2.3148 | #3.4952 | #235.19 | #17.4760 | #373.7169 | #393.5077 |
| 2 | 5 | 0.2158 | 7.1759 | 1.5486 | #2.3148 | #3.4952 | #235.19 | #20.9712 | #364.2152 | #387.5012 |
| 3 | 6 | 0.2158 | 7.1386 | 1.5405 | #2.3148 | #3.4952 | #235.19 | #24.4664 | #362.3102 | #389.0914 |
| 4 | 7 | 0.2158 | 7.1316 | 1.539 | #2.3148 | #3.4952 | #235.19 | #27.9616 | #361.9574 | #392.2338 |
| 5 | 8 | 0.2158 | 7.1304 | 1.5387 | #2.3148 | #3.4952 | #235.19 | #31.4568 | #361.8869 | #395.6585 |
Table 4. Summary of the marginal costs, service costs, opportunity cost and the number of servers for the cash deposit unit at GTB Ahmadu Bello way branch
| Performance Measures | 4 Servers | 5 Servers | 6 Servers | 7Servers | 8 Servers |
|---|---|---|---|---|---|
| Arrival rate (?) | 0.2158 | 0.2158 | 0.2158 | 0.2158 | 0.2158 |
| Service rate (ÃÆââ¬Å¡Ãâõ) | 0.1403 | 0.1403 | 0.1403 | 0.1403 | 0.1403 |
| System Utilization | 38.45% | 30.76% | 25.64% | 21.97% | 19.23% |
| Ls | 1.5887 | 1.5482 | 1.5402 | 1.5386 | 1.5384 |
| Lq | 0.0503 | 0.0099 | 0.0018 | 0.0003 | 0.0001 |
| Ws- in minute | 7.3634 | 7.1759 | 7.1386 | 7.1316 | 7.1304 |
| WqÃÆââ¬Å¡ÃâàÃÆâÃâââ¬Ãâââ¬Å in minute | 0.2333 | 0.0458 | 0.0085 | 0.0085 | 0.0023 |
| P0 | 0.2124 | 0.2144 | 0.2147 | 0.2147 | 0.2147 |
| Total System Cost/min. | #393.5077 | #387.5012 | #389.0914 | #392.2338 | #395.6585 |
Table 5. Summary analysis of the M/M/C/FCFS/8/8 queuing model of the GTB cash deposit unit at Ahmadu Bello Way Branch.
From the Graph, Figures 1-5 show the line plots of the Utilization factor (?) against Average Customers waiting time in the system(Ws), Average Number of Customers in the system Ws against probability of the system being idle Ws , Expected service Cost against Level of service, Expected waiting cost against level of service and the Expected Total Cost (TC) against the Level of service.

Figure 1: A graph of the utilization factor (P) against average customers waiting time ( s W -minute)

Figure 2: A graph of average number of customers in the system (LS) against probability of the system being idle (P0)

Figure 3: Expected service cost E (SC) (#) against level of service (Accountants).

Figure 4: A graph of expected waiting cost (WC) (#) against level of service (Accountants).

Figure 5: A graph of expected Total cost E(TC) (#)against level of service (Accountants).
At the Cash Deposit unit of GTB Ahmadu Bello way Jos Branch, there are a total of four Accountants (servers) that provide service to the customers.
They take 20 minutes lunch break. Accordingly, the system capacity, N = 200 customers with inter-arrival time T = 927 minutes, the time taken by 200 customers to be served
S =1426minutes.
The inter-arrival rate
? = 0.21575 customer per minute, while the service rate is given by
Lq = 0.0503 customer per minute. Although the application to banking system was not found in literature but these (4) days experience illustrate that queuing theory may be used accurately to model cash deposit unit system in a large banking setting.
In scenario 1, where the arrival rate (lambda effective) = 0.21575customers; number of servers are 4 and service rate (Mu) is 0.14025 customers. The system performance measures are as follows:
Lq = 0.0503 .
This implies there are 0.0503 customers waiting to be served by an Accountant. 0.2333 Wq = ; meaning a customer spend 0.2333 minute (13.998 sec), on the queue waiting to be attended to by an accountant. 7.3634 Ws = ; This implies a customer spent 7.3634 minutes (441.804 sec) in the system and a total cost of #393.5077 was spent in a minute. The time spent in the queue from four Accountants (scenario1) to five Accountants at the cash deposit unit (scenario 2) is very appreciable. The average number in the queue (Wq) drops from 0.0503 with four Accountants to 0.0099 with five Accountants. Similarly, average time in the queue (Wq) drops from 0.2333 minute (13.998 sec) to 00.0458 minute (2.7468 sec) respectively. The average server utilization factor is 38.45% in scenario 1 with four Accountants and 30.76% in scenario 2 with five Accountants. Also the total expected system cost drop from #393.5077 with four Accountants to #387.5012 with five Accountants. This means that customers spend less time in the queue and the Total Expected Cost is quite appreciable.
The change in time spent in the queue from five Accountants (scenario 2) to six Accountants at the cash deposit unit (scenario 3) is far better but has its consequences. The average number in the queue (Lq) drops from 0.0099 to 0.0018 with six Accountants. Similarly average time in the queue (Wq) drops from 0.0458 minute (2.75 sec.) to 0.0085 minutes (0.51 sec.). The server utilization factor is 30.76% in scenario 2 with five Accountants and 25.64% for scenario 3 with six Accountants which is quite low compare to scenario 1. Also the total expected system cost rose from #387.5012 with five Accountants to #389.0914 with six Accountants. This is in line with the findings of which established that in a waiting line system, managers must decide what level of service to offer. A low level of service may be inexpensive, at least in the short run, but may incur high customer dissatisfaction costs, such as loss of future business. A high level of service on the other hand will cost more to provide and will result in lower dissatisfaction costs. When considering improvements in services, the bank managers weigh the cost of providing a given level of service against the potential costs from keeping customers waiting. The goal of queuing is therefore to minimize the total cost of the system.
The graphs show that optimal server level at the Guaranty Trust Bank (GTB) Ahmadu Bello Way, Jos branch is achieved when the number of servers (Accountants) is 5 with a minimum Total Cost of #387.5012 per minute as against the present server level of 4 Accountants at the cash deposit unit which have high cost of #393.5077 per minute. It is worthy to note that the customersÃÆâÃâââ¬Ãââ⢠average waiting time and congestion in the system is also less at this optimal server level.
Looking at the results of this analysis, one can profess that queuing theory is a mathematical powerful approach to decongesting a system and proffer innovative solutions at an optimal service level. It is in this light that this study recommends that the management of Guaranty Trust Bank (GTB) Ahmadu Bello Way, Jos branch needs to employ one more Accountant to make a total of five Accountants or better still, workers that are less busy can be drafted to serve as Accountants at the cash deposit post since the waiting time is quite much. There is still room for improvement to reduce queue to zero level at the Bank cash deposit unit.
Also, the queuing model used for this study and the software (TORA) are quite understandable and flexible. This can be used to model different banking units such as customer care unit, withdrawal unit, ATM cash withdrawal etc. In addition, the model can also be applied to manufacturing facilities and other service organizations such as filling stations, restaurants, and telecommunication.