ISSN ONLINE(2278-8875) PRINT (2320-3765)
ISSN ONLINE(2278-8875) PRINT (2320-3765)
U. Parul Anand1, P.Dharmeshkumar2
|
| Related article at Pubmed, Scholar Google |
Visit for more related articles at International Journal of Advanced Research in Electrical, Electronics and Instrumentation Engineering
This Paper presents voltage stability assessment through P-V curve and bus voltage sensitivity factor. It addresses a measure of how close the system is to voltage instability? Active power margin is used to measure the distance to instability. Continuation power flow is used to obtain P-V curve of power system. Continuation power flow starting with initial operating point and increasing load to the maximum loading point. Voltage stability index and weakest bus is found from the result. A power system analysis tool is used to run continuation power flow.
Keywords |
| Voltage stability, continuation power flow, predictor –corrector step, maximum loading point, Bus sensitivity factor. |
INTRODUCTION |
| In general terms, voltage stability is defined as the ability of a power system to maintain steady voltages at all the buses in the system after being subjected to a disturbance from a given initial operating condition. It depends on the ability to maintain/restore equilibrium between load demand and load supply from the power system. Instability that may result appears in the form of a progressive fall or rise of voltages of some buses [1], [7], [8].Voltage stability problems mainly occur when the system is heavily stressed beyond its capability. While the disturbance leading to voltage collapse may be initiated by a variety of causes, the main problem is the inherent weakness in the power system. [2] Many voltage stability indices are based on the eigen value analysis or singular value decomposition of the system power flow Jacobian matrix [3], [4]. The prominent methods in voltage stability analysis are those that find system load margin, Especially when system contingency is considered P--V curve and Q-V curve are most considerable method to find active power margin and reactive power margin. Network configurations and load distributions can also reflect using PV curve. The linear approach between the generator reactive power reserves and voltage stability margin is related to the system PV curves versus nodal VQ curves. Using this relationship, a systematic and practical method for determining the online voltage stability margin is proposed in [5]. |
| In most of the research work the voltage stability has been considered as static phenomenon. This is due to slow variation of voltage over along time observed in most of the incident until it reaches to the maximum loading point and then it decreases rapidly to the voltage collapse. Static voltage stability can be analysized by using bifurcation theory. There are different types of bifurcation theory, in which saddle node bifurcation is used for static voltage stability analysis.[6] This paper is concentrated on the steady state aspects of voltage stability. Indeed, numerous authors have proposed voltage stability indexes based on repeated power flow analysis. In this generally conventional load flow is used. The main difficulty in this method is that jacobian of NR power flow become singular at voltage stability limit (critical point) .A power flow solution near the critical point prone to divergences and error. Singularity in the Jacobian can be avoided by slightly reformulating the power flow equations and applying a locally parameterized continuation technique. During the resulting âÃâ¬Ãâ¢continuation power flowâÃâ¬Ãâ, the reformulated set of equations remains well-conditioned so that divergence and error due to a singular Jacobian are not encountered. |
CONTINUATION POWER FLOW |
| The general principle behind the continuation power flow is simple. It employs a predictor-corrector scheme to find a solution path. It adopts locally parameterized continuation technique. It includes load parameter, step length for load parameter and state variable. |
A Locally Parameterized Continuation |
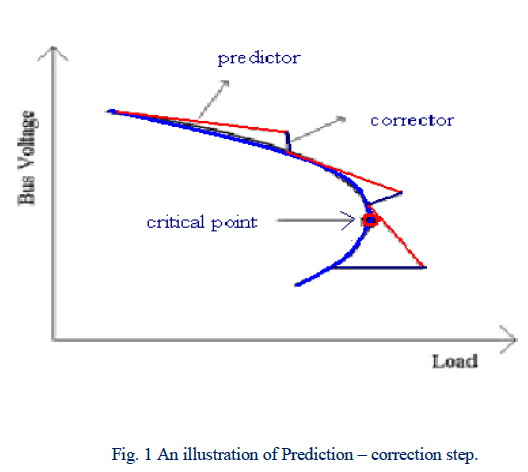
| A parameterization is a mathematical means of identifying each solution on the branch, a kind of measure along the branch. When we say "branch," we refer to a curve consisting of points joined together in n + 1 dimensional space that are solutions of the nonlinear equations F(x , λ) = 0 (1). This equation is obtained by introducing a load parameter λ into the original system of nonlinear equations, F(x) = 0. For a range of values of λ. The solution of Eq.1 along a given path can be found for each value of λ, although problems arise when a solution does not exist for maximum possible λ value. At this point, one of the state variables, X can be used effectively as the parameter to be varied, choice of which is determined locally at each continuation step. Thus, the method is designated as the locally parameterized continuation. In summary, local parameterization allows not only the added load parameter, but also the state variables to be used as continuation parameters. Continuation power flow finds successive load flow solutions according to a load scenario. From a known base solution, a tangent predictor is used so as to estimate next solution for a specified pattern of load increase. The corrector step then determines the exact solution using Newton-Raphson technique employed by a conventional power flow. After that a new prediction is made for a specified increase in load based upon the new tangent vector. Then corrector step is applied. This process goes until critical point is reached. The critical point is the point where the tangent vector is zero. The illustration of predictor-corrector scheme is depicted in Fig 1. |
 |
B Mathematical Reformulation of power flow equation. [1] |
| To find successive load flow solution using continuation power flow, the load flow equation is reformulated by inserting load parameter λ. So, locally parameterization technique can apply. Using constant power load, The general form of power flow equation is: |
 |
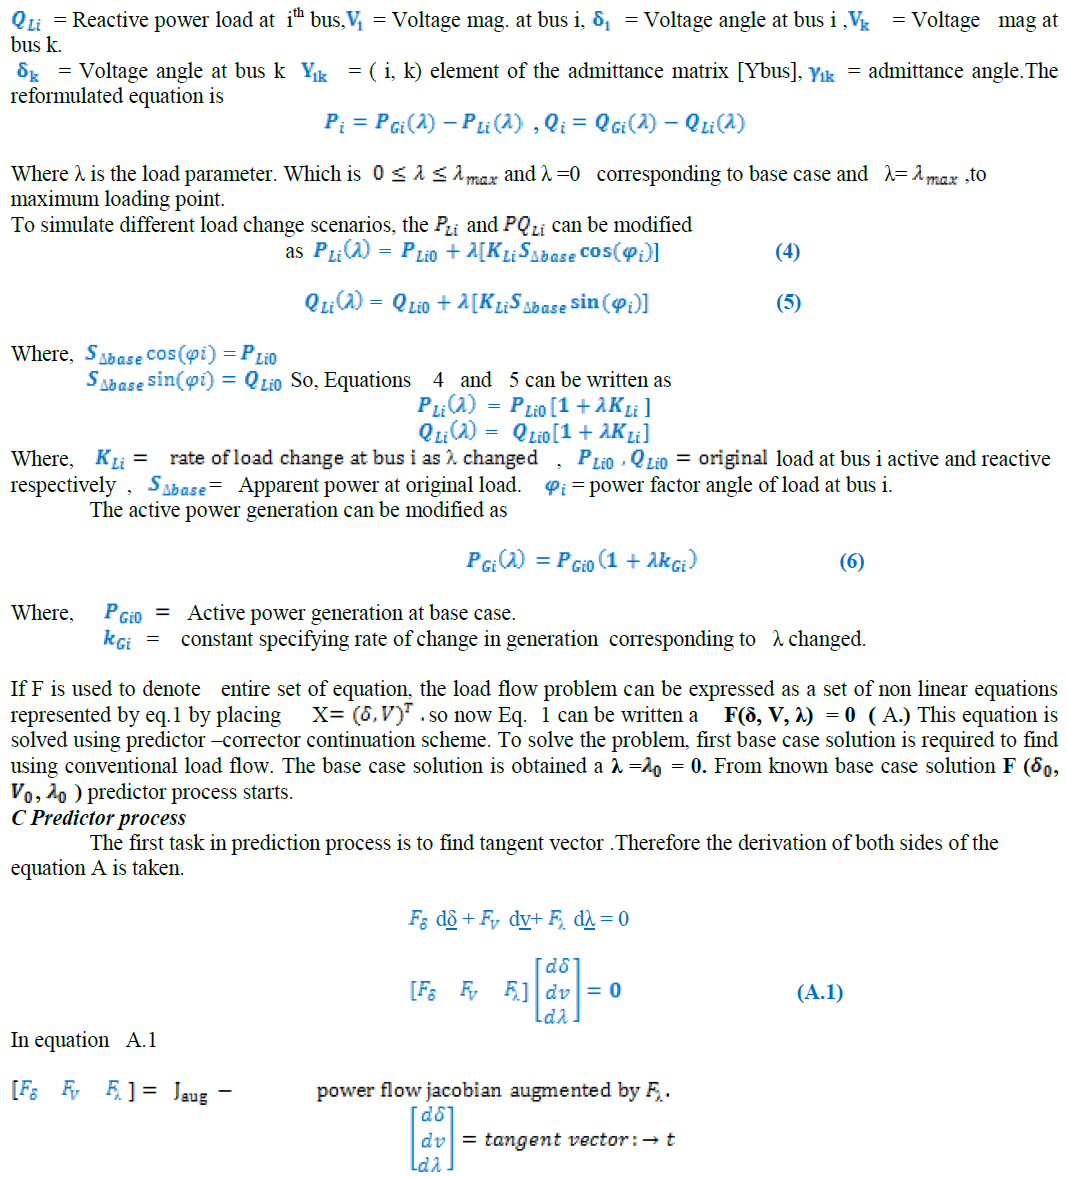 |
| In order to solve Equation 6, one more equation is needed since an unknown variable is added to load flow equations. This can be satisfied by setting one of the tangent vector components to +1 or -1 which is also called continuation parameter. Setting one of the tangent vector components +1 or -1 imposes a non-zero value on the tangent vector and makes Jacobian non singular at the critical point. As a result equation A.1 becomes |
 |
| Where s the appropriate row vector with all elements equal to zero except the kth element equals 1. At first step λ is chosen as the continuation parameter. As the process continues, the state variable with the greatest rate of change is selected as continuation parameter due to nature of parameterization. By solving Equation A.2, the tangent vector can be found. Then, the prediction can be made as follows: |
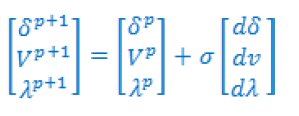 |
| Where the subscript âÃâ¬Ãâ¢p+1âÃâ¬Ãâ denotes the next predicted solution. The step size σ is chosen so that the predicted solution is within the radius of convergence of the corrector. If it is not satisfied, a smaller step size is chosen |
D Corrector process |
| In correction process, the predicted solution is corrected by using local parameterization. The original set of equation is increased by one equation that specifies the value of state variable chosen and it results in: |
 |
| Where is the state variable chosen as continuation parameter and η is the predicted value of this state variable. Equation A.4 can be solved by using a slightly modified Newton-Raphson power flow method. |
E Parameterization |
| Selection of continuation parameter is important in continuation power flow. Continuation parameter is the state variable with the greatest rate of change. Initially, is selected as continuation parameter since at first steps there are small changes in bus voltages and angles due to light load. When the load increases after a few steps the solution approaches the critical point and the rate of change of bus voltages and angles increase. Therefore, selection of continuation parameter is checked after each corrector step. The variable with the largest change is chosen as continuation parameter. If the parameter is increasing +1 is used, if it is decreasing -1 is used in the tangent vector in Equation A.2. |
F Critical point sensing |
| The continuation power flow is stopped when critical point is reached as it is seen in the flow chart. Critical point is the point where the loading has maximum value. After this point it starts to decrease. The tangent component of λ is zero at the critical point and negative beyond this point. Therefore, the sign of dλ shows whether the critical point is reached or not. |
APPLICATION OF CONTINUATION POWER FLOW TO IEEE-14 BUS SYSTEM. |
| Here continuation power flow method is applied to following two sample systems using matlab based power system analysis tools.IEEE-14 bus system consists of 3 generators, 20 transmission lines and 11 loads. Here buses are renumbered .So, in this system bus no.1 is slack bus and bus no. 2 to bus no. 5 are PV buses, bus no. 6 to14 are PQ buses. IEEE-14 bus test system shown in Fig.2 The continuation power flow is run with two different conditions. 1) Without considering any Generator reactive power limits. 2) With considering Generator reactive power limits. CPF results are shown in Table I and II and P-V curve of the system with and without reactive power limit constrains is shown in Fig.3 and Fig. 4.Continuation power flow is run up to bifurcation point, that means when maximum loading point reaches power flow will stop. Here distributed slack bus is used so all transmission losses distributed among all buses. At base case loading point lambda is taken 1 and load increasing at each bus proposional to base load. |
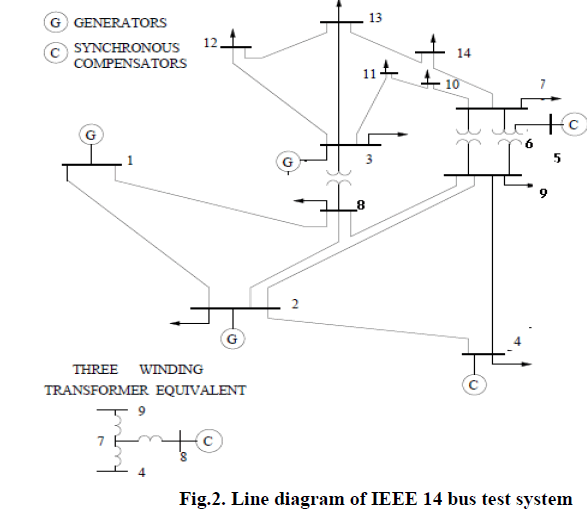 |
| Fig.2 shows single line diagram of IEEE 14 bus test system. |
RESULT AND DISCUSSION |
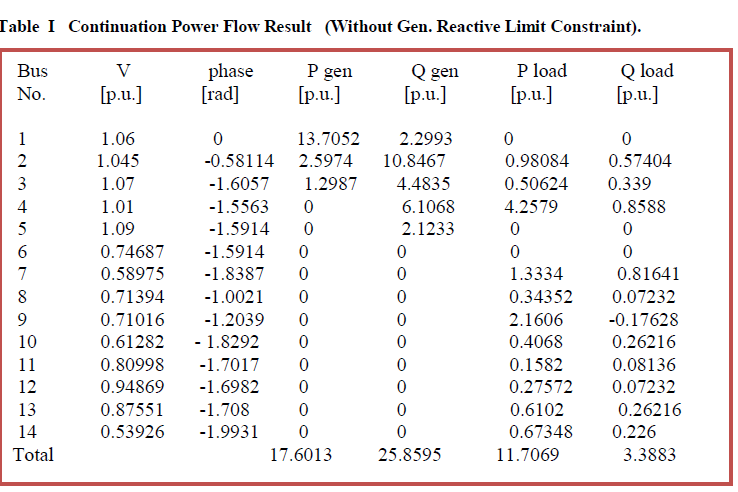 |
| Table I shows voltage , phase angle, active power generation and reactive power generation ,active power load and reactive power load at each bus without generator reactive power limits. |
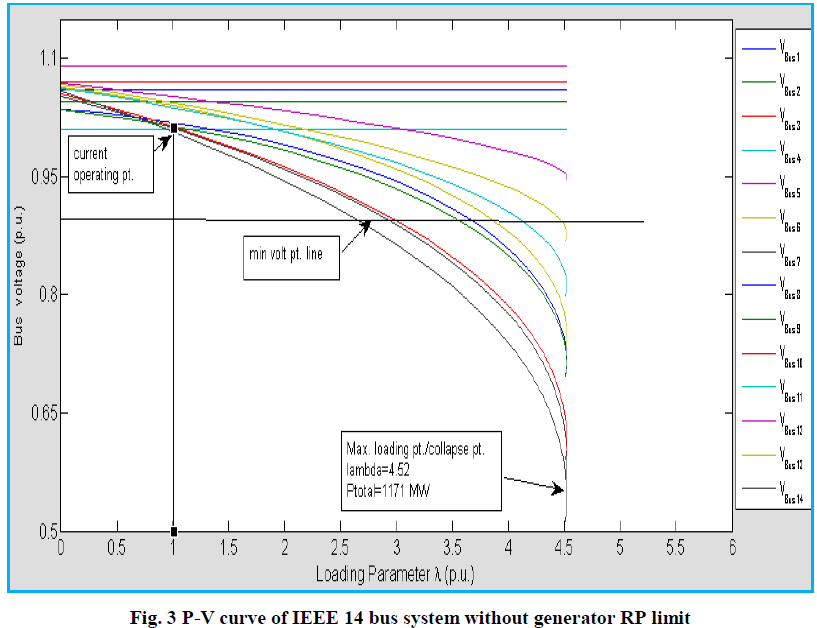 |
| Fig.3 shows variation of bus voltage with increasing loading factor on the system with generator reactive power limits constraints. |
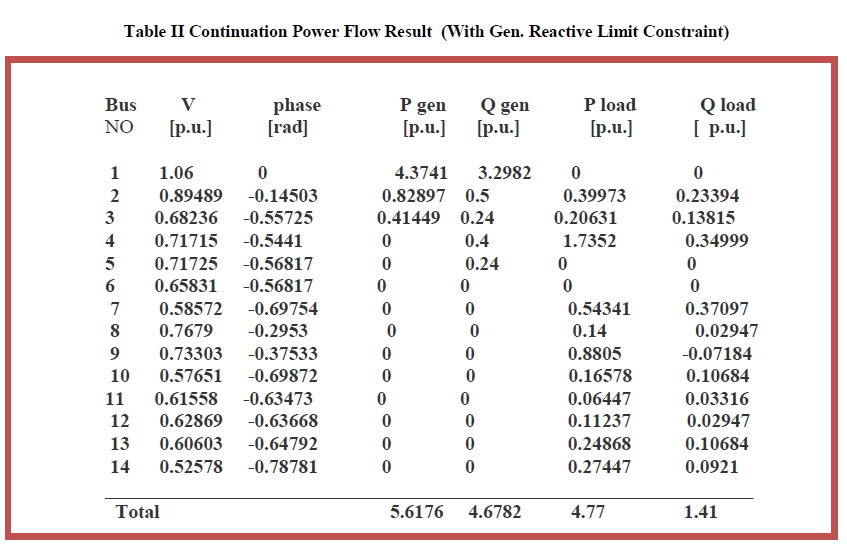 |
| Table II shows voltage , phase angle, active power generation and reactive power generation ,active power load and reactive power load at each bus with generator reactive power limits. |
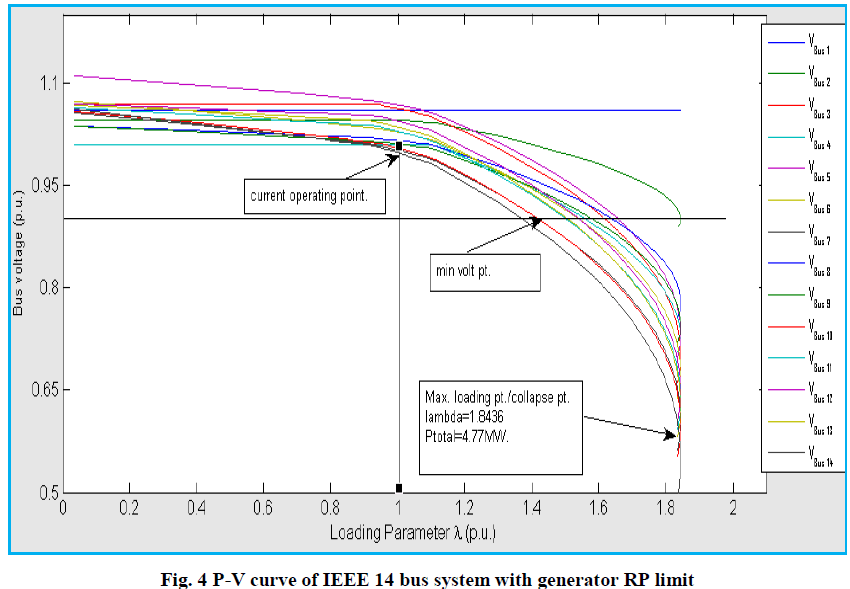 |
| Fig.4 shows variation of bus voltage with increasing loading factor on the system with generator reactive power limits constraints. |
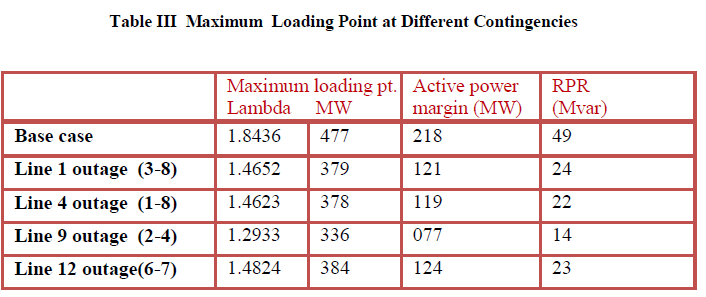 |
| Table III shows maximum loading point and maximum active load on the system ,active power margin in MW, reactive power margin in MVAR for base case and different contingencies cases. |
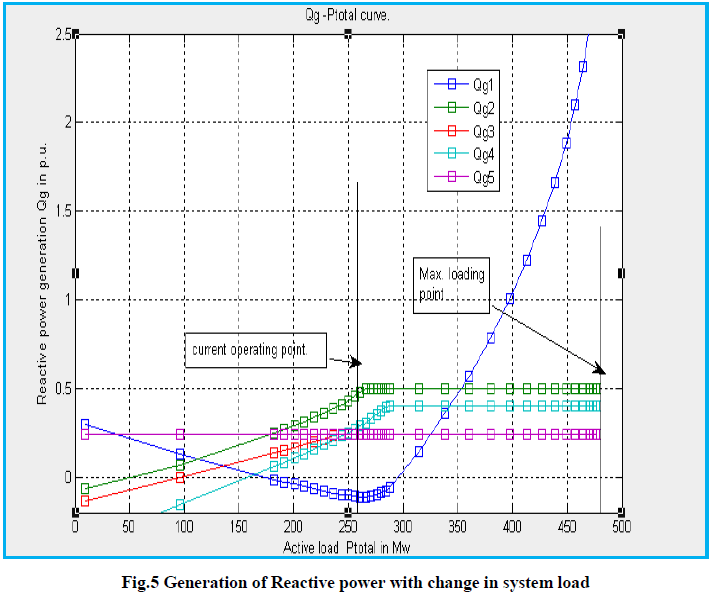 |
| Fig.5 shows generation of reactive power when active power load on the system increased. |
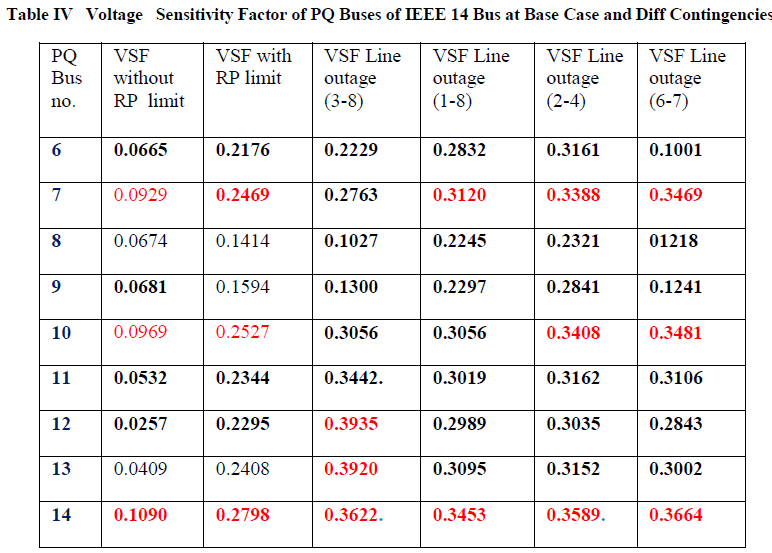 |
| Table IV shows Bus voltage sensitivity factor for base case and for different types of contingencies cases Red colour digit indicates that these buses are most three weakest buses of the system for the particular cases. |
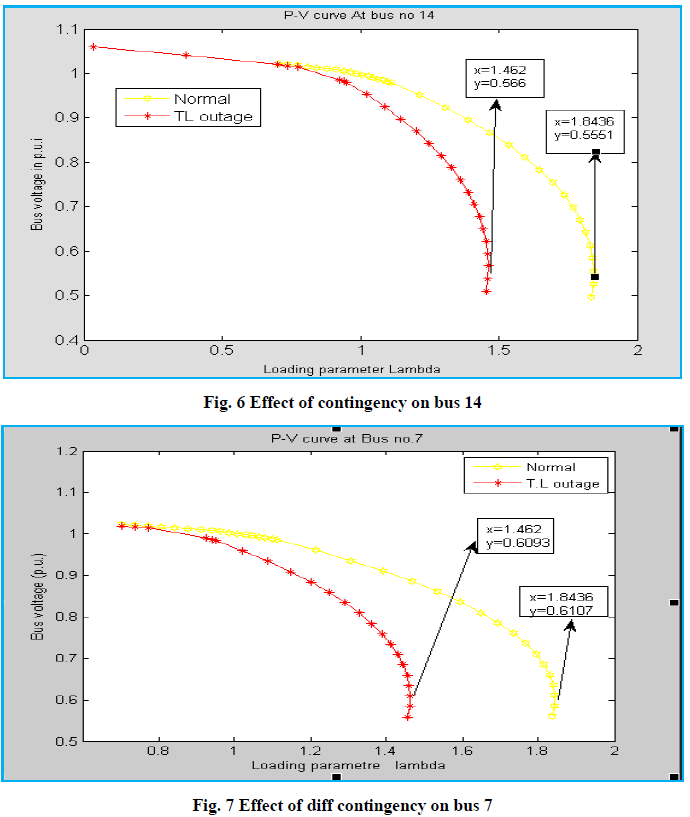 |
| Fig. 6, 7 shows effect of contingency of line outage on bus no 7 and bus no. 14.. |
| In case of IEEE 14 Bus test system Bus no.1, 5 and 6 have no load, so after continuation power flow, load at these buses is zero, but with increasing system load these buses approaches voltage collapse point. When reactive power constraint is not considered, voltages at PV buses are not affected. Maximum reactive power is supplied by generator at bus 2. When Reactive power constraint is considered, only slack bus generator supplies reactive power after all generator reaches its maximum reactive power limits and voltage at PV buses reduced with increased system load. Active power generation of each generator is also proposional to its base load generation. The power factor at each bus remains as same as base load condition. |
| From the result Table I and II it can see that maximum loading point λ is 4.52.i.e maximum active power can transfer is 11.71 ( p.u), when generator reactive power limit constraint is not considered. When generator reactive power constraint is considered the Gen 2,3,4,5 reaches its Qmax at different loading point as shown in Fig.5 and maximum loading point λ is reduced to 1.8436 or maximum active power load is 4.77p.u. At collapse point only slack Generator supplies the reactive power. |
| At current operating point, generator at bus 3 and condenser at bus 5 reach at their Qmax. limit. From Fig 5 curve we can know about changes in gen reactive power with change in system load. Effect of N-1 contingency (line outage.) on maximum loading point of system has analyzed by CPF. Active power margin and reactive reserve voltage stability margin of system w.r.t voltage collapse point is shown in table III. When min voltage limit is considered, voltage violation at different loading point for all the buses can be observed in Fig. 3 and Fig 4.When we examined Fig. 3 and Fig 4 most reduction in bus voltage at 14th no bus. This is the weakest bus of the system. It is decided by bus voltage sensitivity factor. This is same as finding the bus with the greatest ratio | / |value. |
| The ratio | / | is taken as bus voltage sensitivity factor where and are respectively total active load change and per unit voltage change in bus in the system. Since the denominators in this ratio are the same for all buses, the differential change in bus voltages can be taken as voltage stability sensitivity factor. Table.4 shows the bus voltage sensitivity factor. From table 4 rank of most three weakest buses according to VSF is 14, 10 and 7, while bus no. 8 and 9 have lowest VSF. This result helps to place reactive power sources to improve voltage stability. When any contingency like line outage 4 occurs in the system affects bus no 14 and bus no 7 is shown in Fig. 6 and Fig.7 respectively. It can see voltage collapse point reduced with contingency. It is 1.462 times current operating point. In case of contingency line outage 9 (2-4) , maximum loading point is 1.29 times base load point. Thus system approaches near to voltage collapse. It can also say that available transfer capacity of the system is 218 Mw more than current operating point. Maximum loading point lambda is reduced for contingency n-1, here is one transmission line outage. Here line outage between bus no.1and bus no.8 is considered to examine the effect. It can observe from Fig. 6 and 7 when one transmission line is opened, system maximum loading parameter lambda is reduced from 1.8436 to 1.462. Voltage at that point is 0.6107 p.u. for normal condition and 0.6093 p.u for TL outage condition for bus no.7 and voltage is 0.551p.u. for normal condition and 0.566 p.u. for TL outage condition for bus no.14 at maximum loading point. These results say that VSF is different for different contingencies and Rank of weakest bus is also changed. Table IV shows VSF of PQ buses for contingency of one line outage. At the time of contingency case line outage (3-8) rank of most three weakest buses is changed, while for other contingency it remains same .Bus no. 14 is most weakest bus in all contingencies cases. |
CONCLUSION |
| Above all results shows that voltage stability margin can be found easily by CPF. And P-V curve and max. loading point can access. Only collapse point is not enough for voltage stability assessment .So, using tangent vector sensitivity analysis can be done. From voltage sensitivity factor weakest bus can identify. The Weakest bus identification is done by without excessive calculation. Placement of reactive power sources such as Fact devices, capacitor bank is known. This result is same accurate as to find Bus participation factor using QV modal analysis. This CPF method is more accurate and simple for Voltage stability analysis. |
References |
|