Keywords
|
| Breast cancer, Mammography, Genetic Algorithm and Adaptive Neuro Fuzzy Inference System |
INTRODUCTION
|
| Breast cancer is the primary cause of death in women over 40 years old in the world [1]. Its early detection can significantly increase the percentage of survival of the patients [2]. It can be detected by analyzing microcalcifications, i.e., small objects located on the breast tissue. These can be viewed by a radiologist on digital mammograms. Depending on the size and type of these elements, it is possible for a radiologist to diagnose whether or not a tumour is malignant without the need for a surgical procedure. One microcalcification feature that can be used to distinguish the type of tumour is whether it has smooth or rugged borders. Defining the nature of microcalcification borders can help radiologists to classify these elements into the types defined [3]. |
| This would help radiologists to further classify the tumour being analyzed. Microcalcifications are high-frequency components on digital images. A transform that deals with frequency components can be used in trying to detect these objects on the breast image. We used the wavelet transform on the proposed work to detect these elements and to classify the nature of their borders, being smooth or rugged.The wavelet transform is a mathematical tool used to analyse and process information regarding frequency components on an input signal. It uses two analyzing functions: the scaling function and the wavelet function. These functions are applied through the signal by stretching and translation operations [7].If the input signal is an image, the result of this operation is composed of four images: one composed of low frequencies of the input image and the other three containing high frequencies of the original image—one with horizontal, one with vertical, and the last one with diagonal details. Since microcalcification is located in digital mammograms are high-frequency components, the wavelet transform issued to detect and classify them. Several researchers have introduced different approaches for classifying the mammogram images. A histogram intersection based image classification was proposed in [10]. Initially they used the bag-of-words model for image classification for capturing the texture information. A normalized histogram intersection with theK-nearest neighbourhood classifier was applied. The classification accuracy depends on the normalization of the histogram. |
| Reference [11] presents mammogram image classification based on rough set theory in conjunction with statistical feature extraction techniques. The features were derived from the gray level co-occurrencematrix, these features were normalized and the rough set dependency rules are generated from the attribute vector. The generated rules were passed to the classifier for the classification purpose. |
| Reference [12] presents anew approach for the parenchymal pattern classification in which texture models are used to capture the mammography appearance within the area of the breast. Parenchymal density patterns are modelled as the statistical distribution of clustered, invariant filter responses in low dimensional space. Fractal can be used to classify and distinguish various types of cells. Shapes of fractal objects keep invariant under successive magnifying or shrinking the objects. Hence, fractal geometry can be applied to overcome the scale problem of texture. Fractal dimension can be defined in connection with real world data and can be measured. The curve, surface and volumes are complex objects for which ordinary measurements become limited because of their physical properties. Different techniques have been proposed to measure the degree of complexity by evaluating how fast the length, surface or volume increases with respect to smaller and smaller scales. |
CUBIC IMAGE INTERPOLATION
|
| The technique of bicubic interpolation produces less blurring of edges and other distortion artifacts than bilinear interpolation, but is more computationally demanding. Bicubic interpolation involves fitting a series of cubic polynomials to the brightness values contained in a 4 × 4 array of pixels surrounding the calculated address. The cubic convolution interpolation kernel is composed of piecewise cubic polynomials defined on the subintervals (- 2,- l), (- 1, 0), (0, l), and (1, 2). Outside the interval (- 2, 2), the interpolation kernel is zero, As a consequence of this condition, the number of data samples used to evaluate the interpolation function in is reduced to four. The interpolation kernel must be symmetric. Coupled with the previous condition, this means K1that must have the form |
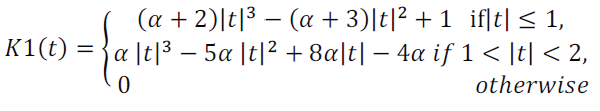 |
| Where α is a free parameter. This function is derived by finding a piecewise cubic polynomial with knots at the integers that is required to be symmetric, C1 continuous, and have support in −2<t<2. These conditions leave one remaining degree of freedom represented by α. For any value of α, K1 has external points at t = 0 and ±4/3.Additional knowledge about the shape of the desired result may be imposed upon to equation (1) yield bounds on the value of a. The heuristics applied to derive the kernel are motivated fromproperties of the ideal reconstruction filter, the sinc function. |
CONTRAST LIMITED ADAPTIVE HISTOGRAM EQUALIZATION (CLAHE)
|
| Each time an image is acquired, window and level parameters must be adjusted to maximize contrast and structure visibility. This must be done before the image is saved in any other format than the generic format of the acquisition software.For the moment, very little post-processing in addition to window-level is applied to the image after its acquisition. This is due in part to the good quality of the image without processing, but also because of the short experience and tools we have working with 16 bit images. |
| CLAHE seems a good algorithm to obtain a good looking image directly from a raw Hospital Information System (HIS) image, without window and level adjustment. This is one possibility to automatically display an image without user intervention. Further investigation of this approach is necessary. CLAHE was originally developed for medical imaging and has proven to be successful for enhancement of low-contrast images such as portal films. The CLAHE algorithm partitions the images into contextual regions and applies the histogram equalization to each one. This evens out the distribution of used grey values and thus makes hidden features of the image more visible. The full grey spectrum is used to express the image. Contrast Limited Adaptive Histogram Equalization, CLAHE, is an improved version of AHE, or Adaptive Histogram Equalization. |
| Both overcome the limitations of standard histogram equalization.A variety of adaptive contrast-limited histogram equalization techniques (CLAHE) are provided. Sharp field edges can be maintained by selective enhancement within the field boundaries. Selective enhancement is accomplished by first detecting the field edge in a portal image and then only processing those regions of the image that lie inside the field edge. Noise can be reduced while maintaining the high spatial frequency content of the image by applying a combination of CLAHE, median filtration and edge sharpening. This technique known as Sequential processing can be recorded into a user macro for repeat application at any time. A variation of the contrast limited technique called adaptive histogram clip (AHC) can also be applied. AHC automatically adjusts clipping level and moderates over enhancement of background regions of portal images. |
ADAPTIVE NEURO FUZZY INFERENCE SYSTEMS
|
| Adaptive Neuro Fuzzy Inference Systems combines the learning capabilities of neural networks with the approximate reasoning of fuzzy inference algorithms. ANFIS uses a hybrid learning algorithm to identify the membership function parameters of Sugeno typefuzzy inference systems. The aim is to develop ANFIS-based learning models to classify normal and abnormal images from mammogram image to detect breast cancer. An adaptive neural network is a network structure consisting of five layers and a number of nodes connected through directional links. The first layer executes a fuzzificationprocess, second layer executes the fuzzy AND of the antecedent part of the fuzzy rules, the third layer normalizes the fuzzy membership functions, the fourth layer executes the consequent part of the fuzzy rules and finally the last layer computes the output of the fuzzy system by summing up the outputs of the fourth layer [6].Each node is characterized by a node function with fixed or adjustable parameters. Learning or training phase of a neural network is a process to determine parameter values to sufficiently fit the training data. |
| Based on this observation, a hybrid-learning rule is employed here, which combines the gradient descent and the least-squares method to find a feasible set of antecedent and consequent parameters. In order to obtain a set of rules and avoid the problems inherent in grid partitioning based clustering techniques, subtractiveclustering is applied. This technique is employed since it allowed a scatter input-output space partitioning .The subtractive clustering is one pass algorithm for estimating the number of clusters and the cluster centres through the training data. |
DISCRETE HAAR WAVELET TRANSFORMATION AND FEATURE EXTRACTION
|
| An outstanding property of the Haar functions is that except function haar (0, t), the i–thHaar function can be generated by the restriction of the (j − 1)–th function to be half of the interval where it is different from zero, by multiplication with p2 and scaling over the interval [0, 1]. These properties give considerable interest of the Haarfunction, since they closely relate them to the wavelet theory. In this setting, the first two Haar functions are called the global functions, while all the others are denoted as the local functions. Hence, the Haar function, which is an odd rectangular pulse pair, is the simplest and oldest wavelet. The motivation for using the discrete wavelet transform is to obtain information that is more discriminating by providing a different resolution at different parts of the time–frequency plane. The wavelet transforms allow the partitioning of the time-frequency domain into nonuniform tiles in connection with the time–spectral contents of the signal. The wavelet methods are strongly connected with classical basis of the Haar functions; scaling and dilation of a basic wavelet can generate the basis Haar functions. Let Ãâñ;R R, the Haar wavelet function is defined by the formula |
 |
| The aim of the feature extraction step is to feed the classifier with relevant features that must be chosen to maximize interclass variance. The choice of suitable feature space is often problem dependent and features Table.1 are therefore usually adapted to the image content. For instance the mammogram images can be described by frequency analysis using discrete haar wavelet transform. |
EXPERIMENTAL RESULTS
|
| The Table.1shows that the feature extracted values from the mammogram image. It consist of the GLCM features 1) autocorrelation 2) Correlation 3) Homogeneity 4) Maximum Probability 5) Difference variance 6) Inverse difference moment normalized of the sample 10 mammogram images from the MIAS database [8]. |
| The above figure consists of 20 images in X-axis and 2 outputs (normal and abnormal) in Y-axis. The coincidence of the two symbols, training data and fuzzy inference system shows that the exact classification of data. The average error in the training and testing of the proposed neurofuzzy System is0.000102828 and 0.00025222 for 2epochs. |
CONCLUSION
|
| This paper presented a new application of ANFIS for classification of the Brest cancer. The presented ANFIS model combined the neural network adaptive capabilities and the fuzzy logic qualitative approach. Some conclusions concerning the saliency of features on classification of the Brest cancer were obtained through analysis of the ANFIS. The classification results and statistical Measures were used for evaluating the ANFIS while evaluating the system with the sample of 10 images, the average time complexity Table.2 is seems to be below 0.5second. We therefore have concluded that the proposed ANFIS model can be used in classifying the breast cancer by taking into consideration the classification rates. In future it will consider other statistical models for feature extraction in order to improve the classification rate. |
Tables at a glance
|
 |
|
| Table 1 |
Table 2 |
|
Figures at a glance
|
 |
 |
 |
 |
| Figure 1 |
Figure 2 |
Figure 3 |
Figure 4 |
 |
 |
 |
| Figure 5 |
Figure 6 |
Figure 7 |
|
References
|
- Jyh-Shing Roger Jang,” ANFIS: Adaptive-Network-Based Fuzzy Inference System,” IEEE Transactions on Systems, man, andCybernetics,vol. 23, no. 3, mayijune 1993.
- C. B. R. Ferreira and D. L. Borges, ‘‘Analysis of mammogram classification using a wavelet transform decomposition,’’ PatternRecognit. Lett.,vol. 24, no. 7, pp. 973–982, 2003.
- T. Arodz’, M. Kurdziel, T. J. Popiela, E. O. D. Sevre, and D. A. Yuen,‘‘Detection of clustered microcalcifications in small field digitalmammography,’’Comput. Methods Programs Biomed., vol. 81, no. 1, pp. 56–65, 2006.
- M. Le Gall, G. Chavanne, and D. Pellier, ‘‘Valeurdiagnostique des microcalcificationsgroupe´esde´couvertes par mammographies,’’Bull. Cancer, vol. 71,no. 1, pp. 57–64, 1984.
- Haarlick.R.M,”Statistical and structural approachesto texture”, Proceedings of the IEEE, vol.67, pp.786-804,1979.
- J.S.R Jang, C.T Sun, E. Mizutani, “Neuro-fuzzy and soft computing: approach to learning and machine intelligence,” London: prentice-Hall international, vol.8, no.8. 1997
- P. Addison, “The Illustrated Wavelet Transform Handbook”, Bristol, U.K.: IOP Publishing, 2002.
- “MIAS Mini Mammographic Database”,http://skye.icr.ac.uk/miasdb/miasdb.html
- G George Wolberg. Digital Image Warping. IEEE Computer Society Press, Los Alamitos,CA, USA, 1994.
- erkang, c., x. nianhua, l. haibin, p. r. bakic, a. d. a. maidme n t, v. megalooikonomo u. Mammographic Image Classification UsingHistogram Intersection. – In:IEEE Proc. ISBI’10, 2010, 197-200
- Hassanien, E. A., M. H. Jafar Ali. Rough Set Approach for Classification of Breast CancerMammogram Images. – In: Int.Workshop onFuzzy and App., 2003, 224-231.
- Petroudi, S., T. Kadir, M. Brady. Automatic Classification of MammographicParenchymal Patterns: A Statistical Approach. – In: IEEEProc. E MBS, 2003, 798-801.
|