Breast cancer is one of the leading cancers for women when compared to all other cancers. It is the second most common cause of cancer death in women. Breast cancer risk in India revealed that 1 in 28 women develop breast cancer during her lifetime. This is higher in urban areas being 1 in 22 in a lifetime compared to rural areas where this risk is relatively much lower being 1 in 60 women developing breast cancer in their lifetime. In India the average age of the high risk group is 43-46 years unlike in the west where women aged 53-57 years are more prone to breast cancer. The aim of this paper is to investigate the performance of different classification techniques. The data breast cancer data with a total 683 rows and 10 columns will be used to test, by using classification accuracy. We analyse the breast Cancer data available from the Wisconsin dataset from UCI machine learning with the aim of developing accurate prediction models for breast cancer using data mining techniques. In this experiment, we compare three classification techniques in Weka software and comparison results show that Sequential Minimal Optimization (SMO) has higher prediction accuracy i.e. 96.2% than IBK and BF Tree methods.
Keywords |
| Breast cancer, Classification techniques, Sequential Minimal Optimization (SMO), IBK, BF Tree |
INTRODUCTION |
| Globally, the rising breast cancer incidence and mortality represent a significant and growing threat for the
developing world. Breast cancer is on the rise across developing nations, mainly due to the increase in life expectancy
and lifestyle changes such as women having fewer children, as well as hormonal intervention such as post-menopausal
hormonal therapy. In these regions, mortality rates are compounded by the later stage at which the disease is diagnosed,
as well as limited access to treatment, presenting a 'ticking time bomb' which health systems and policymakers in these
countries need to work hard to defuse. A recent study by the Asian Pacific Journal of Cancer Prevention indicated that
in the urban areas of Delhi, only 56% women were aware of breast cancer; among them, 51% knew about at least one
of the signs/symptoms, 53% were aware that breast cancer could be detected early, and only 35% mentioned about risk
factors. In rural Kashmir, only 4% of women had received any training or education about the purpose and technique of
breast self exam. |
| In the recent years the data from several domains including banking, retail, telecommunications and medical
diagnostics includes valuable information and knowledge which is often hidden. Processing these huge data and
retrieving meaningful information from it is a difficult task. Data Mining is a powerful tool for handling this task. Data
mining in breast cancer research has been one of the important research topics in medical science during the recent
years [1]. The classification of Breast Cancer data can be useful to predict the outcome of some diseases or discover the
genetic behavior of tumors. There are many techniques to predict and classification breast cancer pattern. This paper
empirically compares performance of three classical decision tree classifiers that are suitable for direct interpretability
of their results. |
| A. Breast Cancer (An overview) |
| Cancer begins in cells, the building blocks that make up all tissues and organs of the body, including the breast.
Normal cells in the breast and other parts of the body grow and divide to form new cells as they are needed. When
normal cells grow old or get damaged, they die, and new cells take their place. Sometimes, this process goes wrong.
New cells form when the body doesn‘t need them, and old or damaged cells don‘t die as they should. The buildup of
extra cells often forms a mass of tissue called a lump, growth, or tumor. |
| Tumors in the breast can be benign (not cancer) or malignant (cancer): |
Benign tumors: |
| Are usually not harmful |
| Rarely invade the tissues around them |
| Don‘t spread to other parts of the body |
| Can be removed and usually don‘t grow back |
Malignant tumors: |
| May be a threat to life |
| Can invade nearby organs and tissues (such as the chest wall) |
| Can spread to other parts of the body |
| Often can be removed but sometimes grow back |
| B. Risk Factors |
| Although risk factors don‘t tell everything. Many risk factors may increase chance of having breast cancer; it is not
yet known just how some of these risk factors cause cells to become cancer (American cancer society, 2002). |
| • Gender: Breast cancer is about 100 times more common in women than in men. |
| • Age: The chance of getting breast cancer goes up as a woman gets older. |
| • Genetic risk factors: Inherited changes (mutations) in certain genes like BRCA1 and BRCA2 can
increase the risk. |
| • Family history: Breast cancer risk is higher among women whose close blood relatives have this
disease. |
| • Personal history of breast cancer: A woman with cancer in one breast has a greater chance of
getting a new cancer in the other breast or in another part of the same breast. |
| • Race: Overall, white women are slightly more likely to get breast cancer than African-American
women. Asian, Hispanic, and Native-American women have a lower risk of getting and dying from
breast cancer. |
| • Dense breast tissue: Dense breast tissue means there is more gland tissue and less fatty tissue.
Women with denser breast tissue have a higher risk of breast cancer. |
| • Certain benign (not cancer) breast problems: Women who have certain benign
breast changes may have an increased risk of breast cancer. Some of these are more closely linked to
breast cancer risk than others. |
| • Lobular carcinoma in situ: In this condition, cells that look like cancer cells are in the milk-making
glands (lobules), but do not grow through the wall of the lobules and cannot spread to other parts of
the body. It is not a true cancer or pre-cancer, but having LCIS increases a woman's risk of getting
cancer in either breast later. |
| • Menstrual periods: Women who began having periods early (before age 12) or who went through
the change of life (menopause) after the age of 55 have a slightly increased risk of breast cancer. |
| • Breast radiation early in life: Women who have had radiation treatment to the chest area (as
treatment for another cancer) as a child or young adult have a greatly increased risk of breast cancer.
The risk from chest radiation is highest if the radiation were given during the teens, when the breasts
were still developing. |
| • Treatment with DES: Women who were given the drug DES (diethylstilbestrol) during pregnancy
have a slightly increased risk of getting breast cancer |
| • Not having children or having them later in life: Women who have not had children, or who had
their first child after age 30, have a slightly higher risk of breast cancer. Being pregnant many times
or pregnant when younger reduces breast cancer risk. |
| • Certain kinds of birth control: Studies have found that women who are using birth control pills or
an injectable form of birth control have a slightly greater risk of breast cancer than women who have
never used them. |
| • Using hormone therapy after menopause: Taking estrogen and progesterone after menopause
increases the risk of getting breast cancer. |
| • Not breastfeeding: Some studies have shown that breastfeeding slightly lowers breast cancer risk,
especially if breastfeeding lasts 1½ to 2 years. |
| • Alcohol: The use of alcohol is clearly linked to an increased risk of getting breast cancer. Even as
little as one drink a day can increase risk (Ranstam & Olsson, 1995). |
| • Being overweight or obese: Being overweight or obese after menopause is linked to a higher risk of
breast cancer (Pujol et. al. 1997). |
| The remainder of this paper is organized as follows: The background section investigates provides the reader with
the background information on breast cancer research, survivability analysis, commonly used prognosis factors and
previously published relevant literature., the method section explains the proposed classification techniques for
enhancing applied methods accuracy in diagnosing breast cancer patients, and the results section is followed by a
conclusion section. |
BACKGROUND |
| There is large number of papers about applying machine learning techniques for survivability analysis. Several
studies have been reported that they have focused on the importance of technique in the field of medical diagnosis.
These studies have applied different approaches to the given problem and achieved high classification accuracies. Here
are some examples: |
| Bittern et al. [2] used artificial neural network to predict the survivability for breast cancer patients. They tested their
approach on a limited data set, but their results show a good agreement with actual survival. |
| Vikas Chaurasia et al. [3] used RepTree, RBF Network and Simple Logistic to predict the survivability for breast
cancer patients. |
| Djebbari et al. [4] consider the effect of ensemble of machine learning techniques to predict the survival time in
breast cancer. Their technique shows better accuracy on their breast cancer data set comparing to previous results. |
| Liu Ya-Qin‘s [5] experimented on breast cancer data using C5 algorithm with bagging to predict breast cancer
survivability. |
| Tan AC‘s [6] used C4.5 decision tree, bagged decision tree on seven publicly available. |
| Bellaachi et al. [7] used naive bayes, decision tree and back-propagation neural network to predict the survivability
in breast cancer patients. Although they reached good results (about 90% accuracy), their results were not significant
due to the fact that they divided the data set to two groups; one for the patients who survived more than 5 years and the
other for those patients who died before 5 years. |
| Jinyan LiHuiqing Liu‘s [8] experimented on ovarian tumor data to diagnose cancer using C4.5 with and without
bagging. |
| Vikas Chaurasia et al. [9] used Naive Bayes, J48 Decision Tree and Bagging algorithm to predict the survivability
for Heart Diseases patients. |
| Vikas Chaurasia et al. [10] used CART (Classification and Regression Tree), ID3 (Iterative Dichotomized 3) and
decision table (DT) to predict the survivability for Heart Diseases patients. |
| Pan wen [11] conducted experiments on ECG data to identify abnormal high frequency electrocardiograph using
decision tree algorithm C4.5 with bagging. |
| My Chau Tu‘s [12] proposed the use of bagging with C4.5 algorithm, bagging with Naïve bayes algorithm to
diagnose the heart disease of a patient. |
| Dong-Sheng Cao‘s [13] proposed a new decision tree based ensemble method combined with feature selection
method backward elimination strategy with bagging to find the structure activity relationships in the area of
chemometrics related to pharmaceutical industry. |
| Dr. S.Vijayarani et al., [14] analyses the performance of different classification function techniques in data mining
for predicting the heart disease from the heart disease dataset. The classification function algorithms is used and tested
in this work. The performance factors used for analyzing the efficiency of algorithms are clustering accuracy and error
rate. The result illustrates shows LOGISTICS classification function efficiency is better than multilayer perception and
sequential minimal optimization. |
| Tsirogiannis‘s [15] applied bagging algorithm on medical databases using the classifiers neural networks, SVM‘S
and decision trees. Results exhibits improved accuracy of bagging than without bagging. |
| My Chau Tu‘s [16] used bagging algorithm to identify the warning signs of heart disease in patients and compared
the results of decision tree induction with and without bagging. |
| Kaewchinporn C‘s [17] presented a new classification algorithm TBWC combination of decision tree with bagging
and clustering. This algorithm is experimented on two medical datasets: cardiocography1, cardiocography2 and other
datasets not related to medical domain. |
| BS Harish et al., [18] presented various text representation schemes and compared different classifiers used to
classify text documents to the predefined classes. The existing methods are compared and contrasted based on various
parameters namely criteria used for classification. |
CLASSIFICATION TECHNIQUES |
| Building accurate and efficient classifiers for large databases is one of the essential tasks of data mining and machine
learning research. Usually, classification is a preliminary data analysis step for examining a set of cases to see if they
can be grouped based on ―similarity" to each other. The ultimate reason for doing classification is to increase
understanding of the domain or to improve predictions compared to unclassified data. Building effective classification
systems is one of the central tasks of data mining. Given a classification and a partial observation, one can always use
the classification to make a statistical estimate of the unobserved attribute values and as the departure point for
constructing new models, based on user's domain knowledge. Many different types of classification techniques have
been proposed in literature that includes Decision Trees, Naive- Bayesian methods, Sequential Minimal Optimization
(SMO), IBK, BF Tree etc. |
| A. Sequential Minimal Optimization (SMO) |
| Sequential Minimal Optimization (SMO) is a new algorithm for training Support Vector Machines (SVMs). The
Sequential Minimal Optimization (SMO) algorithm proposed by John Platt in 1998 [19], is a simple and fast method
for training a SVM. The main idea is derived from solving dual quadratic optimization problem by optimizing the
minimal subset including two elements at each iteration. The advantage of SMO is that it can be implemented simply
and analytically. Training a support vector machine requires the solution of a very large quadratic programming
optimization problem. SMO breaks this large quadratic programming problem into a series of smallest possible
quadratic programming problems. These small quadratic programming problems are solved analytically, which avoids
using a time-consuming numerical quadratic programming optimization as an inner loop. The amount of memory
required for SMO is linear in the training set size, which allows SMO to handle very large training sets. Because matrix
computation is avoided, SMO scales somewhere between linear and quadratic in the training set size for various test
problems, while the standard chunking SVM algorithm scales somewhere between linear and cubic in the training set
size. SMO‘s computation time is dominated by SVM evaluation; hence SMO is fastest for linear SVMs and sparse data
sets. |
| B. IBK (K Nearest Neighbours classifier) |
| K-Nearest Neighbor (KNN) classification [20] classifies instances based on their similarity. Each case is considered
as a point in multi-dimensional space and classification is done based on the nearest neighbors. The value of ‗k‘ for
nearest neighbors can vary. This determines how many cases are to be considered as neighbors to decide how to
classify an unknown instance. When given an unknown sample, a k-nearest neighbor classifier searches the pattern
space for the k training samples that are closest to the unknown sample. The unknown sample is assigned the most
common class among its k nearest neighbors. When k=1, the unknown sample is assigned the class of the training
sample that is closest to it in pattern space. The time taken to classify a test instance with nearest-neighbor classifier
increases linearly with the number of training instances that are kept in the classifier. It has a large storage requirement
[21]. Its performance degrades quickly with increasing noise levels. It also performs badly when different attributes
affect the outcome to different extents. One parameter that can affect the performance of the IBK algorithm is the
number of nearest neighbors to be used. By default it uses just one nearest neighbor. |
| C. BF Tree |
| Best First trees expand selecting the node which maximizes the impurity reduction among all the available nodes to
split. The impurity measure used by this algorithm is the Gini index and information gain [22]. |
| Best-first decision trees are constructed in a divide-and-conquer fashion similar to standard depth-first decision trees.
The basic idea for constructing the best-first tree is as follows. First, select an attribute to place at the root node and
make some branches for this attribute based on some criteria. Then, split training instances into subsets, one for each
branch extending from the root node. This constructing process continues until all nodes are pure or a specific number
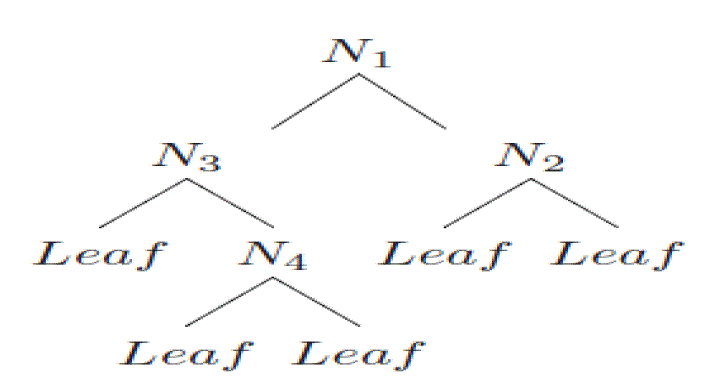
of expansions are reached. Figure 1 shows the split order of a hypothetical binary best-first tree. The information and
the Gini gain are also used to determine node order when expanding nodes in the best-first tree. The best-first method
always chooses the node for expansion whose corresponding best split provides the best information gain or Gini gain
among all unexpanded nodes in the tree. |
BREAST-CANCER-WISCONSIN DATA SET SUMMARY |
| The data used in this study are provided by the UC Irvine machine learning repository located in breast-cancer-
Wisconsin sub-directory, filenames root: breast-cancer-Wisconsin having 699 instances, 2 classes (malignant and
benign), and 9 integer-valued attributes. We removed the 16 instances with missing values from the dataset to construct
a new dataset with 683 instances (see Table 1). Class distribution: Benign: 458 (65.5%) Malignant: 241 (34.5%) |
EVALUATION METHODS |
| We have used the Weka toolkit to experiment with these three data mining algorithms. All experiments described in
this paper were performed using libraries from Weka machine learning environment. The Weka is an ensemble of tools
for data classification, regression, clustering, association rules, and visualization. WEKA version 3.6.9 was utilized as a
data mining tool to evaluate the performance and effectiveness of the 3-breast cancer prediction models built from
several techniques. This is because the WEKA program offers a well defined framework for experimenters and
developers to build and evaluate their models. The results show clearly that the proposed method performs well compared to other similar methods in the literature, taking into the fact that the attributes taken for analysis are not
direct indicators of breast cancer in the patients. |
EXPERIMENTAL RESULTS |
| This section summarizes the results of our experiments. We first describe the final data set, and then we provide the
results of modeling from classification. Here we did 10-fold cross validation for all the classifiers. The following
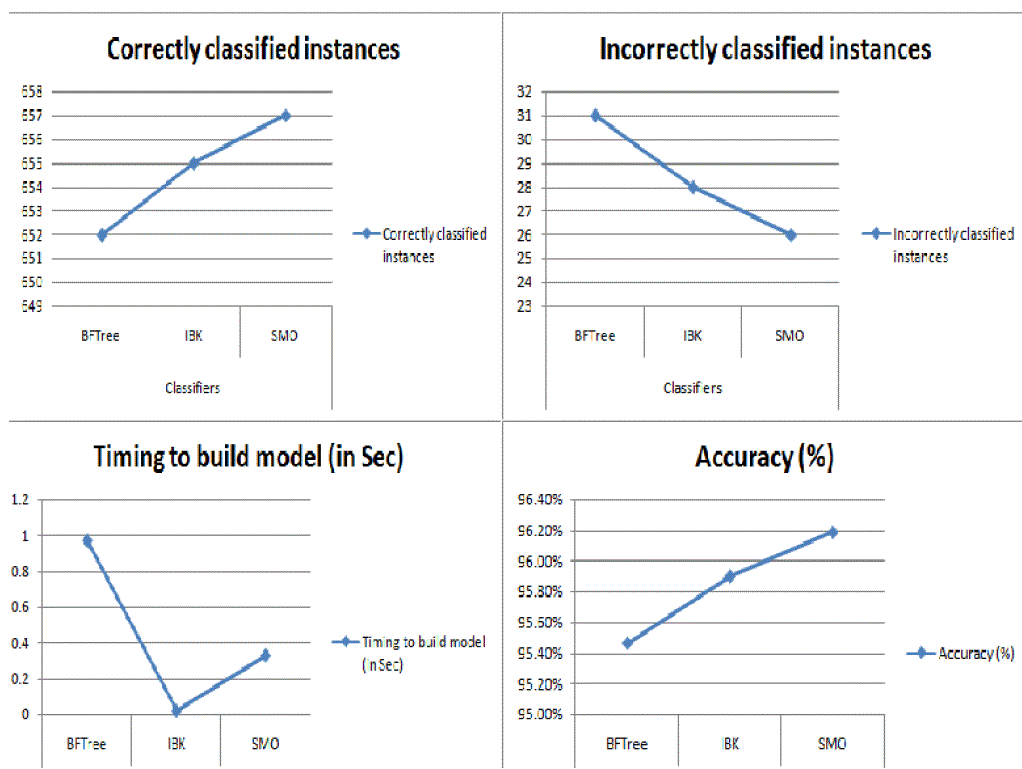
subsection summarizes the results of our experiment as shown in figure 2. |
| From above table we can conclude that Sequential Minimal Optimization (SMO) is more accurate classifier in
comparison to BFTree and IBK also it can be easily seen that it has highly classified correct instances as well as
incorrectly classified instance than other two classifiers (see figure 3). |
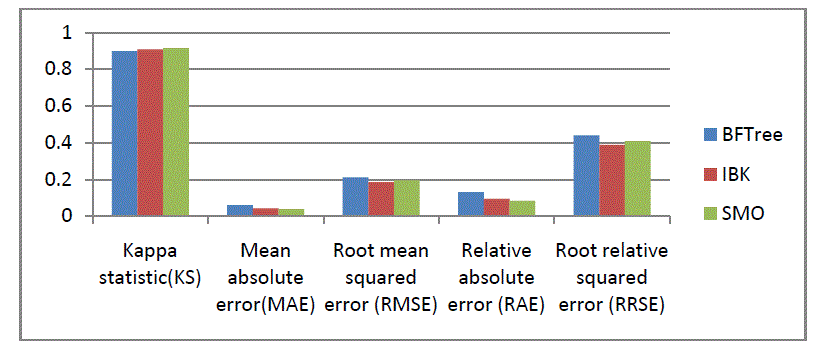
| Kappa statistic, mean absolute error and root mean squared error will be in numeric value only. We also show the
relative absolute error and root relative squared error in percentage for references and evaluation. The results of the
simulation are shown in Tables 3. |
| Figures 4 are the graphical representations of the simulation result. |
| The sensitivity or the true positive rate (TPR) is defined by TP / (TP + FN); while the specificity or the true negative
rate (TNR) is defined by TN / (TN + FP); and the accuracy is defined by (TP + TN) / (TP + FP + TN + FN). |
| True positive (TP) = number of positive samples correctly predicted. |
| False negative (FN) = number of positive samples wrongly predicted. |
| False positive (FP) = number of negative samples wrongly predicted as positive. |
| True negative (TN) = number of negative samples correctly predicted. |
| Table 4 below shows the TP rate, FP rate, precision, recall value for Sequential Minimal Optimization (SMO),
BFTree and IBK. |
| Classification Matrix displays the frequency of correct and incorrect predictions. It compares the actual values in the
test dataset with the predicted values in the trained model. The columns represent the predictions, and the rows
represent the actual class. To evaluate the robustness of classifier, the usual methodology is to perform cross validation
on the classifier (see Table 5). |
| Following three test conducted for better understand the importance of the input variables during breast cancer
prediction. These are Chi-square test, Info Gain test and Gain Ratio test. Different algorithms provide very different
results, i.e. each of them accounts the relevance of variables in a different way. The average value of all the algorithms
is taken as the final result of variables ranking, instead of selecting one algorithm and trusting it. The results obtained
with these values are shown in Table 6. |
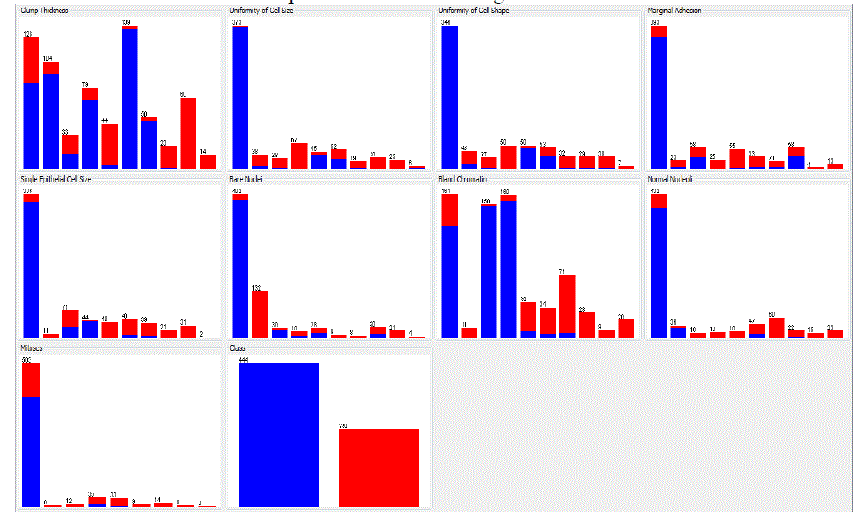
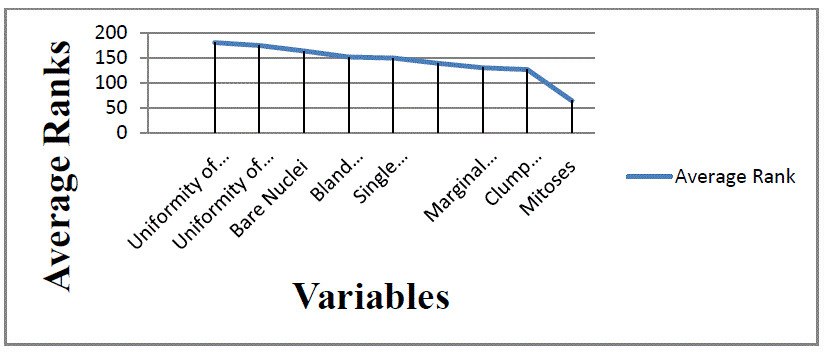
| The following analysis is to determine the importance of each variable individually. Table 6 shows that attribute
Uniformity of Cell Size impacts output the most, and that it showed the best performances in all of the three tests. Then
these attributes follow: Uniformity of Cell Shape, Bare Nuclei, Bland Chromatin, Single Epithelial Cell Size, Normal
Nucleoli, Marginal Adhesion, Clump Thickness and Mitoses. Figure 5 shows the importance of each attributes. |
CONCLUSION |
| In this paper, the accuracy of classification techniques is evaluated based on the selected classifier algorithm.
Specifically, we used three popular data mining methods: Sequential Minimal Optimization (SMO), IBK, BF Tree. An
important challenge in data mining and machine learning areas is to build precise and computationally efficient
classifiers for Medical applications. The performance of SMO shows the high level compare with other classifiers.
Hence SMO shows the concrete results with Breast Cancer disease of patient records. Therefore SMO classifier is
suggested for diagnosis of Breast Cancer disease based classification to get better results with accuracy, low error rate
and performance. We also shows that the most important attributes for breast cancer survivals are Uniformity of Cell
Size, Uniformity of Cell Shape, Bare Nuclei, Bland Chromatin, Single Epithelial Cell Size, Normal Nucleoli, Marginal
Adhesion, Clump Thickness and Mitoses. These attributes were found using three tests for the assessment of input
variables: Chi-square test, Info Gain test and Gain Ratio test. |
| |
Tables at a glance |
 |
 |
 |
| Table 1 |
Table 2 |
Table 3 |
 |
 |
 |
| Table 4 |
Table 5 |
Table 6 |
|
| |
Figures at a glance |
 |
 |
 |
 |
 |
| Figure 1 |
Figure 2 |
Figure 3 |
Figure 4 |
Figure 5 |
|
| |
References |
- M.S. Chen, J. Han, and P.S. Yu. ―Data mining: an overview from a database perspective,‖ IEEETransactions on Knowledge and Data Engineering, Vol. 8, No.6, pp. 866 – 883, 2002.
- Bittern, R., Dolgobrodov, D., Marshall, R., Moore, P., Steele, R., AND Cuschieri, A. artificial neural networks in cancer management.e-Science All Hands Meeting 19 (2007), pp.251 – 263.
- V. Chauraisa and S. Pal, ―Data Mining Techniques: To Predict and Resolve Breast Cancer Survivability‖, IJCSMC, Vol. 3, Issue. 1, January 2014, pp.10 – 22.
- Djebbari, A., Liu, Z., Phan, S., AND Famili, F. International journal of computational biology and drug design (ijcbdd).21st Annual Conference on Neural Information Processing Systems (2008).
- Liu Ya-Qin, Wang Cheng, Zhang Lu,‖ Decision Tree Based Predictive Models for Breast Cancer Survivability on Imbalanced Data‖ , 3rdInternational Conference on Bioinformatics and Biomedical Engineering , 2009.
- Tan AC, Gilbert D. ―Ensemble machine learning on gene expression data for cancer classification‖, Appl Bioinformatics. 2003;2(3 Suppl):S75-83.
- Bellaachia, A., AND Guven, E. Predicting breast cancer survivability using data mining techniques.
- JinyanLiHuiqing Liu, See-Kiong Ng and Limsoon Wong,‖ Discovery of significant rules for classifying cancer diagnosis data‖, Bioinformatics 19(Suppl. 2)Oxford University Press 2003.
- V. Chauraisa and S. Pal, ―Data Mining Approach to Detect Heart Diseases‖, International Journal of Advanced Computer Science and Information Technology (IJACSIT),Vol. 2, No. 4,2013, pp 56-66.
- V. Chauraisa and S. Pal, ―Early Prediction of Heart Diseases Using Data Mining Techniques‖, Carib.j.SciTech,,Vol.1, pp. 208-217, 2013.
- Pan Wen, ―Application of decision tree to identify a abnormal high frequency electrocardiograph‖, China National KnowledgeInfrastructure Journal, 2000.
- My ChauTu, Dongil Shin, Dongkyoo Shin ,―Effective Diagnosis of Heart Disease through Bagging Approach‖, 2nd International Conference on Biomedical Engineering and Informatics,2009.
- Dong-Sheng Cao, Qing-Song Xu ,Yi-Zeng Liang, Xian Chen, ―Automatic feature subset selection for decision tree-based ensemble methods in the prediction of bioactivity‖, Chemometrics and Intelligent Laboratory Systems.
- Dr. S.Vijayarani, S. Sudha, ―An Effective Classification Rule Technique for Heart Disease Prediction‖2010.
- Tsirogiannis, G.L, Frossyniotis, D, Stoitsis, J, Golemati, S, Stafylopatis, A Nikita,K.S,‖Classification of Medical Data with a Robust Multi-Level Combination scheme‖, IEEE international joint Conference on Neural Networks.
- My ChauTu, Dongil Shin, Dongkyoo Shin, ―A Comparative Study of Medical Data Classification Methods Based on Decision Tree and Bagging Algorithms‖ Eighth IEEE International Conference on Dependable, Autonomic and Secure Computing, 2009.
- Kaewchinporn .C, Vongsuchoto. N, Srisawat. A ‖ A Combination of Decision Tree Learning and clustering for Data Classification‖,2011 Eighth International Joint Conference on Computer Science and Software ngineering (JCSSE).
- B S Harish, D S Guru, S Manjunath, ―Representation and Classification of Text Documents: A Brief Review‖.
- Platt, J.C.: Sequential minimal optimization: a fast algorithm for training support vector machines. Technical Report MSR-TR-98- 14,Microsoft Research, 1998.
- J. Han and M. Kamber, Data Mining—Concepts and Technique (The Morgan Kaufmann Series in Data Management Systems), 2nd ed.San Mateo, CA: Morgan Kaufmann, 2006.
- D. Wolpert and W. Macready, No Free Lunch Theorems for Search, Santa Fe Institute, Technical report no., No. SFI-TR-95-02-010,1995.
- Haijian Shi. Best-first decision tree learning. Master‘s thesis, University of Waikato, Hamilton, NZ, 2007. COMP594.
|