Keywords
|
| Clustering, High dimensionality, collective neighbors, hubs |
INTRODUCTION
|
| Clustering in general is an unsupervised process of grouping elements together, so that elements assigned to the same cluster are more similar to each other than to the remaining data points [1]. This goal is often difficult to achieve in practice. Over the years, various clustering algorithms have been proposed, which can be roughly divided into four groups: partitional, hierarchical, density based, and subspace algorithms. Algorithms from the fourth group search for clusters in some lower dimensional projection of the original data, and have been generally preferred when dealing with data that are high dimensional [2], [3], [4], [5]. |
| The motivation for this preference lies in the observation that having more dimensions usually leads to the so-called curse of dimensionality, where the performance of many standard machine-learning algorithms becomes impaired. This is mostly due to two pervasive effects: the empty space phenomenon and concentration of distances. The former refers to the fact that all high-dimensional data sets tend to be sparse, because the number of points required to represent any distribution grows exponentially with the number of dimensions. This leads to bad density estimates for highdimensional data, causing difficulties for density-based approaches. The latter is a somewhat counterintuitive property of high-dimensional data representations, where all distances between data points tend to become harder to distinguish as dimensionality increases, which can cause problems with distance-based algorithms [6], [7], [8], [9]. |
| There are two main contributions of this paper. First, in experiments on synthetic data we show that hubness is a good measure of point centrality within a high-dimensional data cluster and that major hubs can be used effectively as cluster prototypes. In addition, we propose kernel mapping and collective neighbor clustering algorithms and evaluate their performance in various high-dimensional and semi-supervised data clustering tasks |
RELATED WORK
|
| In [2] authors are discuss very general techniques for projected clustering which are able to construct clusters in arbitrarily aligned subspaces of lower dimensionality. The subspaces are specific to the clusters themselves. This definition is substantially more general and realistic than currently available techniques which limit the method to only projections from the original set of attributes. The generalized projected clustering technique may also be viewed as a way of trying to redefine clustering for high dimensional applications by searching for hidden subspaces with clusters which are created by inter-attribute correlations. In [3] authors used an application domains such as life sciences, e.g. molecular biology produce a tremendous amount of data which can no longer be managed without the help of efficient and effective data mining methods. One of the primary data mining tasks is clustering. However, traditional clustering algorithms often fail to detect meaningful clusters because of the high dimensional, inherently sparse feature space of most real-world data sets. Nevertheless, the data sets often contain clusters hidden in various subspaces of the original feature space. A pre-processing step for traditional clustering algorithms, which detects all interesting subspaces of high-dimensional data containing clusters. For this purpose, we define a quality criterion for the interestingness of a subspace and propose an efficient algorithm called RIS (Ranking Interesting Subspaces) to examine all such subspaces. In [4] discussed the primary data mining tasks is clustering. However, traditional clustering algorithms often fail to detect meaningful clusters because most real-world data sets are characterized by a high dimensional, inherently sparse data space. Nevertheless, the data sets often contain interesting clusters which are hidden in various subspaces of the original feature space. In [5] authors improved the conclusive evaluation and comparison is challenged by three major issues. First, there is no ground truth that describes the "true" clusters in real world data. Second, a large variety of evaluation measures have been used that reflect different aspects of the clustering result. Finally, in typical publications authors have limited their analysis to their favored paradigm only, while paying other paradigms little or no attention. In [6] authors proposed the dimensionality curse from the point of view of the distance metrics which are used to measure the similarity between objects. The specifically examine the behavior of the commonly used Lk norm and show that the problem of meaningfulness in high dimensionality is sensitive to the value of k. For example, this means that the Manhattan distance metric L1-norm is consistently more preferable than the Euclidean distance metric L2-norm for high dimensional data mining applications. Using the intuition derived from our analysis, we introduce and examine a natural extension of the Lk-norm to fractional distance metrics. In [7] authors considered a nearest neighbor search and many other numerical data analysis tools most often rely on the use of the Euclidean distance. When data are high dimensional, however, the Euclidean distances seem to concentrate; all distances between pairs of data elements seem to be very similar. Therefore, the relevance of the Euclidean distance has been questioned in the past, and fractional norms (Murkowski-like norms with an exponent less than one) were introduced to fight the concentration phenomenon. |
PROPOSED ALGORITHM
|
| A. Association of mapping Hubs |
| An association between low hubness elements (i.e., anti-hubs) and outliers was also observed. A low-hubness score indicates that a point is on average far from the rest of the points and hence probably an outlier. In high-dimensional spaces, however, low data point elements are expected to occur by the very nature of these spaces and data resource. The kernel mapping can be applied using more general notions of similarity, and the similarities may be positive or negative. The output of the algorithm is unchanged if the similarities are scaled and/or offset by a constant (as long as the preferences are scaled and/or offset by the same constant). |
| ? To compute fitness measure over the set of possible clusters and then chooses among the set of cluster candidates points (hubs) those that optimize the measure used. |
| ? To identify the cluster of a specific vertex or to group all of the vertices into a set of clusters, and then present possible cluster fitness measures that serve for methods that produce the clustering by comparing different groupings and selecting one that meets or optimizes a certain criterion. |
| The ratio of the cluster is to minimum sums of degrees either inside the cluster or outside it. A fitness function is evaluated for all neighbours and the outcome is used to choose to which neighbour the search will proceed. |
| B. Kernel Mapping |
| The degree of branching can be specified with a kernel k that is directly applied to the similarity matrix. It is shown that the generated clusters can still be monotonic depending on the used linkage measure even though the induced dissimilarity measures are no longer ultra metrics. Using the pair-wise merged clusters; an additional shrinking process is proposed to generate topic related groups with more than two cluster elements. |
| ? The process of determining the degree to which a value belongs in a kernel set |
| ? The value returned by a Collective-Neighbor cluster |
| ? Most variables in a hub-based system have multiple data points attached to them |
| ? Kernel mapping that variable involves passing the crisp value through each neighbor attached to that value |
| C. Collective-Neighbor clustering |
| The Collective-Neighbour clustering algorithm works message passing among data points. Each data points (hubs) receive the availability from others data points (from pattern) and send the responsibility message to others data points (to pattern). Sum of responsibilities and availabilities for data points identify the cluster patterns. The high-dimensional data point availabilities A(i, k) are zero: A(i, k) = 0, R(i, k) is set to the input similarity between point i and point k as its pattern, minus the largest of the similarities between point i and other candidate patterns. |
| This approach computes two kinds of messages exchanged between data points. The first one is called “responsibility” r(i, j): it is sent from data point i to candidate exemplar point j and it reflects the accumulated evidence for how wellsuited point j is to serve as the exemplar for point i. The second message is called “availability” a(i, j): it is sent from candidate exemplar point j to point i and it reflects the accumulated evidence for how appropriate it would be for point i to choose point j as its exemplar. At the beginning, the availabilities are initialized to zero: a (i, j) = 0. The update equations for r (i, j) and a (i, j) are written as, |
![image]() |
![image]() |
| In addition, during each message?s exchange between data points, a damping factor ???[0,1 ]is added to avoid numerical oscillations that may arise in some circumstances: |
![image]() |
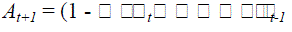 |
| where R = (r(i, j)) and A= (a(i, j)) represent the responsibility matrix and availability matrix, respectively, and t indicates the iteration times. The above two messages are updated iteratively, until they reach some specified values or the local decisions stay constant for a number of iterations. |
PSEUDO CODE
|
| Step 1: Load the High-dimensional data set. |
| Step 2: Calculate the Association maps based on the fitness measures. |
| Step 3: Check the degree of branching elements according to the fitness value. |
| Step 4: Calculate the Cluster Space energy for the entire selected input query using eq. (1). |
| Step 5: The Availabilities of the each cluster on the basis of responsibility using eq. (2) |
| Step 6: Calculate the cluster message passing between pair of points using eq. (3) and (4) |
| Step 7: go to step 2. |
| Step 8: End. |
SIMULATION RESULTS
|
| The simulation studies work has been evaluated using three data sets from two different domains: the two-part Miss- America data set (cs.joensuu.fi/sipu/datasets/), the Interne Spam database domain(archive.ics.uci.edu/ml/datasets.html). The first goal of the evaluation process was to identify the most suitable settings for each of the domains. The research works two different splitting criteria that can be used to induce the outlier. The criteria differ from one another in different aspects and are each suitable for different types of domains. In both the data (outlier data point) misuse and the movie recommender domains, the thesis work found that when no outlier is applied, all four criteria yield similar results in terms of the accuracy (measured bySilhoutte Index). |
| The clustering quality in these experiments was measured by two quality indices, the silhouette index and the isolation index [10], which measures a percentage of k-neighbor points that are clustered together. In the first experimental setup, the two-part Miss-America data set (cs.joensuu.fi/sipu/datasets/) was used for evaluation. Each part consists of 6,480 instances having 16 dimensions. Results were compared for various predefined numbers of clusters in algorithm calls. Each algorithm was tested 50 times for each number of clusters. Neighborhood size was 5. |
| The results for both parts of the data set are given in Table 1. Collective Neighbor Cluster (CNC) clearly outperformed GHPC and other hubness-based methods. This shows that hubs can serve as good cluster center prototypes. On the other hand, hyper spherical methods have their limits and kernel K-means achieved the best overall cluster quality on this data set. Only one quality estimate is given for GDBScan, as it automatically determines the number of clusters on its own. |
CONCLUSION AND FUTURE WORK
|
| The simulation results showed that the proposed algorithm performs better with the existing clustering algorithms. The proposed algorithm provides “kernel trick” with “Collective neighbor clustering” can easily be extended to incorporate additional pair-wise constrains such as requiring points with the same label to come into view in the same cluster with just an extra layer of function hubs. The model is flexible enough for information other than explicit constraints such as two points being in different clusters or even higher-order constraints (e.g., two of three points must be in the same cluster). To apply to the real data sets we need to refine the adjacency matrix by the hard-thresholding, say, and this area is worth pursuing as future research. |
Tables at a glance
|
 |
| Table 1 |
|
Figures at a glance
|
 |
| Figure 1 |
|
References
|
- J. Han and M. Kamber, Data Mining: Concepts and Techniques, second ed. Morgan Kaufmann, 2006.
- C.C. Aggarwal and P.S. Yu, “Finding Generalized Projected Clusters in High Dimensional Spaces,” Proc. 26th ACM SIGMOD Int Conf. Management of Data, pp. 70-81, 2000.
- K. Kailing, H.-P. Kriegel, P. Kro¨ ger, and S. Wanka, “Ranking Interesting Subspaces for Clustering High Dimensional Data,” Proc. Seventh European Conf. Principles and Practice of Knowledge Discovery in Databases (PKDD), pp. 241-252, 2003.
- K. Kailing, H.-P. Kriegel, and P. Kro¨ger, “Density-Connected Subspace Clustering for High-Dimensional Data,” Proc. Fourth SIAM Int”l Conf. Data Mining (SDM), pp. 246-257, 2004.
- E. Mu¨ ller, S. Gu¨nnemann, I. Assent, and T. Seidl, “Evaluating Clustering in Subspace Projections of High Dimensional Data, ” Proc. VLDB Endowment, vol. 2, pp. 1270-1281, 2009.
- C.C. Aggarwal, A. Hinneburg, and D.A. Keim, “On the Surprising Behavior of Distance Metrics in High Dimensional Spaces,” Proc .Eighth Int”l Conf. Database Theory (ICDT), pp. 420-434, 2001.
- D. Franc¸ois, V. Wertz, and M. Verleysen, “The Concentration of Fractional Distances,” IEEE Trans. Knowledge and Data Eng., vol. 19, no. 7, pp. 873-886, July 2007.
- R.J. Durrant and A. Kaba´n, “When Is „Nearest Neighbor” Meaningful: A Converse Theorem and Implications,” J. Complexity, vol. 25, no. 4, pp. 385-397, 2009.Kaba´n, “Non-Parametric Detection of Meaningless Distances in High Dimensional Data,” Statistics and Computing, vol. 22, no. 2, pp. 375-385, 2012.
- G. Frederix and E.J. Pauwels, “Shape-Invariant Cluster Validity Indices,” Proc. Fourth Industrial Conf. Data Mining (ICDM), pp. 96-105, 2004.
- Vadivel, R and V. Murali Bhaskaran,”Energy Efficient with Secured Reliable Routing Protocol (EESRRP) for Mobile Ad-Hoc Networks”, Procedia Technology 4,pp. 703- 707, 2012.
|