Keywords
|
| CBIR, Multi-wavelet Transform, Micro Structure Descriptor, Noise reduction, CGLSFD. |
INTRODUCTION
|
| Content Based Image Retrieval (CBIR) is any technology that in principle helps to organize digital image archives by their visual content. By this definition, anything ranging from an image similarity function to a robust image annotation engine falls under the purview of CBIR The most common form of CBIR is an image search based on visual .The increasing amount of digitally produced images requires new methods to archive and access this data. Conventional databases allow for textual searches on Meta data only. Content Based Image Retrieval (CBIR) is a technique which uses visual contents, normally called as features, to search images from large scale image databases according to users’ requests in the form of a query image. Apart from the usual features like color and texture, a new feature extraction algorithm called CGLSFD introduced. CGLSFD convey essential information to a picture and therefore can be applied to image retrieval. The CGLSFD captures the spatial distribution of edges, color layout, shape and texture and multiwavelet low & high frequency bands. This model expects the input as Query by Example (QBE) and any combination of features can be selected for retrieval. The focus is to build a universal CBIR system using low level features. |
RELATED WORK
|
| A. CBIR Using Wavelet Transform |
| The wavelet transform goes further than the short time Fourier transforms. It’s also analyses the image by multiplying it by a window function and performing an orthogonal expansion, analogously to other linear integral transformation [1] .There are two direction in which they analysis is extended. First direction, the basic functions (called wavelets, meaning a small wave, or mother wavelets) are more complicated than sines and cosines [2]. They provide localization in space to a certain degree, not entire localization due to the certainty principal. Second direction, the analysis is performed at multiple scales. Localization in the spatial domain together with the wavelet’ localization infrequency yields a sparse representation of many practical images [3]. This sparseness opens the door to successful application in image compression, noise filtering and detecting features in images. Wavelets have been used with enormous success in data compression, feature detection and in image noise suppression-it’s possible to erase to zero the contribution of wavelet components that are ‘small’ and correspond to noise without erasing the important small details in the underlying image [4]. |
| B. CBIR Using Different Descriptor |
| The human visual attention is enhanced through a process of competing interactions among neurons, which selects a few elements of attention and suppresses irrelevant materials [5]. There are close relationships between low-level visual features and human visual attention system, and hence the research on how to use visual perception mechanism for image retrieval is an important yet challenging problem. In order to extract features via simulating visual processing procedures and effectively integrate color, texture, shape features and image color layout information as a whole for image retrieval, in this paper we propose a novel feature detector and descriptor, namely micro- structures descriptors (MSD), to describe image features via microstructures. |
PROPOSED ALGORITHM
|
| A. Multi-Wavelet Transform: |
| Multi-wavelets were defined using several wavelets with several scaling functions [9]. Multi-wavelets have several advantages in comparison with scalar wavelet [10]. The features such as compact support, Orthogonality, symmetry, and high order approximation are the base features for this transformation. A scalar wavelet cannot possess all these properties at the same time. On the other hand, a multi-wavelet system can simultaneously provide perfect representation while preserving length (Orthogonality), good performance at the boundaries (via linear-phase symmetry), and a high order of approximation (vanishing moments) [11]. Thus multi-wavelets offer the possibility of superior performance and high degree of freedom for image processing applications, compared with scalar wavelets. |
| These multi-wavelets have the potential to offer better representative quality than the conventional scalar transforms. Finally, multi-wavelets can achieve better level of performance than scalar wavelets with similar computational complexity. Wavelets are useful tools for signal processing applications such as image retrieval and de-noise. |
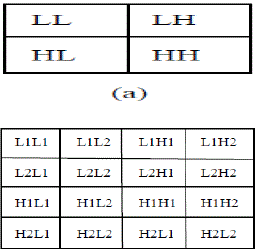
| During a single level of decomposition using a scalar wavelet transform, the 2- D image data is replaced by four blocks corresponding to the sub bands representing either low pass or high pass in both dimensions. These sub bands are illustrated in Fig. 1. The multi-wavelets used here have two channels, so there will be two sets of scaling coefficients and two sets of wavelet coefficients. Multiple iteration over the low pass data is desired, the scaling coefficients for the two channels are stored together. Likewise, the wavelet coefficients for the two channels are also stored together. For multiwavelets the L and H have subscripts denoting the channel to which the data corresponds. For example, the sub band labelled L1H2 corresponds to data from the second channel high pass filter in the horizontal direction and the first channel low pass filter in the vertical direction. This shows how a single level of decomposition is done. In practice, there is more than one decomposition performed on the image. Successive iterations are performed on the low pass coefficients from the previous stage to further reduce the number of low pass coefficients. Since the low pass coefficients contain most of the original signal energy, this iteration process yields better energy compaction. After a certain number of iteration, the benefits gained in energy compaction becomes rather negligible compared to the extra computational effort. Usually five levels of decomposition are used. |
| Features Representation: |
| Compute the standard deviation (SD), energy and mean of the multi wavelet decomposed image. Standard Deviation is |
 (6) (6) |
| Where, WK= co-efficient of kth multi-wavelet decomposed sub-band. |
| µkmean value of kth sub-band. |
| MxN = size of the multi-wavelet decomposed sub band. |
| Energy is |
 (7) (7) |
| B. Micro Structure Descriptor: |
| i) HSV color space and Quantization |
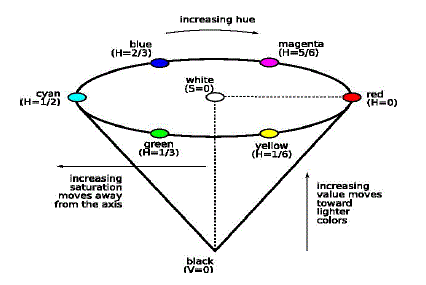
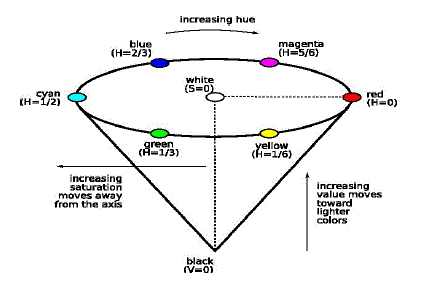
| HSV are the two most common cylindrical coordinate representations of points in an RGB color model. The two representations rearrange the geometry of RGB in an attempt to be more intuitive and perceptually relevant than the Cartesian (cube) representation. The hue (H) of a color refers to which pure color it resembles. All tints, tones and shades of red have the same hue. Hues are described by a number that specifies the position of the corresponding pure color on the color wheel, as a fraction between 0 and 1. Value 0 refers to red; 1/6 is yellow; 1/3 is green; and so forth around the color wheel. The saturation (S) of a color describes how white the color is. A pure red is fully saturated, with a saturation of 1; tints of red have saturations less than 1; and white has a saturation of 0. The value (V) of a color, also called its lightness, describes how dark the color is. A value of 0 is black, with increasing lightness moving away from black. The outer edge of the top of the cone is the color wheel, with all the pure colors. The H parameter describes the angle around the wheel. The S (saturation) is zero for any color on the axis of the cone; the center of the top circle is white. An increase in the value of S corresponds to a movement away from the axis. The V (value or lightness) is zero for black. An increase in the value of V corresponds to a movement away from black and toward the top of the cone. |
 |
| ii) MSD Definition and Local Feature Representation |
| Human visual system is sensitive to orientation and color. Orientation is a powerful visual cue about the subject depicted in an image. Strong orientation usually indicates a definite pattern; however, many natural scenes do not show strong orientation and have no clear structure or specific pattern. Although the natural images show various contents, they may have some common fundamental elements. The different combination and spatial distribution of those basic elements result in the various micro-structures or patterns in the natural images. In this paper, micro-structures are defined as the collection of certain underlying colors. |
| In order to find the micro-structures [13], which have similar attributes such as edge orientation and color distribution, we partition the image into many small blocks, which can be a grid of size 2x2, 3x3, 5x5, 7x7 and so on. For the convenience of expression, the 3x3 block is used in the following development of microstructure analysis. The edge orientation image y(x, y) is used to define micro- structures, because an edge orientation is insensitive to color and illumination variation and it is independent of translation, scaling and small rotation [7]. Note that since we quantize the orientation into six levels, the values of the pixels in y(x, y) can only vary from 0 to5. We move the 3x3 block from leftto- right and top-to-bottom throughout the image to detect micro-structures. We use the following equation to describe the micro-structure features |
 (8) (8) |
| The dimensionality of H(W0) is 72 for color images. It can express how the spatial correlation of neighbouring underlying colors distributes in the micro-structures image. |
| C. Combined Global-Local Specialized Feature |
| i) Proposed Algorithm: |
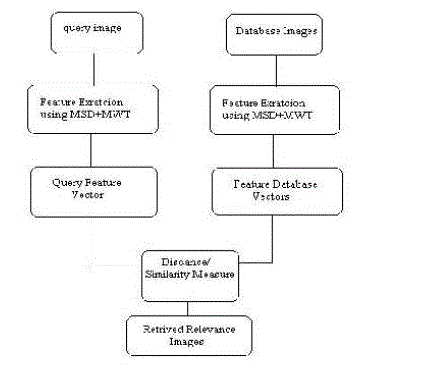
| Step1: Query image convert to RGB to HSV |
| Step2: Calculate MSD features using equation- (8). |
| Step3: Decompose Query image in the multi-wavelet domain. |
| Step4: Calculate SD, Energy and Mean using equation– (6) & (7). |
| Stpe5: Apply query image and calculate the feature vector as given in steps 2 and 4. |
| Step6: Calculate the similarity measure using SAD and L1 distance metric. |
| Step7: Retrieve all relevant images to query image based on minimum SAD or L1 distance metric. |
SIMULATION AND RESULTS
|
| A. Data Set: |
| So far there are no standard test data set and performance evaluation model for CBIR systems [12]. Most of the researchers use Corel image data set to test image retrieval performance, while some researchers use self-collected images or Brodatz and Outex texture data sets in experiments. However, Corel dataset has become a de-facto standard in demonstrating the performance of CBIR systems |
| B. Similarity Measure: |
| i) Sum-of-Absolute Differences (SAD) |
| In CBIR, eight similarity measures have been proposed [14]. In this work, Sum-of-Absolute Differences (SAD) method is used. |
 (9) (9) |
| Where fa [1],fa [2]....fa [n]represents the query feature vector,ft [1],ft [2] ,ft [n]denotes the database feature vectors and n is the number of features in each vector. |
| C. L1 Distance Metric: |
| An M-dimensional feature vector T=[T1, T2, T3]is extracted and stored in the database. LetQ=[Q_(1),Q_(2),Q_(M)_ be the feature vector of a query image, the L1 distance between them is simply calculated is |
 (10) (10) |
| The L1 distance is simple to calculate, which needs no square or square root operations. It can save much computational cost and is very suitable for large scale image datasets. For the proposed MSD, M=72 for color images. The class label of the template image, which yields the smallest distance, is assigned to the query image. |
| D. Retrieval Results and Comparison: |
| The list of tables provides a detailed comparison of average retrieval accuracy for entire database and retrieval time for query image using multi-wavelet with MSD feature parameters such as mean, energy and standard deviation. Comparison of retrieval performance using Gabor, MWT and MSD, also compared distance metrics SAD, L1 distance. |
CONCLUSION
|
| In this paper we introduced a novel CBIR approach via selected specialized features in multi-wavelet decomposition and MSD of CGLSFD in images, followed by CGLSFD feature extraction and similarity match under SAD and L1. The precision value goes on increasing and recall value goes on decreasing as decomposition level increases. Also our proposed method perform well in various noisy query environment, CGLSFD performance is good in compared with some traditional existing methods Gabor , MSD and MWT. |
Tables at a glance
|
|
|
Figures at a glance
|
 |
 |
 |
| Figure 1 |
Figure 2 |
Figure 3 |
|
References
|
- M.Sonka, V.Hlavac and R.Boyle., ‘Digital Image Processing and Computer Vision’., Cengage Learning, (2008).
- M.N. Do, M. Vetterli., ‘ Wavelet-based texture retrieval using generalized Gaussian density and Kullback-Leibler distance’., IEEE Transactions on Image Processing 11 (2) 146-158, 2002.
- Daubechies., ‘The wavelet transform, time frequency localization and signal analysis’ ., IEEE Trans. On Information Theory, Vol. 36, pp. 961-1005, 1990.
- S. G. Mallat., ‘A theory for multi-resolution signal decomposition: the wavelet representation’., IEEE Trans. on PAMI, Vol. 11, pp.674-693, 1989.
- R. Desimone, ‘Visual attention mediated by biased competition in extrastriate visual cortex’., Philosophical Transactions of the Royal Society B 353 (1998) 1245–1255.
- Image Noise, http://en.wikipedia.org/wiki/ Image_noise.
- Rafael C. Gonzalez, Richard E. Woods, ‘Digital Image Processing’. Pearson Prenctice Hall,(2007).
- Noise Models, http://homepages.inf.ed.ac.uk/rbf/ CVonline/LOCAL_COPIES/VELDHUIZEN/ node11.html.
- Hiremath.P.S, Shivashankar . S., ‘Wavelet based features for texture classification’., GVIP Journal, Vol.6, Issue 3, pp 55-58, December 2006.
- X. Wan and C. C. J. Kuo., ‘Color distribution analysis and quantization for image retrieval’., SPIE proceedings, vol.2670., February 1996.
- Y. Liu, D. Zhang, G. Lu, W.Y. Ma, ‘A survey of content-based image retrieval with high-level semantics’., Pattern Recognition 40 (11) (2007) 262–282.
- Guang-Hai Liu, Zuo-YongLi, LeiZhang, YongXu, .,‘Image retrieval based on microstructure descriptor’., Pattern Recognition 44 (2011) 2123–2133.
- D.Zhang and G.Lu., ‘ Evaluation of similarity measure for image retrieval’., IEEE Int. Conf. Neural Networks and signal processing Nanjing, China, December 14-17,2003.
|