Keywords
|
| Health parameters, photoplethysmographic imaging, heart rate (HR), respiratory rate (RR), Independent Component Analysis (ICA), Laplacian Eigenmap (LE), Pyramidal Lucas-Kanade (LK) feature tracker. |
INTRODUCTION
|
| Various parameters such as heart rate (HR), heart rate variability (HRV), respiration rate (RR), blood pulse pressure, blood glucose concentration and the saturation of oxyhemoglobin in blood are important for determining the integrity of a person’s health. The conventional methods for acquiring this information cannot be done away with, and they serve as Gold Standards for clinical and research purpose. The example of pulse oximetry being used to monitor oxyhemoglobin saturation and HR for clinical purpose is well known. Also the cardiac electrocardiogram (ECG) using chest electrodes, is a well-established technique for observing the electric activity of the heart. However, these methods have some limitations. The main drawback is that the electrodes have to be in constant contact with the patient. Most of these methods require the subject to be rested on a chair or bed during the course of measurement. Take into consideration the patient’s comfort during long-term monitoring and these techniques do not fare well. |
| Techniques like Laser Doppler velocimetry to measure red blood cell velocity [1] and optical methods used for noncontact measurements [2], [3] have been developed after painstaking research as mentioned in [4]. When compared with conventional methods, they have the tendency to be more non-invasive and are noncontact in nature. |
| Photoplethysmographic imaging is as simple as pointing a normal camera at subjects and recording their activity. However, it is the underlying processing and analysis which makes phoplethysmographic imaging fit for extraction of health parameters. In this paper, we are further going to discuss the developments made in a few photoplethysmographic imaging and processing techniques for extraction of health parameters and will do a review of these techniques. Simultaneously, we will be proposing a few directions for future work in this area. |
BACKGROUND AND THEORY
|
| For capture of reliable signals we have to use invasive sensors. But when we talk of noncontact signal capture invasive sensors is something we cannot opt for. In such a situation we are left to think if there is really a way of gathering reliable signals using a non-invasive technique in a cost effective way? Tapping into the light information of the skin reflectance spectrum may come handy. |
| A. Photoplethysmogram (PPG) and its imaging |
| Blood is pumped to various parts of the body through the arteries when the heart contracts. This at some point in time causes a wave of blood to flow through the various skin tissues. When the capillaries of skin tissue are filled with blood, they block the passage of light through them which causes more light to be reflected from the skin. The change in the volume of blood in the capillaries of skin tissue directly affects the amount of reflected light. This light can be captured by a camera and a time signal representation can be generated of various health parameters.PPG uses light reflectance or transmission for collecting physiological health information. The flow of blood affects the reflection or transmission of light in the tissue that contains it. Pulse oximetry uses this method to determine the oxygen saturation of arteries. The change in attenuation of light from the body tissue reflects the oxygen saturation in the blood. A detailed description of PPG is given in the work by Sahindrakar et al. [5]. |
| B. Independent Component Analysis (ICA) |
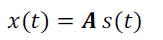
| ICA is a computational technique that is used to separate a multivariate signal into its independent source components assuming that the source signals are non-Gaussian in nature and are statistically independent of each other [6]. ICA is said to be a special case of blind source separation (BSS). The photoplethysmographic signal reflected or transmitted through the skin tissue can be picked up by a camera and recorded as a video of a region of the skin. Let the red, green and blue (RGB) color sensors of the camera record their observed signal respectively as time signalsxr(t), xg(t) andxb(t). Let us assume that the underlying source signals are s1(t), s2(t) and s3(t). The ICA model assumes that the observed signals are linear mixtures of the source signals as: |
 (1) (1) |
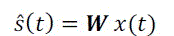
| where, x(t)is the observed column matrix, s(t) is the source column matrix and A is a 3x3 square mixing matrix with coefficients aij . The ICA algorithm tries to find an approximation of the demixing matrix W which is the inverse of the mixing matrix A as: |
 (2) (2) |
| and the signal sÃÅÃâ(t) is an approximation of s(t) which contains the underlying source signals. The coefficients of W are iteratively updated so as to maximize the non-Gaussianity of each source. |
| C. Laplacian Eigenmap (LE) |
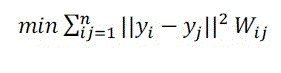
| LE is a concept of spectral graph theory and uses the Laplacian-Beltrami operator iteratively so as to map highdimensional space into a low-dimensional space. The approach here is to find the data in the low-dimensional space while maintaining the distance relation of any two given points [7], [8]. For extraction of health parameters the aim is to reduce a recorded three dimensional space X = (x1, x2,…. , xn)3 to a one dimensional space y = (y1, y2,…. , yn). For this, the LE algorithm calculates the Euclidean distance of X to generate a square matrix G. LE basically tries to solve the optimization problem: |
 (3) (3) |
| where,wij is the proximity of two near points xi and xj. As the proximity of these two increases the value of wij increases. These steps applied in continuous iteration reduce the dimensionality of the data. |
| D. Pyramidal Lucas-Kanade feature tracker |
| The Lucas-Kanade (LK) algorithm is used for motion estimation between frames. This algorithm can be used to track the skin pixels from frame to frame by specifying certain prominent points on the skin to be used as features. It works on sparse technique by using a small local window to track the features. The problem with this algorithm is that if the motion of these features is outside the local window it is not possible to track them. |
| This is where the Pyramidal LK tracker [9], [10], [5] comes handy. A diagram explaining the flow of this algorithm is given in [10], [5]. According to [5] it starts of by taking a larger area of lower detail (higher level) and works down step by step to a smaller area of higher detail (lower level). If we suppose that I and J are two images. Let the pixel coordinate matrix beX = [x y]T. A point in the first image (I), u = [ux uy]T gets displaced in the second image (J) and the new coordinates have to be estimated. The vector of d = [dx dy]T gives the optical flow of X and is defined as the vector that minimizes the residual function which ε is: |
 (4) (4) |
| This is measured on a neighborhood of size (2wx + 1) by (2wy + 1) where Wx and Wy are integer numbers which typically range between 2 and 7. The height of the pyramid is Lm + 1 where L = 0, 1, …., Lm are the levels of the pyramid. |
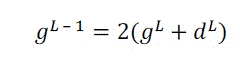
| In the algorithm, first the optical flow is calculated at level Lm. The result of processing is passed on to level Lm – 1 using an initial guess defined as: |
 (5) (5) |
| where, initial guess for level Lm is zero i.e.gLm = [0 0]T. Using this initial guess a refined optical flow is found at level Lm – 1 and this process iterates. If we consider the process between two levels L + 1 and L, the optical flow vector dL between them is one which minimizes the new image matching error εLgiven as: |
 |
| which includes the guess for level L. For Pyramidal LK method to work properly we require good features which we can track from frame to frame. It is important that these features lie on the skin because it is the skin which we have to track. |
METHODOLOGY
|
| There are many techniques which can be used for extraction of health parametersfrom PPG signals. But a few techniques have been developed in recent years which give results that agree with those of previous conventional methods. In this section we have a look at methods that make use of ICA, LE and Pyramidal LK techniques for parameter extraction. |
| A. Experimental Setup |
| For the purpose of parameter extraction, the video imaging of a certain part of the skin needs to be done. For this the region of interest (ROI) can be the face, fingertip or earlobe. These are placed before the camera and their video recorded for a fixed duration. The face ROI is mostly used for reflection type photoplethysmographic imaging and the fingertip ROI is used for transmission and reflection type photoplethysmographic imaging. For both the ROI techniques, the subject is required to sit in front of the camera or place his/her fingertip in front of the camera and sit still. The subject has to breathe spontaneously so as to not induce motion artifacts. The video of the desired ROI is recorded in color with a frame rate of 15-30 frames per second (fps) and is saved in AVI format on a computer for further processing. This can be done by writing a custom program in MATLAB (The Mathworks Inc.) or using the Open Computer Vision (OpenCV) library for an implementation in C language. |
| B. Using the ICA algorithm |
| Poh et al. [11] proposed an algorithm based on ICA analysis after their work at the MIT Media Lab in 2010. For this first a face detection step is employed in OpenCV as it requires the face as a ROI. This can be implemented using an algorithm based on the work by Viola and Jones [12] or Lienhart and Maydt [13] which use Haar-like features. After detection of the face and its selection as the ROI, it is split into RGB channels. A spatial average of all pixels of the ROI is calculated of each frame for all three channels, thus giving the three traces xr(t), xg(t) and xb(t). A moving window of 30 seconds with about 97% overlap (1 second increment) is used to generate a time domain signal. The RGB traces are normalized as: |
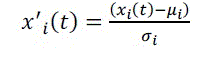 (7) (7) |
| where,i = r, g, b; μi and σi are the mean and standard deviation of xi(t)respectively. These normalized signals are decomposed into three independent components using either joint approximate diagonalization of eigenmatrices (JADE) algorithm developed by Cardoso [14] or FastICA based on the work by Hyvärinen [15] as an ICA algorithm. After this a fast Fourier transform (FFT) is applied on the selected source signal to obtain a power spectrum. The pulse (HR) is said to have the frequency with the highest power in the operational range of 0.75 – 4 Hz corresponding to 45- 240 beats per minute (bpm). |
| This work was further advanced by the same team [16]. They incorporated additional post processing steps on the segregated independent component. The steps include the use of a five-point moving average filter and a 128-point Hamming window band pass filter (0.75 – 4 Hz). A cubic spline function is applied to this signal to amplify the slopes. A new technique of in beat intervals (IBIs) is employed to calculate the HR. The HR can be found out from the average of the IBI time series as 60/(IBI). The HRV information is reflected in the power spectral density (PSD) using Lomb periodogram. Here a high frequency (HF) component related to breathing helps in estimating the RR of a subject [17]. The RR can be calculated using the center frequency of the HF peak fHF in the PSD as 60/fHF. |
| C. Using the Laplacian eigenmap algorithm |
| The method incorporating Laplacian eigenmap [18] employs a similar methodology as that of the IBI series method. The raw traces of RGB channels of a face ROI are first used to construct a Lalpacian eigenmap which reduces the three signals into one by means of dimensionality reduction. Once a single signal is acquired, we eliminate the singular points in the data which have amplitude greater or equal to ten times that of the average of the time series signal. After this the post processing steps of moving average filtering, a Hamming window and a cubic spline are applied to the signal. The HR is then found out from the IBI series. According to the study, the LE algorithm measurements when compared with measurements made using a fingertip pulse oximeter have close agreement. When compared with ICA, LE gives better results as ICA terminates when it fails to get the optimum result and displays the components of the last iteration as results. But LE builds a map and iterates to make it optimal. A comparison of how LE fares when compared with other techniques has been shown in the work by Wei et al. [18]. |
| D. Use of Pyramidal LK algorithm (motion robust technique) |
| Sahindrakar et al. [5] developed a technique which is said to have outperformed ICA in motion robustness. This technique uses the face as the ROI and tracks it in successive frames using the Pyramidal LK method. This is basically the process of tracking a patch of skin which is also called patch tracking (PT). The methodology here is to combine the RGB traces in an additive manner and generate two component additive signals ‘R – G’, ‘G – B’ and ‘R – B’. Generating the three component additive signals of ‘R + G – 2B’ and ‘– 2R + G + B’ at the same time. Using vector analysis, the ‘R – G’ and ‘R + G – 2B’ vectors are found to be orthogonal to each other and containing the spectrum of maximum light absorptivity by the skin. Using the ‘R – G’ and ‘R + G – 2B’ vectors with patch tracking gives rise to the Patch Tracking - GB vs RG2B (PT-RG-RG2B) method. If one of these two signals is stretched to match the variation in amplitude of the other and later combined, the two signals together it gives a stronger resultant signal. According to Sahindrakar et al. [5], a FFT analysis for HR extraction reveals that PT-RG-RG2B has a signal to noise ratio (SNR) equivalent to that of a method similar to ICA type BSS using patch tracking, and a root mean square error (RMSE) outperforming that of the ICA technique. |
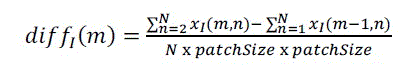
| When skin patches are tracked from one frame to another there is not much change in their components due to any variations. A difference trace can be generated by taking the difference between the average RGB values of the successive frames. This can capture subtle changes from frame to frame which correspond to the pulse. Also integrating such difference traces gives RGB traces with a much higher SNR. If we consider that xR(m, n), xG(m, n) and xB(m, n) are the sum of red, green and blue pixels in nth patch on mth frame. If there are N patches which are tracked from frame m - 1 to m. Then the difference traces diffR , diffG and diffB can be given as: |
 (8) (8) |
| where, I = R, G, B and patchSize is the length of a patch. The PT-RG-RG2B thus got from it is modified into a PT-RGRG2B with average difference (PT-RG-RG2B-AD). The main advantage of this technique seems to be that it requires less amounts of processing power when compared to the ICA technique and is more robust to motion. The factor of processing power requirement is important when we consider using a higher frame rate or fps. |
| E. Selection of the Region of Interest (ROI) |
| In theory, any area of the skin can be used as an ROI for capturing the PPG signal needed for extraction of health parameters. In practice though the parameters of signals recovered using different ROI techniques have different characteristics. According to [4], the light absorbed by blood in the veins does not change hence tissues containing it give a PPG showing Direct Current (DC) component. As arterial blood and its flow contain pulse information, tissues containing it reflect a PPG with Alternating Current (AC) component. Parts of the body having both types of tissue when used for measurement display an AC component superimposed on the DC component. Studies have shown that light reflectance can be influenced by various physiological differences at different depths of the tissue [19]. For ease of measurement and comfort of the subject three ROIs are generally preferred which include a fingertip [20]; the face [5], [11], [16] or any one earlobe [21]. Of these the first two are generally used. |
| Over the years, a few studies have been carried out on segregating certain regions of the face as an ROI and comparison has been done between them [22], [23]. During some of these studies it has been found that the forehead region when used as a ROI does give results comparable with the results of a face ROI. |
DIRECTIONS FOR FUTURE WORK
|
| In section III. E., we have seen that the selection of the ROI may affect the characteristics of the parameter being extracted. Individual studies have been done using the face, a fingertip and an earlobe as a ROI but the measurements of these regions has never been compared. Much work has to be done to find out which of these regions gives more stable and reliable readings. The studies focusing on the earlobe ROI make use of PPG sensors and other capture techniques instead of making use of a camera device. It is understandable that measuring the health parameters using a smartphone or laptop camera and employing earlobe ROI technique is not feasible. Measurement of parameters from the earlobe ROI may require a special PPG device for capturing signals. It is important that such devices are compact and inexpensive so that they can be embedded into an earring or a hands-free headphone. This will help in long-term monitoring of health parameters because both earrings and hands-free headphones can be worn for a longer period of time. But if PPG signal capture using a camera and earlobe ROI is a stringent requirement then using smartphones is the way to go. For this it is important that the smartphones satisfy the requirement of processing power of the algorithms used for PPG signal capture and analysis. |
| For the Fourier domain analysis of the time series signal we can either use FFT or discrete Fourier transform (DFT) as a transform technique to convert from time domain to frequency domain. It is obvious that FFT is faster than DFT in speed of computation. For this reason FFT is always preferred over DFT in high speed hardware design which is mentioned in [4]. But the fact that is overlooked is the size of the window over which the FFT is computed. This is indirectly influenced by the size of the window of the time series containing signal data. In some studies a moving window of 30 seconds of data samples has been used where as in others this window holds 10 seconds worth of data samples. The effect of changing the size of the moving window on the health parameters being extracted has not been investigated. But it can be said that a smaller window will be more efficient in tracking the changes over a shorter duration of time. Similarly a larger window will be preferred for tracking changes over a larger duration of time. Taking an example of Poh et al. [11], wherein the window used is large in size (30 seconds). The algorithm in this work discards a change of 12 bpm from the previous measurement. If the heart rate has actually risen above 12 bpm in the past 30 seconds, there will be an error in measurement. Hence the size of the window does play an important role in measurement. |
| When we consider the ICA method for extracting source signals from observed signals it is important to consider the nonlinearity between the source signals. If the nonlinearity according to which these source signals mix is known beforehand processing becomes much easier (which is obviously not the case). The nonlinearity that the algorithm uses to estimate the source signals may affect the final solution. Also different variations of ICA use different methodologies for convergence which affects the final solution. The algorithm should iterate till it has found an optimal solution which is not the case with some techniques. |
| The ICA method is efficient when the nonlinearity is known and an efficient computation technique is used from the different variations of ICA. The LE method is described as giving better results than many of the other processing techniques [18]. The method using Pyramidal LK algorithm [5] is known to be motion robust and requires lesser amounts processing time and hence may be a strong candidate for real-time implementation. However, a comparison of the SNR, RMSE and computation time complexity between the LE and Pyramidal LK methods is necessary and has not yet been done.The LE method looks more accurate while the Pyramidal LK method seems to be more motion robust and computationally less heavy. The method by Sahindrkar et al. [5] can also be developed using a face detector insteadof the Pyramidal LK tracker and then using the subtraction vectors computed from R, G and B for extracting the health parameters. |
| Most of the methods seen in section III are implemented on video recordings of subjects and not in real-time. It is important that the algorithms used for extracting the parameters meet certain time constraints for implementation in a real-time manner. If the algorithms are computationally heavy, they take more time to implement and this may cause skipping of frames [5]. Specifically, the techniques which rely on face detection algorithms may have a severe downfall if the face detection algorithm consumes lots of computational power. This is because face detection algorithms are known to be computationally heavy as they detect a face in a frame in many passes. Hence, the algorithms should be improved to consume less time during processing so as to have real-time implementations. |
| For portable monitoring of health parameters, the capture techniques must be implemented on a handheld embedded platform. For this it is important for the complex algorithms being used to stay within limits of the processing power of the hardware platform they are implemented on. One aspect that should be considered while talking about consumer handheld embedded devices like smartphones is that they are built for aesthetics and thus may lack in some aspects of their processing power. An example is the one from [4] which talks about the frame rate of most conventional smartphone and desktop cameras. The traditional frame rate of these cameras is between 10 – 30 fps. It is obvious that a higher frame rate will give a better time resolution and will be helpful in analysing the minute changes that occur in the health parameters over time.Algorithms that negate this drawbackshould be preferred during implementation such that the dependence on hardware design is reduced. |
| As of now most of the PPG signal monitoring techniques focus on monitoring heart rate, respiration rate, heart rate variability and oxyhemoglobin concentration. However, other parameters like blood pressure and blood glucose are quite as important for health monitoring. Currently the acquisition of these parameters is not cost effective when monitored on a regular basis. Image processing has been used to predict the glucose concentration in blood serum [24] based on the light reflected from it. This method requires a blood serum and drawing it is done at the cost of the patient’s comfort. But a more noncontact means of acquiring blood glucose concentration has been developed which focuses on near-infrared spectroscopy [25]. Zalevsky et al. [26] have been successful in measuring heart rate, blood pulse pressure and blood glucose concentration using an optic sensor. But this method requires an accompanying laser for extracting the health parameters. These techniques have to be further improved to give a totally non-invasive technique which can acquire a wide range of health parameters and can also run on portable handheld devices. |
CONCLUSION
|
| In this paper, we did a review of the new trends in photoplethysmographic imaging and processing techniques for extraction of health parametersand proposed a few directions for future work.Photoplethysmographic imaging offers a promising way to monitor health parameters in a non-invasive manner over longer durations. The algorithms discussed above have yet to be compared considering the various aspects such as running window size, region of interest and processing power requirement. The processing power is an aspect of higher importance because algorithms with lower requirements of processing power have a higher execution speed and can be considered for real-time implementations. |
| Also, there is still need for development of techniques for PPG signal extraction using a simple commercial camera to monitor blood pulse pressure and blood glucose concentration. |
References
|
- P. Castellini, M. Martarelli and E.P. Tomasini, “Laser Doppler Vibrometry: Development of advanced solutions answering to technology’sneeds,” Mech. Systems and Signal Process., vol. 20, no. 6, pp. 1265-1285, 2006.
- C. Takano and Y. Ohta, “Heart rate measurement based on a time-lapse image,” Med. Eng. and Phys., vol. 29, no. 8, pp. 853-857, 2007.
- P. Pelegris, K. Banitsas, T. Orbach and K. Marias, “A novel method to detect Heart Beat Rate using a mobile phone,” in Eng. Med. Biol. Soc.,2010 Annu. Int. Conf. IEEE, 2010, pp. 5488-5491.
- H. Liu, Y. Wang and L. Wang, “A Review of Non-Contact, Low-Cost Physiological Information Measurement based onPhotoplethysmographicImaging,” in Proc. 34th Annu. Int. Conf. IEEE Eng. in Med. and Biology Society, IEEE, 2012, pp. 2088-2091.
- P. Sahindrakar, G. de Haan and I. Kirenko, "Improving Motion Robustness of Contact-less Monitoring of Heart Rate Using Video Analysis," thesis of the Dept. of Math.and Comp. Science, Eindhoven Univ. of Tech., Eindhoven, Netherlands, Aug. 2011.
- P. Comon, “Independent component analysis, a new concept?” Signal Processing, vol. 36, no. 3, pp. 287–314, 1994.
- M. Belkin and P. Niyogi, “Laplacianeigenmaps for dimensionality reduction and data representation,” Neural Computation, vol. 15, no. 6, pp.1373-1396, 2003.
- M. Belkin and P.Niyogi, “Laplacianeigenmaps and spectral techniques for embedding and clustering,” in Conf. Neural Information Process.Systems, 2001, vol. 14, pp. 585-591.
- J.-Y. Bouguet, "Pyramidal Implementation of the Affine Lucas Kanade Feature Tracker Description of the algorithm," Microprocessor Research Labs, Intel Corp., Santa Clara, CA, 5, 2001.
- G.Bradski and A. Kaehler,LearningOpenCV: Computer Vision with the OpenCV Library,2nd ed. Sebastopol, CA: O'Reilly, 2008.
- M.-Z. Poh, D. J. McDuff and R. W. Picard, “Noncontact, automated cardiac pulse measurements using video imaging and blind sourceseparation.”Optics Express,vol. 18, no. 10, pp. 10762-10774, 2010.
- P. Viola and M. Jones, “Rapid object detection using a boosted cascade of simple features,” in Proc. 2001 IEEE Computer Society Conf. onComputer Vision and Pattern Recognition, 2001, vol. 1, pp. 511.
- R. Lienhart, and J. Maydt, “An extended set of Haar-like features for rapid object detection,” in Proc. of 2002 Int. IEEE Conf. ImageProcessing, 2002, vol. 1, pp. 900.
- J.-F. Cardoso, “High-order contrasts for independent component analysis,” Neural Computation,vol. 11, no. 1, pp. 157–192, 1999.
- A. Hyvärinen, “Fast and Robust Fixed-Point Algorithms for Independent Component Analysis,” IEEE Trans. Neural Networks, vol. 10, no. 3,pp. 626-634, 1999.
- M.-Z. Poh, D. J. McDuff and R. W. Picard, “Advancements in Noncontact, Multiparameter Physiological Measurements Using a Webcam,”IEEE Trans. Biomed.Eng., vol. 58, no. 1, pp. 7-11, 2011.
- T. E. Brown, L. A. Beightol, J. Koh and D. L. Eckberg, “Important influence of respiration on human RR interval power spectra is largelyignored,” J. Appl. Physiol., vol. 75, no. 5, pp. 2310–2317, 1993.
- L. Wei, Y. Tian, Y. Wang, T. Ebrahimi and T. Huang, “Automatic Webcam-Based Human Heart Rate Measurements Using LaplacianEigenmap,” inProc. 11th Asian Conf. Computer Vision, 2013, vol. 7725, pp. 281-292.
- P. Shi, V. A. Peris, A. Echiadis, J. Zheng, Y. Zhu, P. Y. S. Cheang and S. Hu, "Non-contact reflection photoplethysmography towards effective human physiological monitoring," J. Med. Biol. Eng., vol. 30, no. 3, pp. 161-167, 2010.
- C. G. Scully, J. Lee, J. Meyer, A. M. Gorbach, D. G.-Fraser, Y. Mendelson, and K. H. Chon, “Physiological Parameter Monitoring from Optical Recordings With a Mobile Phone,” IEEE Trans. Biomed. Eng., vol. 59, no. 2, pp. 303-306, 2012.
- M.-Z. Poh, N. C. Swenson and R. W. Picard, “Motion-tolerant magnetic earring sensor and wireless earpiece for wearablephotoplethysmography,” IEEE Trans. Inf. Technol. Biomed., vol. 14, no. 3, pp. 786-794, 2010.
- M. Lewandowska, J. Ruminski, T. Kocejko and J. Nowak, “Measuring Pulse Rate with a Webcam – a Non-contact Method for EvaluatingCardiac Activity,” in Proc.Federated Conf. Comp. Science and Info. Systems,IEEE, 2011, pp. 405–410.
- W. Verkruysse, L. O. Svaasand and J. S. Nelson, "Remote plethysmographic imaging using ambient light," Optics Express,vol. 16, no. 26, pp.21434-21445, 2008.
- A. S. Raja and Z. K. Sankaranarayanan, "Digital Image Processing Technique for Blood Glucose Measurement," Research Journal of MedicalSciences, vol. 1, no. 1, pp. 42-46, 2007.
- K. Xu, Q. Qiu, J. Jiang and X. Yang, “Non-invasive glucose sensing with near-infrared spectroscopy enhanced by optical measurementconditions reproduction technique,”Optics and lasers in Eng., vol. 43, no.10, pp. 1096-1106, 2005.
- Z. Zalevsky, Y. Beiderman, V. Micó, and J. Garcia. (2011, July 12)Biomedical Optics and Medical Imaging: A novel technique for remotelymonitoring key biological parameters Online.. Available: http://spie.org/x48866.xmlDOI: 10.1117/2.1201106.003742
|