Keywords
|
| Wireless Sensor Network, Motes, Transmission Power, MATLAB, TRUETIME |
INTRODUCTION
|
| WSN initially consists of small or large nodes called as sensor nodes [1]. These nodes are varying in size and totally depend on the size because different sizes of sensor nodes work efficiently in different fields. Wireless sensor networking have such sensor nodes which are specially designed in such a typical way that they have a microcontroller which controls the monitoring, a radio transceiver for generating radio waves, different type of wireless communicating devices and also equipped with an energy source such as battery. The entire network worked simultaneously by using different dimensions of sensors and worked on the phenomenon of multi routing algorithm which is also termed as wireless ad hoc networking. |
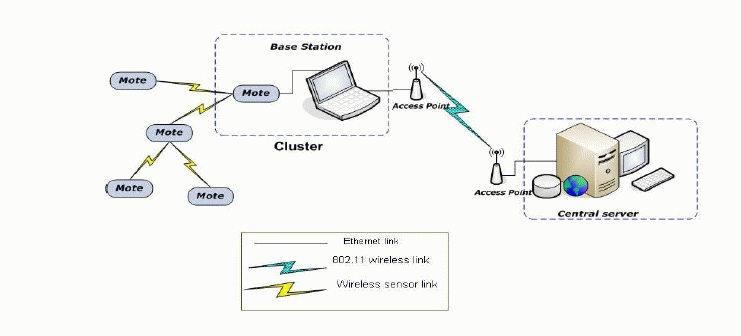
| Each node has one or more sensors integrated on it. In addition to these sensors, a node is also equipped with a transmitter and a receiver. These transmitter and receiver are used for wireless communications with other nodes or directly with the gateway. The gateway is responsible for transmitting sensor data from the sensor patch to the remote base station that provides Wireless Ad-Hoc Network (WANET) connectivity and data logging through a local transit network. Finally, the data is available to researchers through a user interface. The scenario of Wireless Sensor Network is shown in figure 1. |
| The remainder of this paper is organized as follows: Section 2 gives brief idea about motes. An overview of the Matlab Truetime is given in Section 3. Section 4 describes the Simulation set up and results. Section 5 presents the conclusions from our study and future scope. |
MOTES
|
| Wireless Sensor Networks, also known as Sensory Networks or Sensitive Networks and abbreviated in English to (WSN), consist of a series of small electronic devices that access the outdoor world by means of sensors. The name given to this type of device is “mote” [2], from the phrase “mote of dust”, with the idea of conveying two main concepts in just one word: their small size and the idea that they can be placed anywhere. This concept gave rise to the formation of Dust Networks and to the nickname Smart Dust. Other ways of denoting a mote include Sensory Node or Sensor Node. |
| Sensor networks-based monitoring applications range from simple data gathering, to complex Internet-based information systems. Motes run the network embedded programs that mainly sleep, and occasionally acquire, communicate, store and process data. |
| The other parts of a sensor node are the microcontroller and the battery (as the energy source). Battery-powered embedded systems, such as WSN motes, require low energy usage to extend system lifetime. WSN motes must power sensors, a processor, and a radio for wireless communication over long periods of time, and are therefore particularly sensitive to energy use. Recent techniques for reducing WSN energy consumption, such as aggregation, require additional computation to reduce the cost of sending data by minimizing radio data transmissions. Larger demands on the processor will require more computational energy, but traditional energy reduction approaches, such as multi-core scaling with reduced frequency and voltage may prove heavy handed and ineffective for motes. Battery-powered embedded systems carefully manage energy consumption to maximize system lifetime. WSNs, made up of many “mote” devices, and are often designed to operate for months without intervention. |
| The most important consideration for a WSN is power consumption. While the concept of WSN looks practical and exciting on paper, if batteries are going to have to be changed constantly, widespread adoption will not occur. Therefore, when the sensor node is designed power consumption must be minimized. |
MATLAB:TRUETIME
|
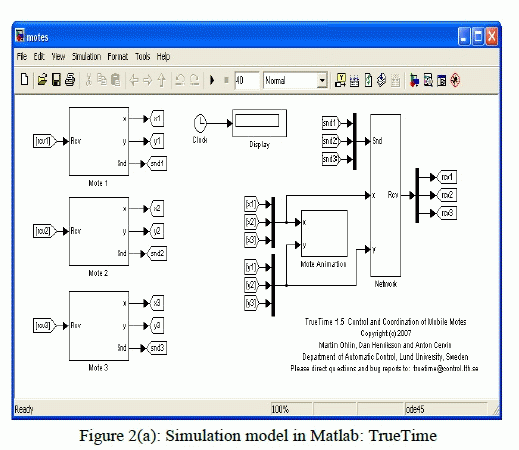
| TrueTime is a Matlab/Simulink-based simulator for networked and embedded control systems. The simulator software consists of a Simulink block library and a collection of MEX files [3, 4]. The kernel block simulates a real-time kernel executing user-defined tasks and interrupt handlers. The various network blocks allow nodes (kernel blocks) to communicate over simulated wired or wireless networks [4]. The latest release, TrueTime 1.5, also features a couple of standalone network interface blocks that makes it simpler to develop networked control simulations. A TrueTime simulation is programmed in much the same way as a real embedded system. The application is written in Matlab code or in C++. The main difference from real programming is that the execution/transmission times must be specified by the developer. This approach makes TrueTime a very flexible co simulation tool. Also, the step from simulation code to production code is not that large. |
SIMULATION SETUP & RESULTS
|
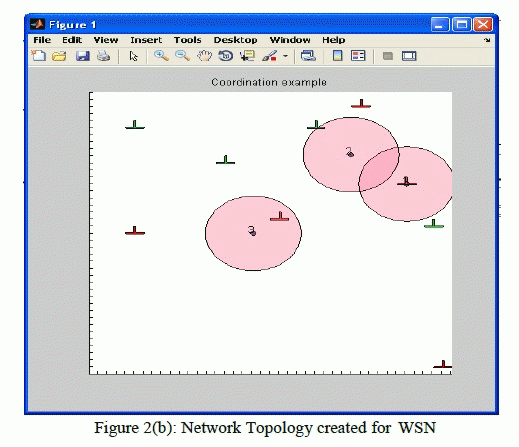
| In the simulation model the movements of dynamically moving motes using the built in functionality of Matlab is used. The example consists of three motes, with dynamics in the x and y directions modeled using simple integrators. The motes are sent out on a mission which consists of visiting a number of checkpoints seen as red marks in the animation window in Figure 2. In the window, the transmission range of the motes can be seen as large partly transparent colored circles around the smaller colored motes. The checkpoints should be visited at least once by some node in the group. When the motes are able to communicate, they tell each other where they are heading and share information on which nodes that have been visited by the group. Some of this information is visible as printouts during the execution. When a checkpoint has been visited it changes color from green to red. The motes operate according to the following algorithm[4]: |
| 1. Read new network messages containing information of: visited nodes target of the sending node |
| 2. If (someone has the same target as we do && we have the lowest priority), then change target |
| 3. If (heading to a place that has already been visited), then change target |
| 4. If (arrived at target) then paint the target green && change target |
| 5. Send new network messages to other nodes |
| The simulation results were carried out using TrueTime toolbox of MATLAB [5, 6]. Motes with random topology and 9 nodes were simulated. The performance was evaluated for Signal Reach, Visiting Priority using variation in transmission power of each node. The model structure of Motes was as shown in figure 2(a). The figure 2(b) shows the random topology for wireless sensor network used for simulation. |
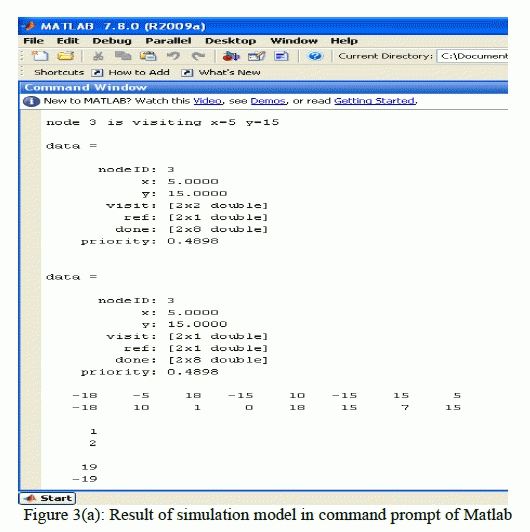
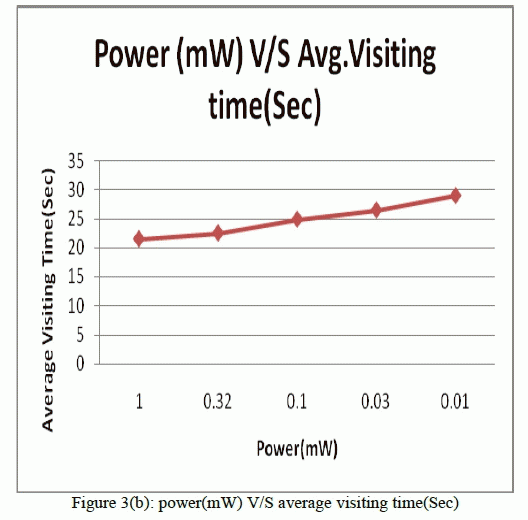
| Figure 3(a) depicts the result of simulation model in matlab command prompt which gives the information about which node visits the visiting point , with some specific priority. Also it shows the list of visited points, remaining visiting points and referred visiting point by the nodes. Figure 3(b) shows the average visiting time taken by all the nodes to visit the visiting points in network. From this it can be observed that as the power decreases the average visiting time taken by the nodes increases. |
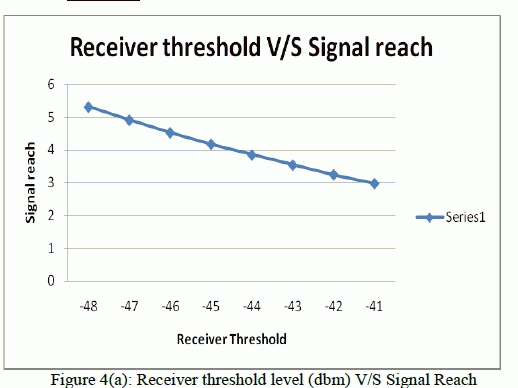
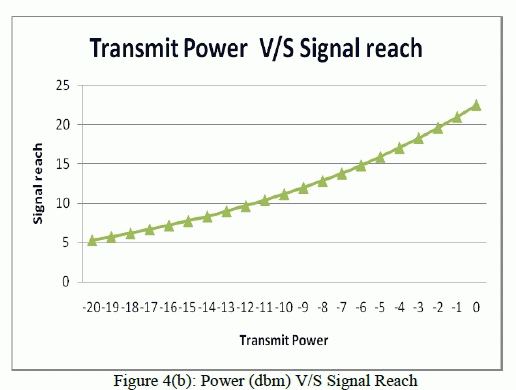
| Effect of changes in Received threshold level and transmission power on Signal Reach explained in Figure 4(a) and (b) respectively. As the receiver threshold level increases signal reach of the node decreases. It can be observed from figure 4(b) that as transmission power increases, signal reach of the nodes also increases. |
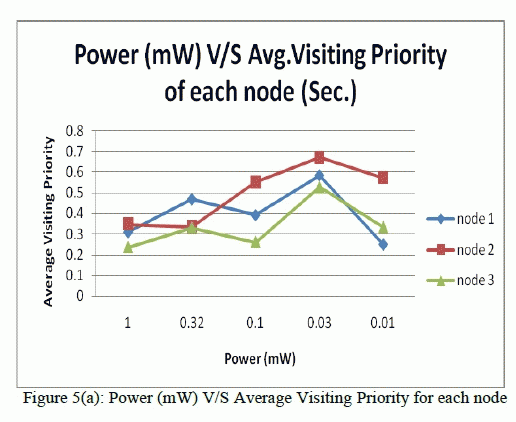
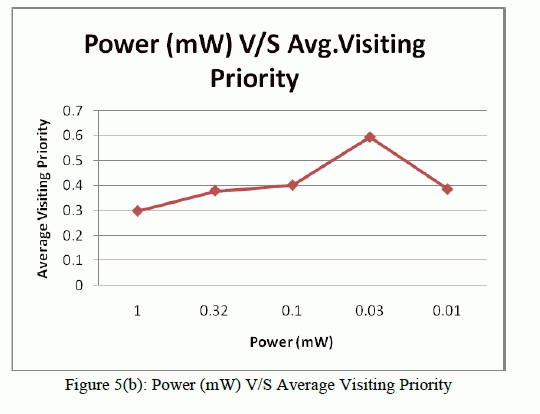
| Figure 5(a) depicts the change in average visiting priority of the node 1, 2, 3 with respect to change in transmission power of each node. It can be observed that as power decreases, priority also decreases for each node. Figure 5(b) shows the effect of change in power to the average visiting priority of the all nodes. As power decreases, the average priority for the nodes in network also reduces. |
CONCLUSION & FUTURE SCOPE
|
| From this simulation study it can be concluded that as the signal transmission power increases for each node, performance of WSN also improve. Also the signal transmission power of each node increases then the node’s signal reach increases and the nodes can communicate with each other easily and they require the less visiting time and recover all the information from all the visiting point. WSN consist of battery operated nodes and it is not suitable to increase the power to improve the performance of network. So the suitable algorithm can be used to determine the optimized value of the transmission power for each node so that in less amount of power performance can be improved. Also soft computing techniques can be applied to determine the optimized value the transmission power. |
ACKNOWLEDGMENT
|
| Authors are thankful to Dept. of Elect. Engg., Faculty of Tech. & Engg., M.S.University of Baroda for technical help in doing this work. |
Figures at a glance
|
 |
 |
 |
 |
 |
| Figure 1 |
Figure 2 |
Figure 3 |
Figure 4 |
Figure 5 |
 |
 |
 |
 |
| Figure 6 |
Figure 7 |
Figure 8 |
Figure 9 |
|
| |
References
|
- Mohammad Ilyas, and ImadMahgoub, Handbook of sensor networks: compact wireless and wired sensing systems. CRC Press LLC, 2005.
- Sensor Network Motes: Portability & Performance, Ph.D. dissertation by Martin Leopold
- JAntonCervin, Martin Ohlin, Dan Henriksson ‘Simulation of Networked Control systems using Truetime’, Department of Automatic Control LTH,Lund University.
- M. Ohlin, D. Henriksson, and A. Cervin, "TrueTime 1.5 — Reference Manual," Department of Automatic Control, Lund University, Sweden, 2007.Available: http://www.control.lth.se/truetime.
- Alberto Cardoso, Sergio Santos, Amancio Santos and Paulo Gil “Simulation Platform for Wireless Sensor Networks based on the TrueTime Toolbox”.
- Website: WWW.MATHWORKS.COM TheMathworks Inc.
|