Keywords
|
| Batteries, Ah-capacity, Cycle Life,Lithium Iron Phosphate, capacity fade. |
INTRODUCTION
|
| The ever-increasing concern in global energy demand, fuelled by the depletion of fossil fuels, has driven the search for renewable energy as a potential alternative and/or as a main stream energy source. Renewable energy is generally produced using several methods and solarphotovoltaic are among the most rapidly developing ones. Because the energy delivery through energy conversion from renewable sources is unpredictable and intermittent, combination with energy storage systems (ESSs) is required to improve the system reliability and efficiency [1]. Rechargeable electrochemical batteries have been dominating the field of renewable ESSs,where LFPbattery that uses the Commercial-grade graphite and LiFePO4 were, respectively, used as negative and positive electrode.Long-term reliability is one of the key factors for the utilization of battery ESS. In terms of cycling stability and energy density, graphite remains the first choice among the Anode (-ve) electrode materials [2]. LiFePO4 has attracted much attention as a promising cathode (+ve) electrode material because of the low cost, Fe availability, good electrochemical cycling stability, and environmentallyfriendliness [3]. At present, the combination of thegraphite negative electrode and the LiFePO4 positive electrode foruse in Li-ion batteries is one of the most promising cell chemistryfor ESS application on the basis of several factors such as cost,energy density, and cycling stability [4][5]. |
| It is known that many battery research institutes have put together a lot of efforts to develop “Battery Cycle-Life Test Procedure” in their Laboratories and estimated accordingly thecycle-life of a battery. Probably this kind of study takes several years to come to a conclusion. These tests have been made mainly in the areas of electric car, plug-in hybrid cars and stationary application with high rate of discharge 3C to 5C [6].The general approach inthis method, the unique operational profiles that ESS batteries are exposed to, and the testing requirements needed to simulate the realistic load cycle profile in a laboratory environment, using a variety of load profiles including constant current discharge, pulsed discharge, and varying depths of discharge is indeed a huge task [7][8]. In addition to this it is also a common practice to make a cycle test with a bit accelerated mode using climate chambers. Most of this tests have been carried upon disassembled fully discharged cell were the electrodes thenanalyzed using: high tech instruments such as X-ray diffraction (XRD),and fieldemission scanning electron microscope (FE-SEM, JEOL JSM-7000F) with energy dispersive X-ray spectroscopy (EDS) for the observation of morphology and microstructure of the electrodes [6 ] [9]. In this study an attempt has been done to evaluate the life cycle & capacity fades of LFP battery using standard laboratory equipments which is very typical for developing countries using terminal characteristics. |
| Batteries in PV systems continually suffer from limited power for recharge and extended periods when they are left in a partially charged condition[11]. Over the last few years there has been a significant effort by the PV Global Accreditation Program (PV GAP), the IEEE Standards Coordinating Committee 21 (IEEE SCC21), and the International Electro technicalCommission (IEC) to develop standardized test procedures for batteries used in standalone PV systems. Almost all of them are laboratory based studies using sample cycle-test and make predictions based on the results[12]. PV battery test procedures in general duplicate the shallow cycling, deficit-charge cycling, low charge and discharge rates, and limited recharge or finish-charge as found in PV systems.In this study, a two year field data is collected,and the data isstatistically analyzed. Capacity fade and estimation of cycle-life have been calculated. Study Area: Five systems have been installed in a village called “Sekekello” which is 5-8km away from Adama, in the Oromia Regional state of Ethiopia.The location of the site is (08:32N, 039:16E) and average Elevation of 1627meters. The village has got inhabitants of about 350 to 500households and it is totally un-electrified (The study also takes this opportunity to introduce the PV- solar technology to the community). |
AIM AND APPROACH
|
| This study aims to study the natural capacity fade of a battery as used exactly there in the field for a period of 24 months.Based on the data collected over these periods, the capacity fades and cycle life of these batteries has been estimated. |
| In order to achieve this aim the following approaches were followed. |
| i. Five systems (Pico) withLiFePO4, 18650 (cylindrical shape), nominal capacity of 42000mAh and a nominal voltage of 3.3 volt battery were distributed in the village. |
| ii. The initial Capacity of the batteries were measured and recorded prior to deployment |
A. Details of the test:
|
| I. Charge and discharge capacities were measured at 0.1C. |
| II. External environmental factors like Temperatures weren’t taken into account due to the limitation of measuring instrument and lab facilities |
| III. Another five replacement batteries were distributed to give service to the users when the samples were brought to lab for capacity testing at further training Institute Laboratory of Adama science and Technology University, Adama Ethiopia. (On the average this takes 2-to-3 days). |
| IV. Charge Professional ALC 850 Expert 2 was used for a capacity Measurement |
| V. Finally Excel 2010 is used to analyze the data (for Interpolation and extrapolation). |
EVALUATION OF CYCLE-LIFE OF THE BATTERY
|
| The most common quoted measure of cell or battery life is the cycle-life. It is usually defined as the number of cycles completed before the current capacity falls to less than 80% of the capacity when new[13]. Alternatively, for high power batteries, the useful cycle life sometimes is defined as the number of cycles completed before the internal impedance increases to double the value it was when new. |
| However in this work the first definition has been used. Using simple equation |
| Ccll=Cinit-(20% of Cinit) (1) |
| where Ccll:cycle life limit |
| Cinit: initial capacity |
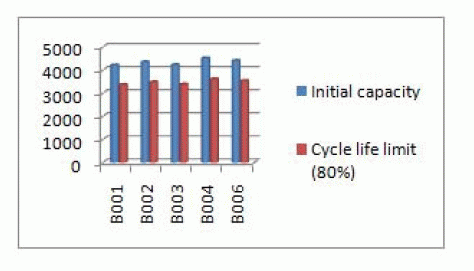
| The measured initial capacity and the cycle-life capacity limit are shown in Table 2. |
RESULTS AND DISCUSSION
|
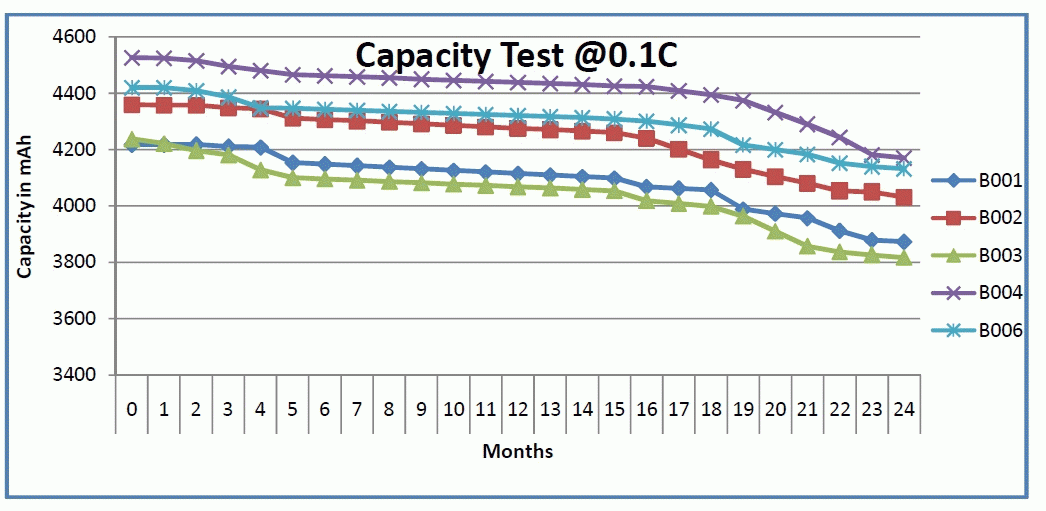
| The result from the capacity test is shown below in fig2. |
A.1 The capacity fade
|
| Battery capacity fade in this test procedure was defined by using equation (2) |
 (2) (2) |
| Accordingly results from capacity fade are shown in Table (3) |
A.2Estimation of Cycle-life
|
| As it is depicted from the capacity test results in fig 2, the curves are not linear as can be expected.Correspondingly in this paper the life-cycle of these batteries was estimated using the following methods. |
| I. A good curve fitting were achieved using trend function of excel with polynomial of degree 4 to 5, however the estimation result from this test shows exponential increase in capacity, which couldn’t be explained theoretically, therefore, the curves were smoothed using moving average and center moving average methods to approximate a linear relationship. The estimation made based on this linearized trend line gave the results shown in table 4, which could be considered as roughly good estimation based on practical field data that supports the estimation made by most manufacturers in the laboratory (> 2000 cycles) [14]. |
B. Discussion
|
| Fig1. Illustrates actual measured capacities of the Lithium iron phosphate (LFP). The data were collected over the course of two years. Percentage capacity degradation was calculated using equation (2) and shown in Table 3,the average capacity fade has been found to be 8% of the initial measure capacity. The life-cycle estimation of this battery has been shown in Table 4. The averagecycle-life has been found to be 6 years and 5 months (6.5 yrs) which is almost double that of the lead acid (Pb) batteries. |
C. Conclusion
|
| Life cycle estimation is usually done using cycling (Charging & Discharging) under some specified condition, sometimes this is done with a slightly accelerated manner in the laboratories. In this paper, an actual field data has been collected for two years and analyzed for capacity fade and cycle-life estimation. |
| The result shows that the average capacity fade of 8% of the initial measured capacity observed, and the average cycle life of about 6.5 years, that complements well the experience so far from the laboratory and the specification given by the manufacturer. |
| The battery is said to be reached its end of life if it fails to deliver 80% of it ratedcapacity (or degradation of more than 20% of its rated capacity). |
| The result here can be used as a guide line in future works elaborated and collect the field data for several years for forecasting the cycle life of LFP batteries and to study the capacity fade. Furthermore it might be used as basisto Life Cycle Cost evaluation (LCC) of this battery, to study the economic competitivenessagainst lead acid (Pb) or nickel metal hydride (NMH). Experience shows that Lithium based batteries so far incur high initial cost than similar capacity batteries employing other chemistries.However, Lithium batteries have high energy density, long cycle life and more readily recyclable. These factors contribute to less life cycle costthat needs to be studied next. |
ACKNOWLEDGEMENT
|
| The author is grateful to FTI-Adama science & Technology University, DAAD, Applied Science University of Ulm (HS-Ulm) Germany and FoseraSolarsystems GmbH & Co. KGaA. |
Tables at a glance
|
 |
 |
 |
 |
| Table 1 |
Table 2 |
Table 3 |
Table 4 |
|
| |
Figures at a glance
|
 |
 |
| Figure 1 |
Figure 2 |
|
| |
References
|
- Dunn, H. Kamath, J.-M.Tarascon, Science 334 (2011) 928.
- Scrosati, J. Garche, J. Power Sources 195 (2010) 2419.
- B.L. Ellis, K.T. Lee, L.F. Nazar, Chem. Mater. 22 (2010) 691.
- K. Striebel, A. Guerfi, J. Shim, M. Armand, M. Gauthier, K. Zaghib, J. Power Sources 119e121 (2003) 951.
- J. Shim, K.A. Striebel, J. Power Sources 119e121 (2003) 955.
- Jae-Hun Kim, Sang Cheol Woo, Min-Sik Park, Ki Jae Kim, TaeeunYim, Jeom-Soo Kim*, Young-Jun Kim, Journal of Power Sources 229 (2013) 190e197
- Test Results from the PV Battery Cycle-Life Test Procedure Tom Hund Photovoltaic System Applications DepartmentSandia National Laboratories Albuquerque, NM 87185-0753
- TA Abera, G.Bekele,T.Walter, Peter “A. Performance Evaluation of Different Batteries for Standalone Solar Photovoltaic System Application(Pico-System)”,International Journal of Electrical Electronics and Telecommunication Engineering, 1384 ISSN: 2051-3240, Vol.45, Issue.1pp1384 -1388
- Scott B. Peterson, Jay Apt, J.F. Whitacre, Journal of Power Sources 195 (2010) 2385–2392
- Q. Hao, Z. Jianhui, L. Jih-Sheng, Y. Wensong, IEEE Trans. Power Electr. 26 (2011) 886.
- “AMP-HOUR COUNTING CHARGE CONTROL FORPHOTOVOLTAIC HYBRID POWER SYSTEMS” 26th IEEE Photovoltaic Specialists Conference, Anaheim, Sept. 1997
- Evaluation of Lithium Iron Phosphate Batteries forElectric Vehicles Application 978-1-4244-2601-0/09/$25.00 ©2009 IEEE
- J. Wang, P. Liu, J. Hicks-Garner, E. Sherman, S.
- Soukiazian, M. Verbrugge, et al., “Cycle-life model forgraphite-LiFePO4 cells”, Journal of Power Sources 196(2011) 3942-3948.
- LiFePO4 38120(38105) Specifications
|