Keywords
|
| Image fusion using single image, contrast enhancement, exposure fusion and image fusion. |
INTRODUCTION
|
| Digital cameras and smart phones have been widely used to acquire photographs in our today’s modern life. However, digital cameras and smart phones have a limited dynamic range, which is much lower than that our eyes can perceive. Therefore, people are not always pleasing with the photographs captured in high dynamic range scenes because they often exhibit under-exposure or over-exposure artifacts in shadow or highlight regions. The common problems found in live images are: 1) a normal image with proper illumination/exposure but some regions are slightly underexposed, 2) a backlight image with over-exposed and/or under-exposed regions, 3) a low-contrast image due to insufficient illumination/exposure and 4) a dark scene image which were taken in the night without using a photoflash. If the exposure/contrast of the acquired image is improper, a post-processing procedure using an image enhancement method is needed in order to produce an image having better quality than before. Many image enhancement methods were developed to solve these problems. In general, image enhancement methods can be classified into four categories: 1) histogram-based methods [1]-[11], 2) transform based methods [1], [12], [13], 3) exposure-based methods [14], [15], and 4) image fusion based methods [16]-[18]. |
| Histogram equalization (HE) [1] is the most well-known technique for image enhancement. This method uses a nonlinear mapping function to produce an enhanced image with its histogram approximating a uniform distribution. But, HE fails to produce pleasing pictures because of three common drawbacks: 1) false contour 2) washed-out appearance 3) amplified noises. Pizer et al. [2] proposed a method called adaptive histogram equalization in which first an image is divided into several non-overlapping blocks. Then, HE is applied on each block independently. Finally, the enhanced blocks are fused using bilinear interpolation to reduce blocking artifacts. Some brightness preservation HE methods [3]- [11] have tried to preserve the original brightness to a limit, which is essential for consumer electronic products and these methods first divide the histogram into two [3]-[8] or more [9]-[11] sub-histograms and then apply HE on each subhistogram independently. The main disadvantage of brightness preservation methods is that sometimes they may produce unnatural artifacts because some regions may be enhanced excessively. |
| In transform-based methods [1], [12], [13], a transformation function (e.g., power-law or logarithmic function) is defined to map input luminance values into output one. These methods were widely provided in many consumer electronic products. Typically, some device-dependent parameters should be specified in advance. The transform-based methods can produce a properly enhanced image for either under-exposed or over-exposed images by selecting appropriate parameters [1]. But, if an image is affected by both under-exposed and over-exposed regions, these methods fail to produce proper contrast on both regions. Moroney [12] proposed an approach based on pixel-by-pixel gamma correction with a non-linear masking. The gamma correction of each pixel depends on the values of its neighboring pixels also. Nevertheless, it may produce halo effects near edges of image. Thus, Schettini et al. [13] proposed a local and image-dependent exponential correction function for contrast enhancement in which the bilateral filter is used as the mask of the exponential correction function to reduce the halo effect. However, the global contrast of the whole image was reduced by using this approach. |
| Exposure-based methods [14], [15] have tried to adjust the exposure level of an image using a mapping function between the light values and the pixel values of desired objects. Battiato et al. [14] has proposed an exposure correction approach using the camera response curve to adjust the exposure levels. Since this approach was specifically designed for desired regions, it can produce pleasing results in desired regions; whereas it may lead to poor illumination in other regions. Safonov et al. [15] has developed a method for global and local correction of various exposure defects. This approach is based on contrast stretching and alpha-blending of the brightness of the original image and the estimated reflectance. The main problem with this approach is that it might exhibit insufficient illumination for some regions. |
| Image fusion based methods [16]-[18] aimed to combine relevant information from more than one images taken from the same scene to produce a fused image, which is more informative than individual image. In these methods, several “virtual images” have to be generated from a single original image before doing image fusion. Hsieh et al. [16] have used a linear function to fuse the input image and histogram equalized image to get a fused image. Pei et al. [17] generated two images, a histogram equalized image and a sharpened image using Laplacian operator, and then fused their discrete wavelet transform (DWT) coefficients (approximate and detailed) to generate a fused image which is having higher contrast and sharpness. Lim et al. [18] have applied an intensity mapping function to the input image to generate multiple images having different exposure. The intensity mapping function can be either estimated from a set of images captured by the same camera in order to imitate the camera response function or expressed explicitly in terms of a power-law function. In the first case, several images captured by the same camera should be provided for learning the camera response function. In the second case, parameters of the power-law function should be chosen carefully for getting a high contrast fused image. |
| In this study, an image fusion based approach, named classified exposure image fusion, will be proposed for image contrast enhancement. The major contributions are as follows. First, a function following the F-stop concept in photography is designed to generate several virtual or pseudo images having different intensity. Second, a classified image fusion method, which blends pixels in distinct luminance classes using different fusion functions, is proposed to produce a fused image in which every image region is well exposed. |
PROPOSED APPROACH FOR IMAGE CONTRAST ENHANCEMENT AND IMAGE WELLEXPOSEDNESS USING SINGLE ORIGINAL IMAGE
|
| In this study, an image fusion based approach will be proposed for image contrast enhancement. Image fusion techniques have been widely developed for producing high quality images in many applications such as remote sensing [19]-[21], medical imaging [21], high dynamic range imaging (HDRI) [21]-[23], multi-focus imaging [21], [24], etc. In remote sensing and/or medical imaging, the input images taken from different sensors which is having different spatial and spectral properties, are combined to produce a high quality fused image. In HDRI, several input images captured with distinct exposure time are combined together to produce a wide dynamic range image. In multi-focus image fusion, some input images taken using variant foci, with each one containing some objects in focus, are fused together to produce an image with all relevant objects are in focus. Acquisition of several images having different exposure or foci is obviously a prerequisite for these applications. However, for image contrast enhancement, if only one input image is given, then several “pseudo images” or “virtual images” can be generated from the input image to realize an image fusion system. |
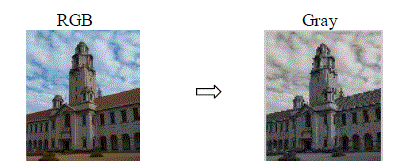
| Since the proposed approach works on grayscale image, each input color image is first converted to the gray scale image. In this study, the gray scale value of each pixel is converted from the red, green, and blue color values using the following function: |
| I(x, y) = 0.299 * R(x, y) + 0.587 *G(x, y) + 0.114* B(x, y) (1) |
| where, R(x, y), G(x, y), and B(x, y) denote the red, green, and blue color values of a pixel at (x, y) location. Then, several virtual images having different intensity value, realized by setting different F-stops, will be generated. At the same time, a fast algorithm for multilevel thresholding will be applied to classify all pixels of input image into different three luminance classes according to their intensity values. Then, weight-map generation procedure is done using JND based contrast measure and exposedness measure. Finally, a classified image fusion method, which fuses pixels in distinct luminance classes using different fusion functions, will be proposed to produce a fused image with appropriate exposure on every image region. The block diagram for the proposed approach is depicted in Fig. 2. |
| a). Generation of Virtual Exposure Images |
| While considering photography, exposure indicates that how much light will reach the image sensors on digital cameras. Therefore, to determine the proper exposure, we have to select an appropriate combination of shutter speed and F-stop. Shutter speed controls how long the shutter is open, indicating the exposure time that the light of the scene reaches to the image sensors. F-stop function value controls the size of the aperture, which is the hole the light of the scene passes through in a digital camera. At present, modern digital cameras use a standard F-stop scale, which is an approximately geometric sequence of numbers that corresponds to the sequence of the powers of the square root of 2. Specifically, the standard F-stop numbers are as follows: F1.4, F2, F2.8, F4, F5.6, F8, F11, F16, and so on. Every Fstop represents a doubling/halving of the amount of light from its immediate successor/predecessor. For example, F2.8 allows the double of light through than F4. In this study, we take a half-step along this scale to create an exposure difference of "half a stop". It means the generated luminance values associating with each pixel approximate a geometric sequence with a common ratio 2. Let I(x, y) denote the luminance value of the input image I at location (x, y), and assume that each grayscale value is an integer value in the interval [0, 255]. The grayscale value of each pixel in the kth virtual image Ik can be expressed as following function for variant F-stop value: |
 (2) (2) |
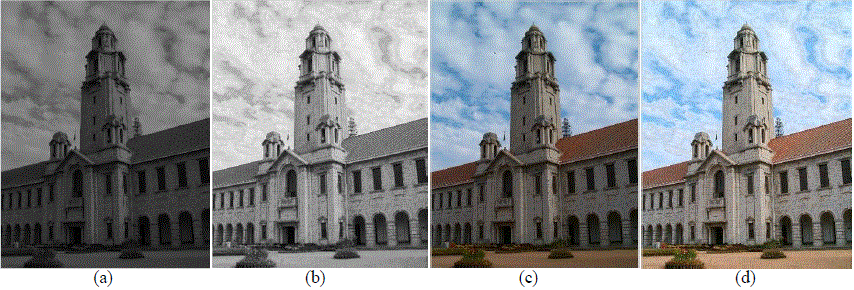
| Here, N high exposure brighter images (with k = -N, -N+1, …, -1) and N low exposure darker images (with k = 1, 2, …, N) will be generated first (see Fig. 3). From these generated pseudo exposure images, we can see here that, as the exposure increases, dark regions become clearer whereas brighter regions become saturated. |
| Among these 2N+1 virtual images, only those images having some relevant informative regions will be selected for image fusion. That is, those images which are completely under-exposed or completely over-exposed will not be used in the image fusion process in an attempt to get a high informative fused image. To this end, an anchor image (the image with the most appropriate exposure) among these 2N+1 virtual images will be selected first. The anchor image as well as its preceding M (M ≤ N) lower exposure images and its succeeding M higher exposure images resulting in a set of images consisting of 2M+1 images will be used for image fusion. The anchor image is found by evaluating the average luminance of each virtual exposure image. Let μk denote the average luminance of all pixels in kth virtual image. The exposure image with its average luminance value closest to 128 (the middle value of the luminance interval [0, 255]) will be selected as the anchor image. That is, the index anc of the anchor image Ianc can be determined by the following equation: |
 (3) (3) |
| Besides Ianc, its preceding M lower exposure images and succeeding M higher exposure images, denoted by Ianc-M, …, Ianc, …, Ianc+M, will be equivalent to the set of virtual images for image fusion. |
| b). Image Pixel Classification |
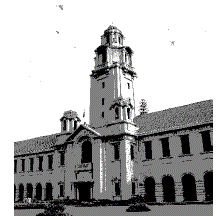
| In this study, the pixels in the input image will be classified into three different classes. That is, dim class (denoted by IL), well-exposed class (denoted by IM), and bright class (denoted by IH), according to their luminance values. From the classification result, pixels in different classes will be blended using different fusion functions. To this end, the multilevel thresholding algorithm proposed by Liao et al. [25] is used to find two thresholds, denoted by Thd0 and Thd1 (Thd0 < Thd1), such that the input image I can be decomposed into three sub-images: |
 (4) (4) |
| Where, IL, IM, and IH respectively consist of pixels with luminance values smaller than Thd0, in-between Thd0 and Thd1, and larger than Thd1: |
 (5) (5) |
 (6) (6) |
 (7) (7) |
| Fig. 4 shows the image pixel classification result of the input image shown in Fig. 3(f). We can see that the pixels in the sky region belong to bright class, some of the pixels in the central building and the windows in the building belong to dim class, and the others are attributed to well-exposed class. To provide proper exposure on every region, the proposed CEIF approach aims to blend pixels in distinct classes using different fusion functions. |
| c). Classified Image Fusion |
| In this study, a weighted average approach will be employed to blend together the 2M+1 virtual images with weights computed from the proposed quality measure [26]. First, a weight map, determining the contribution of each pixel to the fused image, is generated for each virtual image to guide the fusion process. Mertens et al. [26] combined the information from different measures, including contrast, saturation, and well-exposedness, into a scalar weight value for each pixel. Since the proposed classified image fusion method is applied on the luminance image, the weight map considers only the contrast and well-exposedness measures. The contrast measure tries to preserve the detailed parts such as edge or texture information of an image. The well-exposedness measure is used to find proper exposure for each pixel. In this approach, we combine the concept of just-noticeable-distortion (JND) model of the human visual system (HVS) in the contrast measure in order to prevent from amplifying noises. Further, for each pixel, a classified well-exposedness measure is proposed to find its appropriate luminance value. |
| 1) JND-based Contrast Measure: In this approach, the JND model of HVS is combined in the contrast measure to prevent from amplifying noises. For a pixel p located at (x, y) in virtual image Ik, we first compute the maximum, minimum, and average luminance values of its eight neighbors within the 3×3 window centered at p(x, y), denoted by Ik max(x, y), Ik min(x, y), and Ik avg(x, y). Then, the difference between Ik max(x, y) and Ik min(x, y) is evaluated: |
 (8) (8) |
| This difference value provides a measure of the contrast value around pixel p. If this difference value is smaller than the visibility threshold of HVS, indicating that there exist no visible edges of texture information around pixel p, we set the contrast value 0. Otherwise, the contrast value is set as Ik dif(x, y). In addition, because different quality measures have distinct dynamic ranges and to prevent from the computed weight values being zero, we set the contrast value of pixel p as follows: |
 (9) (9) |
| Where, Ck t(x,y) denotes the contrast value of pixel p, JND(·) is the visibility threshold function providing the JND that HVS can perceive. In this study, the JND model proposed by Chou and Li [27] is implemented to design the visibility threshold function, which can be described by the following equation: |
 (10) (10) |
| Where, g is the luminance value in the interval [0, 255], the parameters T0 and γ depend on the viewing distance between tester and monitor. In this study, T0 and γ are set to be 17 and 3/128 according to the subjective experiments done by Chou and Li [27]. |
| 2) Classified Well-exposedness Measure: Well- exposedness evaluates how well a pixel is exposed. Traditionally, a luminance value close to the middle value of the luminance interval is considered as well-exposed, whereas a luminance value near the boundary of the luminance interval is regarded as poor-exposed. This way, the well-exposed measure is generally defined by the following Gaussian function [26]: |
 (11) (11) |
| Where, 128 (the desired target luminance value) is the middle value of the luminance interval [0, 255], Ek t(x, y) denotes the well-exposedness value of the pixel located at (x, y), σ is the standard deviation of the Gaussian curve (set as 0.2×luminance range). This definition gives those pixels with luminance value close to 128 a larger well-exposedness value and a smaller weight value is assigned to those pixels with luminance values close to 0 or 255. Nevertheless, such a definition does not consider the original brightness of the pixels in the selected image. That means, the luminance values of both dark and bright pixels will be moved toward 128 in the fused image. As a result, the global contrast of the resultant image will be reduced although all pixels are well exposed based on the well-exposedness measure defined in (11). To cope with this problem, the proposed classified well-exposedness measure defines distinct desired target luminance values for pixels belonging to different classes. Specifically, pixels in well-exposed class (IM) have a desired target luminance value of 128, whereas pixels in bright class (IH) and dim class (IL) will be assigned a desired target luminance value larger than 128 and smaller than 128 respectively. Let μL and μH denote the average luminance values of all pixels in IL class and IH class respectively. The desired target luminance value for pixels in IL, denoted by YL t, is defined by the following function: |
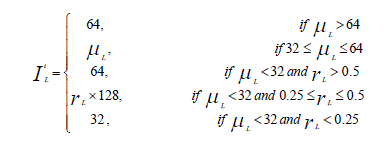 (12) (12) |
| where, rL is the proportion of the number of pixels in IL, that is, |
 (13) (13) |
| Where, NL, NM, and NH are the number of pixels in IL, IM, and IH respectively. Here note that the desired target luminance value for pixels in IL is defined in the interval [32, 64] according to the luminance distribution. If μL > 64, indicating that the input image is a bright image, we set the desired target luminance value as 64. Whereas, if μL < 32, indicating that the input image is a dark one, the desired target luminance value for class IL will be defined according to the proportion of the number of pixels in IL, rL. If rL is large, indicating that the input image consists of many dark pixels, a large desired target luminance level is selected, and vice versa. |
| For pixels belonging to well-exposed class IM, the desired target luminance value is defined 128 as follows: |
 (14) (14) |
| Since the luminance values of dark pixels are often set toward higher ones, to preserve and even increase the global contrast of the fused image, the desired target luminance value in bright class IH, IH t , is defined in a similar way. Specifically, IH t is defined as follows: |
 (15) (15) |
| According to the definition of desired target luminance values for different luminance classes, the classified wellexposedness measure can be defined as follows: |
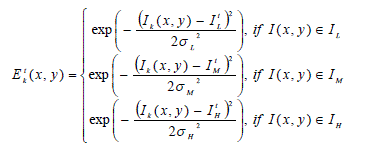 (16) (16) |
| where, σL, σM, and σH are the desired target standard deviation of the Gaussian curve for class IL, IM, and IH (in this study, we set σL = 32, σM = 64, and σH = 32). |
| 3) Classified Weight Map Generation: Finally, the weight map, Wk t , associated with virtual image Ik (k = anc- M, …, anc+M) is obtained by combining the information from both JND-based contrast measure and classified wellexposedness measure through multiplication: |
 (17) (17) |
| To obtain a consistent result, we normalize the weight values of the 2M+1 weight maps such that for each pixel location the sum of the 2M+1 weight values equals one: |
 (18) (18) |
| Fig. (5) Shows the result for weight maps of different virtual exposure images. |
| 4) Classified Image fusion in DWT domain: In this study, the proposed classified image fusion is performed in the discrete wavelet transform (DWT) domain to avoid annoying seams at pixels having sharp weight value transitions [28]. |
| This process accomplishes one level of decomposition and results in four low-resolution subimages, denoted by LL, LH, HL, and HH. The subimage LL corresponds to a coarse approximate image, whereas the subimages LH, HL, and HH correspond to vertical, horizontal, and diagonal details. For multi-resolution wavelet decomposition, the subimage LL can further be decomposed into the other four subimages using the same decomposition procedure. Such a decomposition process is repeated until the desired number of levels determined by the application is reached. If Llevel of wavelet decomposition is performed, we can obtain 3L+1 subimages. |
| The reconstruction of the image can be carried out by reversing the above decomposition procedure level by level until the image is fully reconstructed. |
 (19) (19) |
| where, Fl,θ(x,y) is the fused wavelet coefficient located at (x,y) in the wavelet subimage with direction θ and level l. By applying inverse DWT on these wavelet subimages, we can reconstruct the fused image F. |
| From the fused luminance image F, the R, G, B color values of each pixel can be reconstructed by using the following formula in order to prevent relevant hue shift and color desaturation: |
 (20) (20) |
 (21) (21) |
 (22) (22) |
CONCLUSION
|
| In this study, contrast will be enhanced by doing fusion but here we are having single image and we will generate pseudo images for doing fusion. It is useful not only for low contrast image but it will make better even normal image and especially over-exposed and under-exposed images. Results for Normal image, Low contrast image, Under-exposed image and Over-exposed image will prove efficiency of this approach. Here smooth variation is required in cloud like regions so by making this region smooth the image can be made more natural with enhanced contrast as well as exposure and this approach will be very efficient for overall image enhancement. |
Figures at a glance
|
 |
 |
 |
| Figure 1 |
Figure 2 |
Figure 3 |
 |
 |
 |
| Figure 4 |
Figure 5 |
Figure 6 |
|
| |
References
|
- Gonzalez RC, Woods RE (2002) Digital Image Processing, (2nd edtn) New Jersey: Prentice-Hall.
- Pizer SM, Amburn EP, Austin JD, Cromartie R, Geselowitz A, et al. (1987) Adaptive histogram equalization and its variations. Comput Vision Graph Image Process 39: 355-368.
- Kim YT (1997) Contrast enhancement using brightness preserving bihistogram equalization. IEEE Trans Consumer Electron 43: 1-8.
- Wang Y, Chen Q, Zhang B (1999) Image enhancement based on equal area dualistic sub-image histogram equalization method. IEEE Trans Consumer Electron 45: 68-75.
- Chen SD, Ramli AR (2003) Minimum mean brightness error bihistogram equalization in contrast enhancement. IEEE Trans Consumer Electron 49: 1310-1319.
- Wang C, Ye Z (2005) Brightness preserving histogram equalization with maximum entropy: a variational perspective. IEEE Trans. Consumer Electron 51: 1326-1334.
- Ooi CH, Kong NSP, H. Ibrahim (2009) Bi-histogram equalization with a plateau limit for digital image enhancement. IEEE Trans Consumer Electron 55: 2072-2080.
- Sengee N, Sengee A, Choi HK (2010) Image contrast enhancement using bi-histogram equalization with neighborhood metrics. IEEE Trans Consumer Electron 56: 2727-2734.
- Menotti D, Najman L, Facon J, Araújo ADA (2007) Multi-histogram equalization methods for contrast enhancement and brightness preserving. IEEE Trans Consumer Electro 53: 1186-1194.
- Kim M, Chung MG (2008) Recursively separated and weighted histogram equalization for brightness preservation and contrast enhancement. IEEE Trans. Consumer Electron 54: 1389-1397.
- Ooi CH, Isa NAM (2010) Adaptive contrast enhancement methods with brightness preserving. IEEE Trans Consumer Electron 56: 2543-2551.
- Moroney N (2000) Local colour correction using non-linear masking.inProc. IS&T/SID Eighth Color Imaging Conf 108-111.
- Schettini R, Gasparini F, Corchs S, Marini F, Capra A, et al.(2010) Contrast image correction method. JElectron Imaging 19: 023-025,.
- Battiato S, Bosco A, Castorina A, Messina G (2004) Automatic image enhancement by content dependent exposure correction. EURASIP J Appl Signal Process2004: 1849-1860.
- Safonov IV, Rychagov MN, Kang K, Kim SH (2006) Automatic correction of exposure problems in photo printer. inProcIEEE Tenth IntSymp Consumer Electron2006: 1-6.
- Hsieh CH, Chen BC, Lin CM, Zhao Q (2010) Detail aware contrast enhancement with linear image fusion. inProc 2nd IntSymp On Aware Computing 1-5.
- Pei L, Zhao Y,Luo H (2010) Application of wavelet-based image fusion in image enhancement. inProc 3rd Int Cong Image and Signal Process 649-653.
- Lim BR, Park RH, Kim S (2006) High dynamic range for contrast enhancement. IEEE Trans Consumer Electron52: 1454-1462.
- Wang Z, Ziou D, Armenakis C, Li D, Li Q (2005) A comparative analysis of image fusion methods.IEEE Trans Geosci Remote sensing43: 1391-1402.
- Amolins K, Zhang Y, Dare P (2007) Wavelet based image fusion techniques- An introduction, review and comparisonISPRS J ofPhotogrammetry & Remote Sensing 62: 249-263.
- Pajares G, Cruz JM (2004) A wavelet-based image fusion tutorial. Pattern Recognition37: 1855-1872.
- Kao WC (2008) High dynamic range imaging by fusing multiple raw images and tone reproduction.IEEE Trans Consumer Electron 54: 10-15.
- Reinhard E, Ward G, Pattanaik S, P. Debevec (2005)High Dynamic Range Imaging: Acquisition, Display and Image-Based Lighting, Morgan Kaufmann Publishing.
- Li S, Yang B (2008) Multifocus image fusion using region segmentation and spatial frequency. Image and Vision Comput26: 971-979.
- Liao PS, Chen TS, Chung PC (2001) A fast algorithm for multilevel thresholding.J Inform SciEng17: 713- 727.
- Mertens T, Kautz J, Reeth FV (2007) Exposure fusionin Proc 15th Pacific Conf on Comput Graph and Applicat382-390.
- Chou, Li YC (1995) A perceptually tuned subband image coder based on the measure of just-noticeable-distortion profile. IEEE Trans Circuits Syst Video Technol 5: 467-476.
- Malik MH, Asif S,Gilani M (2008) Wavelet based exposure fusion in Proc World Cong on Eng 688-693.
|