Keywords
|
| spectral broadening, PCF, supercontinuum, dispersion |
INTRODUCTION
|
| PCFs are optical fibers that employ a microstructured arrangement of material in a background material of different refractive index. In the literatures available it is clear that Supercontinuum generation (SCG) is a nonlinear optical phenomena illustrated by a dramatic white-light spectrum. Soliton effects, Raman shift and coupling with dispersive waves, modulation instability, four wave mixing (FWM), are the main effects leading to the generation of a broad spectrum starting from a narrow laser line. Since the first observation of SCG in PCF by Ranka et al. in 2000, several experiments and numerical simulations were performed to explore the dynamics of SCG in normal and anomalous regime. A supercontinuum is an optical pulse with a broad spectrum that can extend over hundreds of nanometres. Supercontinua can be generated by sending very short, intense (high power) optical pulses into photonic crystal fibers (PCFs). These pulses are of the order of a few femtoseconds long. In order to simulate the formation of supercontinua, an understanding of the media in which they are generated is needed. Optical fibers channel light by using total internal reflection, which occurs when a large difference in material refractive indices exists. PCFs create this difference by using a matrix of materials with different refractive indices. [1] |
| Most PCFs used for SC generation comprise of a solid silica core surrounded by a matrix of silica and air. The solid core has a higher refractive index than the cladding matrix. The air holes allow more control over the wave guidance and enable a shift of the zero-dispersion wavelength (ZDW) from 1.3 μm (the value for standard solid silica fibers) to lower values around 800 nm (Hansen & Kristiansen, 2007). The ZDW is the wavelength at which dispersion due to material effects is zero (for a single mode fiber), enabling nonlinear effects to become more significant, which is important for supercontinuum generation. [1]. |
A. Generalised Nonlinear Schrödinger Equation
|
| Equation (1.1), the Generalised Nonlinear Schrodinger Equation (GNLSE), is to be solved for A (z,t), the field envelope, and is taken from Agrawal (2007), Kobtsev & Smirnov (2006) and Dudley et al. (2006). |
 |
B. Fiber Losses
|
| α in Equation (1.1) represents the power losses in the fiber as the light travels through it. For supercontinuum generation, the length of fiber used is small (only a few metres), so these losses can be neglected in the numerical simulation. [1] |
C. Nonlinear Response Function
|
| R (t') is the nonlinear response function and takes account of the electronic and nuclear contributions and takes the form of Equation (1.2). |
| R(t')=(1-fR)ïÿýïÿý(t-te)+fRhR(t). ….………….....…. (1.2) |
| The electronic contribution is treated in this analysis as occurring instantaneously because te ≈ 1 fs. hR (t) is the Raman response function and contains information on the vibration of silica molecules (within the optical fiber) as light passes through the fiber. This is best calculated experimentally, but an analytical form of hR (t) exists (Blow & Wood, 1989), given by Equation (1.3). Experiments show that fR = 0.18, τ1 = 12.2 fs and τ2 = 32 fs from Blow & Wood (1989). |
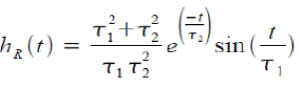 . ….………….....…. (1.3) . ….………….....…. (1.3) |
| Figure1.2 is a graphical representation of Equation (1.2). Compared with PBF, which is experimentally determined, the theoretical model matches well. [7] |
D. Nonlinear Coefficients
|
The approximation  is made here. This can be used for broadening below 20 THz Agrawal, 2007). As the wavelength range of supercontinua here is from 300 nm (1000 THz) to 2000 nm (150 THz), the frequency range is ~ 1000 THz so this approximation is questionable. A better model of γâÃâàwould be to include the frequency dependence of the effective mode area as described in Dudley et al. (2006). It is shown by the same author in Kibler et al. (2005) that the frequency dependence of the effective mode area is not significant when operating at wavelengths around 800 nm, so for simplicity the above approximation will be kept. It must be noted that for wavelengths over around 1500 nm that the frequency dependence would be significant, so results in that region may be affected. [1] is made here. This can be used for broadening below 20 THz Agrawal, 2007). As the wavelength range of supercontinua here is from 300 nm (1000 THz) to 2000 nm (150 THz), the frequency range is ~ 1000 THz so this approximation is questionable. A better model of γâÃâàwould be to include the frequency dependence of the effective mode area as described in Dudley et al. (2006). It is shown by the same author in Kibler et al. (2005) that the frequency dependence of the effective mode area is not significant when operating at wavelengths around 800 nm, so for simplicity the above approximation will be kept. It must be noted that for wavelengths over around 1500 nm that the frequency dependence would be significant, so results in that region may be affected. [1] |
E. Simplifying the Generalised Nonlinear Schrödinger Equation
|
| Incorporating the approximations α = 0 and into Equation (1.1) yields; |
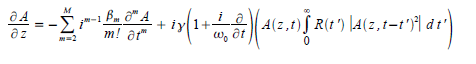 ………………… (1.4) ………………… (1.4) |
| Substituting Equation (1.2) into the integral of Equation (1.4) gives; |
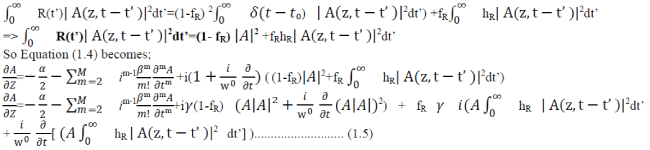 |
F. Split Step Fourier Method for Solving the NLSE
|
| Equation (1.5) can now be solved using the SSFM. This method is based around separating the dispersive and nonlinear components of the equation from one another. This assumes that over a very small distance these components may be assumed to be independent. So Equation (1.5) can be written as: |
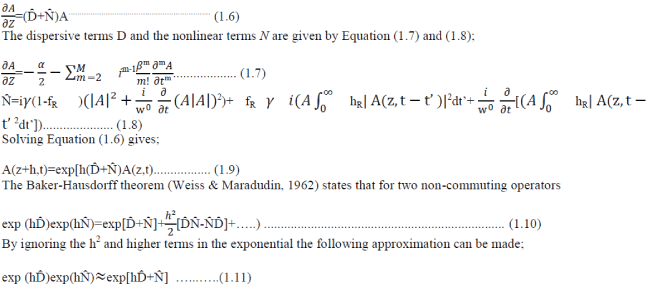 |
| This will result in the SSFM having an accuracy of approximately second order, as the h2 terms in the Baker-Hausdorff expansion have been neglected. It must be noted that the nonlinear and dispersive terms do not in fact commute. So the solution for the pulse envelope will be; |
| A(z+h,t) ≈ exp(hDÃÅÃâ )exp(h NÃÅÃâ )A(z,t)..… (1.12) |
| A variation on Equation (1.12) known as the symmetrised SSFM (Fleck et al., 1976) will actually be used in the program, as it has a higher accuracy. It works by calculating the nonlinear effects in the middle of each step as opposed to the edges. The spatial dependence of the nonlinear term is more accurately described by an integral, whereas in Equation (1.12) it was approximated by |
 |
| Another advantage of solving the dispersive and nonlinear terms separately is that the dispersive terms can be solved easily by transforming them into the fourier domain. The nonlinear terms cannot and must be solved in the time domain by using a numerical method as they have a spatial dependence. |
GRAPHICAL ANALYSIS AND OBSERVATIONS
|
| In the graphical analysis portion we analyse the supercontinuum spectrum at the different values of the wavelength at different lengths of the photonic crystal fiber. |
Case1. When lambda=835nm
|
| Below are the parameters for the reference case. These parameters are lambda= 835, Peak Power= 1000W, Gamma=110 (Wm)-1, alpha=0, betaw = [0 0 -11.830 8.1038e-2 -9.5205e-5 2.0737e-7 -5.3943e-10 1.3486e-12 - 2.5495e-15 3.0524e-18 -1.714e-21]; (beta coefficients (ps2/ nm)) |
Case a. When z (length of the fiber) = 0.0001km
|
| As from the graph we can see that when lambda lie in between 500nm to 1000nm, the magnitude of the spectrum fluctuates in between -0.5 a.u. to -45 a.u. and its average value is nearly equal to -20 a.u. When lambda become slightly larger than 1000nm then the magnitude of the spectrum starts increasing and when lambda nearly equals to 1150nm it attain its maximum value nearly equal to 0 a.u. and after this the magnitude of the spectrum starts decreasing with increase in lambda and its value is -40 a.u. when lambda = 1300nm and from1300 nm to 1500nm values of the lambda the magnitude of the spectrum fluctuates in between -30 to -70 a.u. and its average value is -50 a.u. |
Case b. When z=0.003km
|
Overall Observation
|
| In fig 1.3 & 1.4, we increases the length of the fiber and taking lambda 835nm fixed, we observed the effect of length of the fiber on the supercontinum generation in pcf. As we increases the value of z the spectrum becomes more broad and also the position of the occurrence of maxima in the plot get shift into right direction with increase in the position of z. |
Case2. When lambda =450nm
|
| Peak Power= 1000W, Gamma=110(Wm)-1, alpha=0, betaw = [5.30E+00 9.94E-03 -1.23E-05 -3.27E-09 4.54E-11 2.78E-14 -2.48E-16 ]; ( beta coefficients (ps2/ nm)) |
Case a. When z=0.0001km,
|
| In the above figure initially the spectrum magnitude is fluctuates in between -5a.u. to -20a.u. but when lambda reaches to 525nm suddenly magnitude decreases and the minima occurs, after that from around 525nm to 600nm spectrum magnitude is at its peak value and and from 600 to 1500nm it fluctuates in between -10a.u. to -30a.u. |
Case b When z=0.003km
|
| In the above graph the value of the spectrum magnitude fluctuates in between -10a.u. to -30a.u and the average value of the spectrum is nearly equal to -18a.u |
Case3. When lambda = 532nm
|
| Peak Power= 1000W, Gamma=110(Wm)-1, alpha=0, betaw = [-3.21E+00 1.58E-02 -4.27E-06 -1.84E-08 -1.90E-11 2.08E-13 -2.99E-16]; (beta coefficients (ps2/ nm)) |
Case a. When z=0.0001km
|
| In this figure the maxima occurs when lambda is around 630 and after this maxima the spectrum magnitude is fluctuates in between -10a.u to -40 a.u. with increase in the wavelength. |
Case b. When z=0.003km
|
| In the above graph the spectrum become more broad from the spectrum of the z=0.0001km and the average value of the whole plot is nearly equal to -15a.u. |
Case 4. When lambda =550
|
| Peak Power= 1000W, Gamma=110(Wm)-1, alpha=0, betaw = [--5.09E+00 1.60E-02 -2.21E-06 -1.15E-08 -4.78E-11 2.17E-13 -2.48E-16 ]; ( beta coefficients (ps2/ nm)) |
Case a. When z=0.0001km
|
| In this graph upto 560nm the spectrum varying in between -10a.u. to -20 a.u. and from 560nm to 650nm it moves to its peak value and from 700nm to 1400nm it fluctuates in between =10a.u. to -20a.u. and after 1400nm the magnitude of the spectrum decreases by 1 step size means it start fluctuating in between -20a.u. to -30a.u. |
Case b. When z=0.003km
|
| In this graph the spectrum magnitude changes slightly with increase in the lambda and its average value is nearly equal to -20a.u. |
Case5. When lambda = 700
|
| Peak Power= 1000W, Gamma=110(Wm)-1, alpha=0, betaw = [1.19E+01 5.90E-02 -4.53E-05 -8.24E-08 2.62E-10 - 3.28E-13 1.75E-16 ]; ( beta coefficients (ps2/ nm)) |
Case a. When z=0.0001km
|
| In the above graph up to 700nm the value of the spectrum is nearly equal to -13a.u. and after 700nm it starts rises and from 700nm to 900nm spectrum magnitude is nearly equal to its peak value and for the values of lambda above 900nm the average value is -20a.u. |
Case b. When z=0.003km
|
| The spectrum in above case is the broadest spectrum among last four figures and its average value is nearly equal to - 15a.u. |
Case 6. When lambda =800
|
| Peak Power= 1000W, Gamma=110(Wm)-1, alpha=0, betaw =[ -9.83E+00 6.78E-02 -5.45E-07 -1.90E-07 3.82E-10 - 3.87E-13 1.75E-16]; ( beta coefficients (ps2/ nm)) |
Case a. When z=0.0001km
|
| In the figure 1.13, from 500 to 700nm the average value is -20a.u. and from 700nm to 1000nm the spectrum touches its peak value and from 1000 it starts fluctuating in between -10 to -30a.u. |
Case b. When z=0.003km
|
| Again like last graph, this plot is divided into two plots, the first one is a straight line whose value is shifted to -55a.u. from -58a.u. and its average value is around -20a.u. |
CONCLUSION AND RESULTS
|
| In this paper we have studied and used lambda, alpha, z (length of the pcf), gamma, peak power of the input pulse in matlab simulation. Also from figures 1.1 to 1.14, we have studied the dependency of supercontinuum pulse on various parameters. Now we will discuss those parameters one by one. |
Lambda
|
| As we have seen in above discussed six different cases of different values of lambda, the average value of the spectrum decreases with increase in the pumping wavelength and with increase in the input wavelength the spectrum of the supercontinuum pulse get broader. |
Length of PCF
|
| As we have seen in the four cases of six different wavelengths, the spectrum become broader with increase in the length of the photonic crystal fiber length. Generally speaking, the longer the fiber length, the broader the supercontinuum generated. Using the dispersion and nonlinearity lengths LD and LN allows a suitable length to be chosen. The fiber length z must be larger than LD and LN in order for the dispersive and nonlinear effects to broaden the inlet pulse. |
Peak power of the Input Pulse
|
| We can easily compare these with the help of two graphs given in figure 1.15, where the input pulse of different peak power is used and we can say that after observing these two images that the supercontinuum spectrum is dependent on the peak power of the pumping wave. The spectrum of the left pulse is broader than the right one. Higher pulse powers mean that the nonlinear effects are more emphasized. The higher the pump intensity, the broader the supercontinuum. Pumping the laser at a wavelength around the ZDW of the fiber means that dispersive effects are small compared to nonlinear ones. At a wavelength lower than the ZDW of the fiber, the pulse does not experience much broadening. So it would be best to pump the laser into the fiber at a wavelength just above the ZDW of the fiber. |
| The paper also identified how changing variables affected the formation of the supercontinuum. It was found that using higher pulse power and FWHM, and fibers with a higher nonlinearity coefficient produced broader supercontinua. It also succeeded in generating a supercontinuum in the near-UV region of the spectrum. |
APPLICATIONS AND FUTURE SCOPES
|
| Due to development of new technologies in the field, more guarded and accessible spectral broadening and generation of supercontinuum is possible. This helps in many applications in the field of optical communication such as Pulse compression and short pulse generation, Multi-wavelength optical sources, All-optical analog-to-digital conversion, TDM-to-WDM-to-TDM conversion, Optical fiber characterization and many more. This leads to designing of variety of new light sources which find applications in various fields. |
| Ultraviolet supercontinua is being used in Optical coherence tomography, Frequency metrology and Fluorescence lifetime imaging, Optical communication, Gas sensing and many more. The higher the pump intensity broader is the supercontinuum .Supercontinuum has a higher intensity and coherence than conventional light sources and has a broader spectrum than laser light. The applications of these sources have formed a feedback loop where by the scientist utilizing the supercontinua are demanding better customisable continua to suit their particular application. This has motivated researchers to develop novel methods to produce these continua and to develop theories to understand their formation and future development. Fibers that produce good ultraviolet supercontinua should be available in the near future and this study aims to predict how they would look. |
| In this we have only studied the supercontinuum by changing the individual parameters like lambda, z (length of pcf), and peak power. But in future we can calculate the combined effect of these parameters in supercontinuum generation. Also as we know beta parameter (non linearity parameter) depends on wavelength and it has different values for different wavelengths. So in future we can study this parameter also and the dependency of supercontinuum pulse spectrum on this parameter. |
| |
Figures at a glance
|
 |
 |
 |
 |
 |
| Figure 1 |
Figure 2 |
Figure 3 |
Figure 4 |
Figure 5 |
 |
 |
 |
 |
 |
| Figure 6 |
Figure 7 |
Figure 8 |
Figure 9 |
Figure 10 |
 |
 |
 |
 |
 |
| Figure 11 |
Figure 12 |
Figure 13 |
Figure 14 |
Figure 15 |
|
| |
References
|
- Dudley, J. M. et al, Supercontinuum generation in photonic crystal fiber, Reviews of Modern Physics, 78, Number 4, 2006.
- Park, W. Lee, J.B. Mechanically Tunable Photonic Crystal Structure. Applied Physics Letters, 85, 4845, 2004.
- Kittel, Charles. Solid State Physics; 7th ed., Wiley: New York, 1995.
- http://en.wikipedia.org/wiki/Biophotonics (accessed March 19, 2008)
- http://answers.google.com/answers/threadview?id=460549 (accessed March 19,2008)
- Pedrotti, Frank. Introduction to Optics; Pearson Prentice Hall: New Jersey, 2007
- Agrawal, G. P,Nonlinear Fiber Optics, Academic Press, 2007.
- http:// www.nktphotonics.com
- Singh S.K. ,Singh D.K. and P. Mahto Numerical Analysis of Dispersion and Endlessly Single Mode Property of a Modified Photonic Crystal
- Fiber Structure Int. J. Advanced Networking and Applications Volume: 03, Issue: 02, Pages:1116-1120,2011.
|