Keywords
|
| HSI, Segmentation, Color Co-occurrence Matrix, Texture, Plant Leaf Diseases |
INTRODUCTION
|
| The naked eye observation of experts is the main approach adopted in practice for detection and identification of plant diseases. But, this requires continuous monitoring of experts which might be prohibitively expensive in large farms. Further, in some developing countries, farmers may have to go long distances to contact experts, this makes consulting experts too expensive and time consuming [2] and moreover farmers are unaware of non-native diseases. Automatic detection of plant diseases in an important research topic as it may prove benefits in monitoring large fields of crops, and thus automatically detect the diseases from the symptoms that appear on the plant leaves. This enables machine vision that is to provide image based automatic inspection, process control and robot guidance. Comparatively, visual identification is labor intensive, less accurate By SGDM The texture features are calculated and the classification is done using squared distance technique. Grape fruit peel maybe infected by several diseases[3]. Real time specific weed discrimination technique using multilevel wavelet decomposition was proposed by Siddiqil et.al. In this histogram equalization is used for preprocessing, features are extracted from wavelet decomposition and finally classified by Euclidean distance method [4]. Automatic classification of leaf diseases is done based on high resolution multispectral and stereo images [5].Sugar beet leaves are used in this approach. Segmentation is the process that is carried out to extract the diseased region and the plant diseases are graded by calculating the quotient of disease spot and leaf areas. An optimal threshold value for segmentation can be obtained using weighted Parzen-window [6]. |
THE PROPOSED APPROACH
|
| Figure 1 the basic procedure of the proposed vision-based detection algorithm in this paper. First, the images of various leaves are going to acquire using a digital camera. Then image-processing techniques are applied to the acquired images to extract useful features that are necessary for further analysis. |
The step-by-step procedure of the proposed system:
|
| 1. RGB image acquisition |
| 2. Convert the input image from RGB to HSV format. |
| 3. Masking the green-pixels |
| 4. Removal of masked green pixels |
| 5. Segment the components |
| 6. Obtain the useful segments |
| 7. Computing the features using color-co-occurrence methodology |
| 8. Evaluation of texture statistics |
| Color Transformation Structure: Firstly, the RGB images of leaves are acquired. Then RGB images are converted into Hue Saturation Value (HSV) color space representation. RGB is an ideal for color generation. But HSV model is an ideal tool for color perception [7]. Hue is a color attribute that describes pure color as perceived by an observer. Saturation refers to the relative purity or the amount of white light added to hue and Value means amplitude of light.. After the transformation process, the Hue component is taken for further analysis. Saturation and Value are dropped since it does not give extra information. Figure 2 shows the H, S and V components. |
| Masking and Removing green pixels: Masking means setting the pixel value in an image to zero or some other background value. In this step, we identify the mostly green colored pixels. After that, based on specified threshold value that is computed for these pixels.The green components of the pixel intensities are set to zero if it is less than the pre-computed threshold value. Then red, green and blue components of the this pixel is assigned to a value of zero by mapping of RGB components. [3] The green colored pixels mostly represent the healthy areas of the leaf and they do not add any valuable weight to disease identification . |
| Segmentation: From the above steps, the infected portion of the leaf is extracted. The infected region is then segmented into a number of patches of equal size. In this approach patch size of 32X32 is taken[1]. |
| Obtaning Useful Segments: In this step the useful segments are obtained.The size of the patch is chosen in such a way that the significant information is not lost. Not all segments contain significant amount of information. So the patches which are having more than fifty percent of the information are taken into account for the further analysis[1] |
Color co-occurrence Method: In statistical texture analysis, texture features are computed from the statistical distribution of observed combinations of intensities at specified positions relative to each other in the image. Spatial Gray-level Dependence Matrices (SGDM) method is a way of extracting statistical texture features. A GLCM is a matrix where the number of rows and columns is equal to the number of gray levels, G, in the image. The matrix element  is the relative frequency with which two pixels, separated by a pixel distance is the relative frequency with which two pixels, separated by a pixel distance  occur within a given neighborhood, one with intensity i and the other with intensity j. The SGDM’s are represented by the function occur within a given neighborhood, one with intensity i and the other with intensity j. The SGDM’s are represented by the function  where I represent the gray level of the location, and j represents the gray level of the pixel at a distance d from location at an orientation angle θ of. SGDM’s are generated for Hue image. where I represent the gray level of the location, and j represents the gray level of the pixel at a distance d from location at an orientation angle θ of. SGDM’s are generated for Hue image. |
| Texture Features: Properties of Spatial Gray-level Dependence Matrices (SGDM) like Contrast, Energy, Local homogeneity, and correlation are computed for the Hue content of the image as given in following Eqns. |
| Contrast : Returns a measure of the intensity contrast between a pixel and its neighbor over the whole image. Range = [0 (size(SGDM,1)-1)^2] Contrast is 0 for a constant image. |
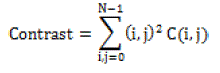 (1) (1) |
| Energy= Returns the sum of squared elements in the SGDM Range = [0 1]Energy is 1 for a constant image. |
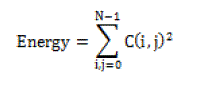 (2) (2) |
| Homogeneity= Returns a value that measures the closeness of the distribution of elements in the SGDM to the SGDM diagonal. Range = [0 1] Homogeneity is 1 for a diagonal SGDM. |
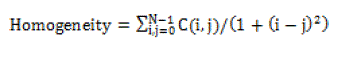 (3) (3) |
| Correlation= Returns a measure of how correlated a pixel is to its neighbor over the whole imageRange = [-1 1] Correlation is 1 or -1 for a perfectly positively or negatively correlated image |
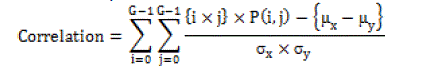 (4) (4) |
CONCLUSION
|
| In this paper application of texture statistics for detecting the plant leaf disease has been explained Firstly by color transformation structure RGB is converted into HSV space because HSV is a good color descriptor. Masking and removing of green pixels with pre-computed threshold level.Then in the next step segmentation is performed using 32X32 patch size and obtained useful segments.These segments are used for texture analysis by color co-occurance matrix.Finally if texture parameters are compared to texture parameters of normal leaf . The extension of this work will focus on developing algorithms and NN’s in order to increase the recognition rate of classification process. |
| |
Figures at a glance
|
 |
 |
| Figure 1 |
Figure 2 |
|
| |
References
|
- Ananthi, S. Vishnu Varthini, Detection And Classification Of Plant Leaf Diseases International Journal of Research in Engineering & AppliedSciences, Volume 2, Issue 2 (February 2012) ISSN: 2249-3905
- H.Al-Hiary, S. Bani-Ahmad, M.Reyalat, M.Braik and Z.AlRahamneh, Fast and Accurate Detection and Classification of Plant Diseases,International Journal of Computer. Applications (0975-8887), Volume 17- No.1.March 2011
- Dheeb Al Bashish, Malik Braik, and Sulieman Bani-Ahmad , (2010)A Framework for Detection and Classification of Plant Leaf and StemDiseases, International Conference on Signal and Image Processing pp 113-118.
- Dae Gwan Kim, Thomas F. Burks, Jianwei Qin, Duke M. Bulanon, Classification of grapefruit pee diseases using color texture feature analysis,International Journal Agriculture and Biological Engineering, Vol:2,No:3,September 2009. Pp 41-50.
- Sabine D. Bauer , Filip Korc, Wolfgang Forstner, The Potential of Automatic Methods of Classification to identify Leaf diseases fromMultispectral images, Published online: 26 January 2011,Springer Science+Business Media, LLC 2011., Precision Agric (2011 12:361–377, DOI10.1007/s11119-011-921.
- Wang Jue,Wang shitong,Image Thresholding Using Parzen Window Estimation .Jurnal of applied sciences8(5):772-779,2008,ISSN 1812-5654,Asian Network for Scientif Information,2008
- Muhammad Hameed Siddiqi1, Suziah Sulaiman, Ibrahima Faye and Irshad Ahmad, A Real Time Specific & Weed Discrimination System UsingMulti-Level Wavelet Decomposition, International Journal of Agriculture Biology, ISSN Print: 1560–8530; ISSN Online1814-9596 ,09–118/YHP/2009/11–5–559–565
|