Keywords
|
| Carcinogen, Fourier Transform, Frequency domain, Histogram, Human brain, Magnetic resonance imaging |
INTRODUCTION
|
| MRI is short form of Magnetic Resonance Imaging. It is a procedure used in hospitals to scan patients and determine the severity of certain injuries. An MRI machine uses a magnetic field and radio waves to create detailed images of the body [2]. |
| MRI of the brain is a safe and painless test that uses a magnetic field and radio waves to produce detailed images of the brain and the brain stem. An MRI differs from a CAT scan (computed axial tomography scan) because it does not use radiation. MRI can detect a variety of conditions of the brain such as cysts, tumours, bleeding, swelling, developmental and structural abnormalities, infections, inflammatory conditions, or problems with the blood vessels. It can determine if a shunt is working and detect damage to the brain caused by an injury or a stroke. MRI of the brain can be useful in evaluating problems such as persistent headaches, dizziness, weakness, and blurry vision or seizures, and it can help to detect certain chronic diseases of the nervous system, such as multiple sclerosis. In some cases, MRI can provide clear images of parts of the brain that can't be seen as well with an X-ray, CAT scan, or ultrasound, making it particularly valuable for diagnosing problems with the pituitary gland and brain stem [6].Most MRI machines look like a long tube, with a large magnet present in the circular area. When beginning the process of taking an MRI, the patient is laid down on a table. Then depending on where the MRI needs to be taken, slides a coil to the specific area being imaged. The coil is the part of the machine that receives the MR signal. A strong magnetic field is created by passing an electric current through the wire loops. While this is happening, other coils in the magnet send and receive radio waves. This triggers protons in the body to align them. Once aligned, radio waves are absorbed by the protons, which stimulate spinning. Energy is released after "exciting" the molecules, which in turn emits energy signals that are picked up by the coil. This information is then sent to a computer which processes all the signals and generates it into an image. The final image is a 3-D image representation of the area beingexamined[5]. |
| Imaging plays an integral role in intracranial brain tumour management. Magnetic resonance (MR) imaging in particular has emerged as the imaging modality most frequently used to evaluate intracranial brain tumours, and it continues to have an ever-expanding, multifaceted role. In general, the role of MR imaging in the workup of intraaxial tumours can be broadly divided into tumour diagnosis and classification, treatment planning, and post treatment surveillance[4]. |
EXPERIMENTAL WORK
|
| To perform the result in Frequency domain first we have taken the MRI Images of human Brain in Normal and abnormal condition. This is shown in below fig.1 (a) and fig.1 (d). Then using Metrics Laboratory (Mat Lab)codding has done histogram of Normal and Abnormal MRI Images which is shown in fig.1 (b) and (e) as well as stem graph shown in fig. (c) And (f).which is very useful to analyse the various types of diseases in human brain. |
DEVELOPMENT OF MATHEMATICALALGORITHM
|
| The development of mathematical algorithm for normal and Abnormal MRI Images Stem graph as shown in above fig.1(c) and (f). We used Discrete Time Fourier Transform or simply, Fourier Transform of a discrete time sequence x (n) which is represented by the complex exponential sequence [e-jωn] where ω is the real frequency variable. This transform is useful to map the time domain sequence into a continuous function of a frequency variable. If the sequence to be represented is of finite duration, i.e. has only a finite number of non- zero values the transform used is discrete Fourier transform (DFT). |
| Definition- Let x (n) be a finite duration sequence the N point DFT of the sequence x (n) is expressed by- |
 |
| Where K = 0, 1, 2……………N-1 |
| Using above DFT Eq.No.1 we have converted time domain sequence into frequency domain variables. For that we have taken stem graph of normal and abnormal images which is shown in above fig1.(c) And fig1.(f) |
| Discrete time sequence of Normal Image stem graphx(n) = [11.45, 4.31, 7.62, 2.25, 0.33, 0.12, 0.11]*104 |
| Discrete time sequence of Abnormal Image stem graph x (n) = [12.37, 6.93, 5.64, 0.72, 0.19, 0.08, 0.26]*104 |
| By Using Equation No.(1) We convert the stem graph discrete time finite sequence values of normal image into corresponding Magnitude and Phase. |
| For K = 0, 1, 2, 3, 4, 5, 6 …N-1, |
| N = 7, |
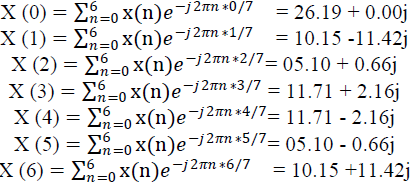 |
| Corresponding Amplitude of above complex numbers are = {26.19, 15.27, 5.14, 11.90, 5.14, 15.278}*104 |
| Corresponding Phase of above complex numbers are = {0, -48.36, 7.37, 10.45, -10.45, -7.37, 48.36} |
| Similarly, Using Equation No.(1) We convert the stem graph discrete time finite sequence values of Abnormal image into corresponding Magnitude and Phase. |
| For K = 0, 1, 2, 3, 4, 5, 6 …N-1, |
| N = 7, |
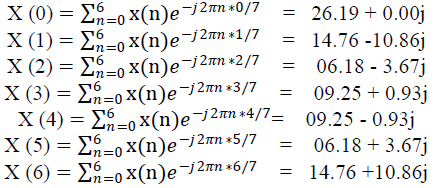 |
| Corresponding Amplitude of above complex numbers are = {26.19, 18.32, 7.18, 9.29, 9.29, 7.18, 18.32}*104 |
| Corresponding Phase of above complex numbers are = {0, -36.34, -30.70, 5.74, -5.74, 30.70, 36.34} |
RESULTS
|
| In the use of Fourier transform we converted the Stem graph of normal and abnormal MRI images of human brain into Corresponding Amplitude and Phase form. This result shows the difference in Amplitude and phase of the normal and abnormal MRI images. This difference level represents the Magnitude of the disease.With the help of this Mathematical formulation the Physiciancan choose optimal treatment modality until the abnormal value exactly equals to the normal value. Due to this the side effect of medicine can be overcome. |
DISCUSSION
|
| The main Aim of this paper wasto develop the mathematical function for normal and abnormal MRI images of human brain. And we have developed this function by using of Fourier transform. These mathematical results are very useful for Physician to overcome the abnormality level by using regular therapy and proportionate medicine to the patient. |
| |
Figures at a glance
|
 |
| Figure 1 |
|
| |
References
|
- A.N. D ATTA , B. B ANDYOPADHYAY , “An SIRT style reconstruction algorithm for microwave tomography”, IEEE Trans. Biomed.Engg.,vol 32, pp 719-723, 1985
- Archip, N., Clatz, O., Whalen, S., Kacher, D., Fedorov, A., Kot, A., Chrisochoides, N., Jolesz, F., Golby, A., Black, P. and Warfield, S. „Nonrigid alignment of preoperative MRI, fMRI, and DT-MRI with intra-operative MRI for enhanced visualization and navigation in image-guided neurosurgeryâÃâ¬ÃŸ, Neuroimage, Vol. 35, No. 2, pp.609–624.2007
- Viner J. Brain Tumors. University of California, San Francisco Department of neurosurgery. Available at: http://nursing.ucsfmedicalcenter.org/education/classMaterial/34_2.pdf. Accessed April 6, 2011
- Advanced MR Imaging Techniques in the Diagnosis of Intraaxial Brain Tumors in AdultsRiyadh N. Al-Okaili, MD, JaroslawKrejza, MD,
- PhD2, Sumei Wang, MD,John H. Woo, MD and Elias R. Melhem, MD, PhD,PA 19104. Received May 17, 2006; accepted July 2006
- Bergin C, Glover G, Pauly J. Lung parenchyma: magnetic susceptibility in MR imaging. Radiology 1991; 180: 845-8
- Göhde SC, Goyen M, Forsting M, Debatin JF. Prevention without radiation-a strategy for comprehensive early detection using magneticresonance tomography.. German.. Radiologe2002;42:622-9.
- Illes J, Kirschen MP, Edwards E, Bandettini P, Cho MK, Ford PJ, et al. Practical approaches to incidental findings in brain imagingresearch. Neurology2008;70:384-90.
- Rafeal C Gonzalez, Richard E. Woods, SteevenL.Eddins “Digital Image Processing Using Matlab” Second Edition 2009.
- A. P. Guimaraes I. S. Oliveira,” Magnetism and Magnetic Resonance in Solids” John Willey & sons, INC. NewYork.
- S. Salivahanan, A. vallavaraj, C. Gnanapriya “Digital Signal Processing” Tata McGraw-Hill Publishing Company Limited.
- M. A. Bernstein , F. K. King, and p. X J Zhou, Handbook of “MRI pulse sequences” Burlington, MA: Elsevier Academic Press, pp 214-211,2004
- E. M. Haacke, R. W. Brown, M. R. Thompson, and R. Venkatesan, “Magnetic Resonance Imaging: Physical Principles and Sequence Design”, 1st ed. New York: Wiley-Liss, pp 312-314 1999.
|