Keywords
|
| Wireless Multimedia Sensor Network (WMSN), graph sampling, scale-down sampling, back-intime sampling |
INTRODUCTION
|
| The advancement in the field of wireless sensor networks regarding remote monitoring, environmental monitoring, measuring temperature, humidity etc is not only limited to transferring scalar data to remote locations but also is helpful in transferring multimedia data from one location to another. This advancement in the field of wireless sensor network led to the introduction of Wireless Multimedia Sensor Networks (WMSN) [1]. Using this technology one can transmit still images, audio and video data from remote locations. The easy availability of microphones and CMOS cameras has made it easy to capture multimedia data and for transferring the data from one node to another leads to the necessity of the deployment of WMSN. A sensing device is deployed with the media data capturing modules. In addition to it, WMSN is also capable of processing, storing and integrating the data received from various remote resources. This enhancing technology can be applied for various purposes and some of its applications are discussed below: |
| • Security [2]: Video and audio sensing capability of WMSN helps in implementing of laws properly thereby reducing the rate of crime to some extent. The nodes are programmed in a way that they are capable of processing the data and making it useful in enhancing the security. |
| • Event Recording: Events such as thefts, accidents etc can also be recorded and later on providing it as an evidence for future purposes. |
| • Health monitoring [3]: Telemedicine sensor networks along with 3D media networks helps to take care of the patient in a better and effective manner. |
| • Environmental monitoring [4]: Besides monitoring the scalar data, habitat of a particular region can also be monitored. A collection of video sensors used by oceanographers for determination of sandbar evolution using various image processing techniques is an example for such an application. |
| • Machine Vision [1]: WMSN technique is also helpful in monitoring of the industrial processes such as manufacturing or finding defects of products. |
| The rest of the paper describes the following: Section II gives a brief discussion about the related work done; Section III introduces graph sampling; Section IV describes its evaluation criteria; Section V defines the algorithm; Section VI describes the applications of graph sampling and the last Section VII describes the conclusion and future scope. |
LITERATURE SURVEY
|
| According to the concept of graph theory, graphs are used for representation of nodes and edges in a diagrammatic form. Graphs can also be used for analytical purposes. Analysis of social networking sites have been made possible through graph sampling. Social networking sites such as Facebook, Twitter etc are difficult to analyse when seen as single large graph. To reduce the complexity the single large graph is sampled to form a sampled graph. The obtained sampled graph is used to represent the original complex graph. The sampled graph contains finite set of nodes and edges on which the analysis is done and then the inferences of the analysis are generalized on the original graph. Graph sampling techniques such as random walk, random node, breadth first search, forest fire etc are applied to analyse such networks. For analysing the network, graph properties are taken into consideration for such analysis. |
| Kathryn Dempsey et al. (2011) in [5] introduced a parallel graph sampling algorithm that focused on densely connected regions to extract the sample chordal graph for comparing the spectral properties of the original graph and the obtained sample chordal graph. The results of the parallel graph sampling algorithm showed that by reducing the size of the network by 20% to 40% on an average, the functional and the combinational properties of the graph were still preserved in both the taken under for comparison. |
| Maciej Kurant et al. (2010) in [6] analysed the bias nature of the Breadth First Search (BFS) Graph sampling Technique. In this, they discussed about the BFS algorithm for analysing social networks with a arbitrary given degree distribution. Also they compared BFS and other sampling algorithms with random walk resulting in the explanation of the previously observed similarity and differences. |
| Abedelaziz Mohaisen et al. (2012) in [7] focused on measuring the biasness of the sampling algorithms on mixing time. A comparative study was done on three sampling algorithms: BFS, random walk and MHRW. The research demonstrated that these algorithms depicted unbiased results related to different properties of graph such as in degree, out degree etc but when property of mixing time was taken into consideration the results were biased. |
| Graph Sampling is not only used for analysing complex networks but also has its roots in the field of data mining. Ruoyu Zou et al. (2010) in [8] stated that mining on graph transactions was a difficult task in the field of data mining on large datasets but became easier when implemented using different sampling algorithms. According to the research, random area selection sampling proved to be a better tool for accomplishing traversal on graph transactions in an efficient and effective manner. |
| Minas Gjoka et al. (2010) in [9] did an analysis on an online social networking site named Facebook. It was stated that Re-weighted Random Walk and Metropolis-Hasting random walk resulted in the construction of effective and efficient sample graph of Facebook users which could not be accomplished using the traditional approaches of Random Walk and BFS. |
GRAPH SAMPLING
|
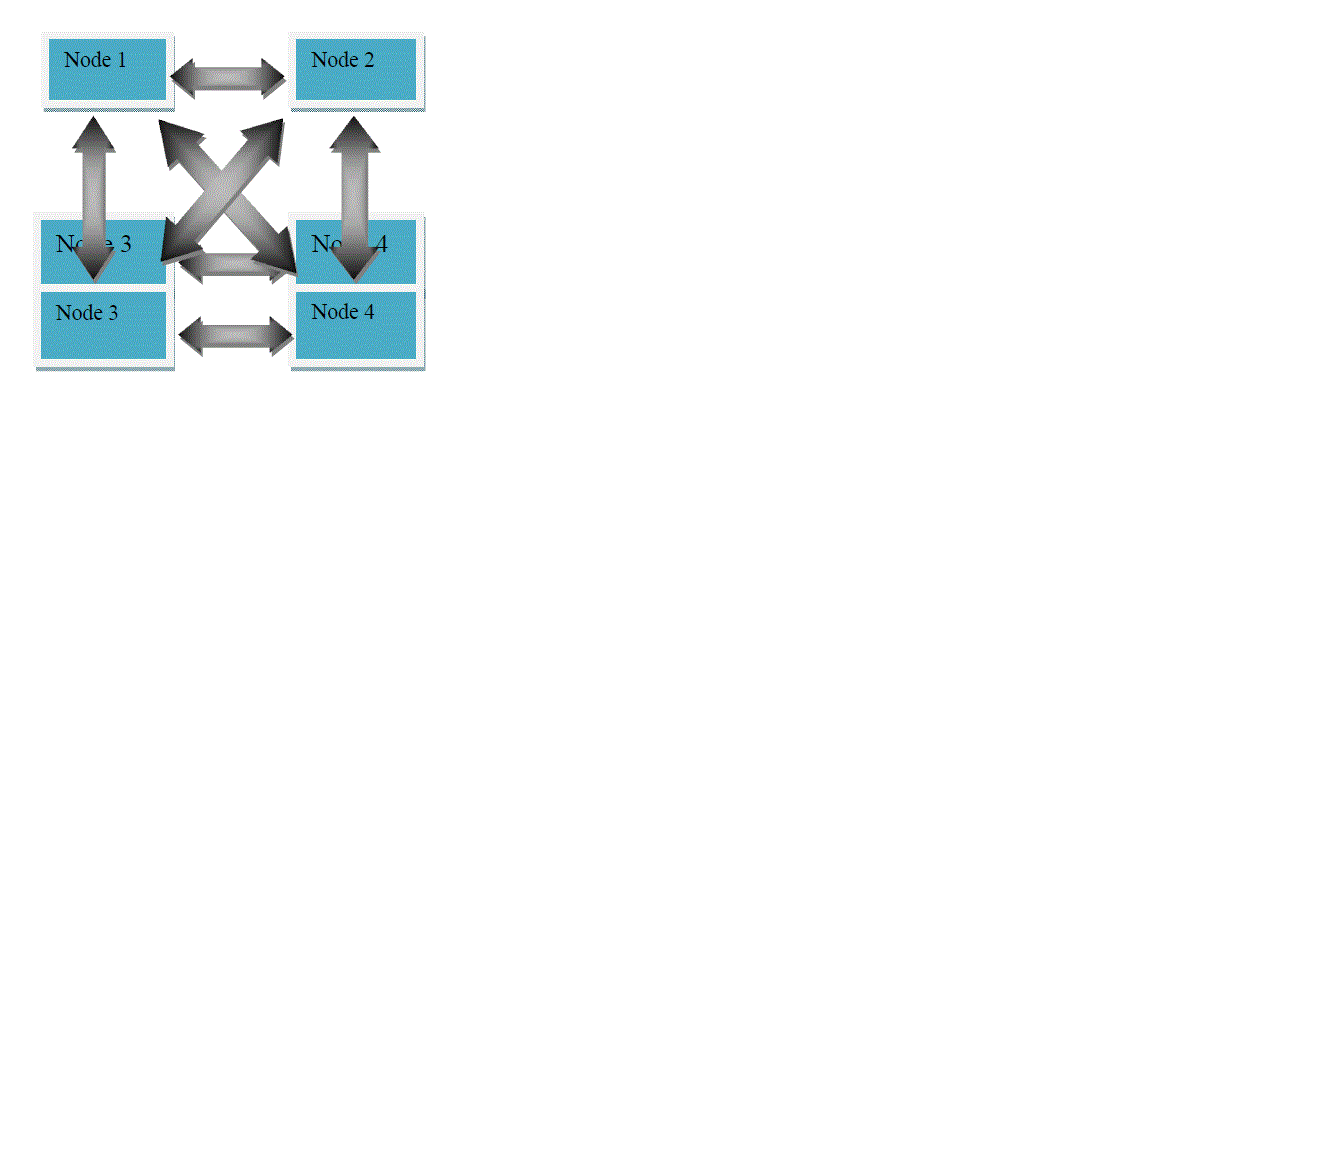
| Graph sampling [10] is a technique that is used for representing a large network in the form of graphs. Either all the nodes from the original graph are selected to form the sample graph or some nodes are used to represent the sample graph. WMSN consists of sensor nodes that are present in large amount in the environment. The sensor nodes in the network are able to share information as they are connected to each other. So, the network of nodes can be related to a graph in which the nodes represent the vertices of the graph and the communicating links represent the edges of the graph. As a whole, the WMSN network can be considered as a collection of vertices and edges over which the information is sent. Fig.2. shows the graphical representation of the network that consists of four spatially located nodes. |
| If we assume that all the nodes are connected to each other following the mesh topology. The graphical representations can be shown as: |
| Many algorithms such as calculating the shortest path to transfer information exists but they tend to fail when the graph size is too large. Hence graph sampling is required in such cases. |
| Creating an optimal sized graph is essential to implement graph sampling. In this technique two graphs are taken into consideration i.e. one is the original graph and the other is the sampled graph. Sampling is done in such a way that the sampled graph exhibits the same properties or some of them as that of the original graph and then the sampled graph can form the basis for many simulations and costly experiments. |
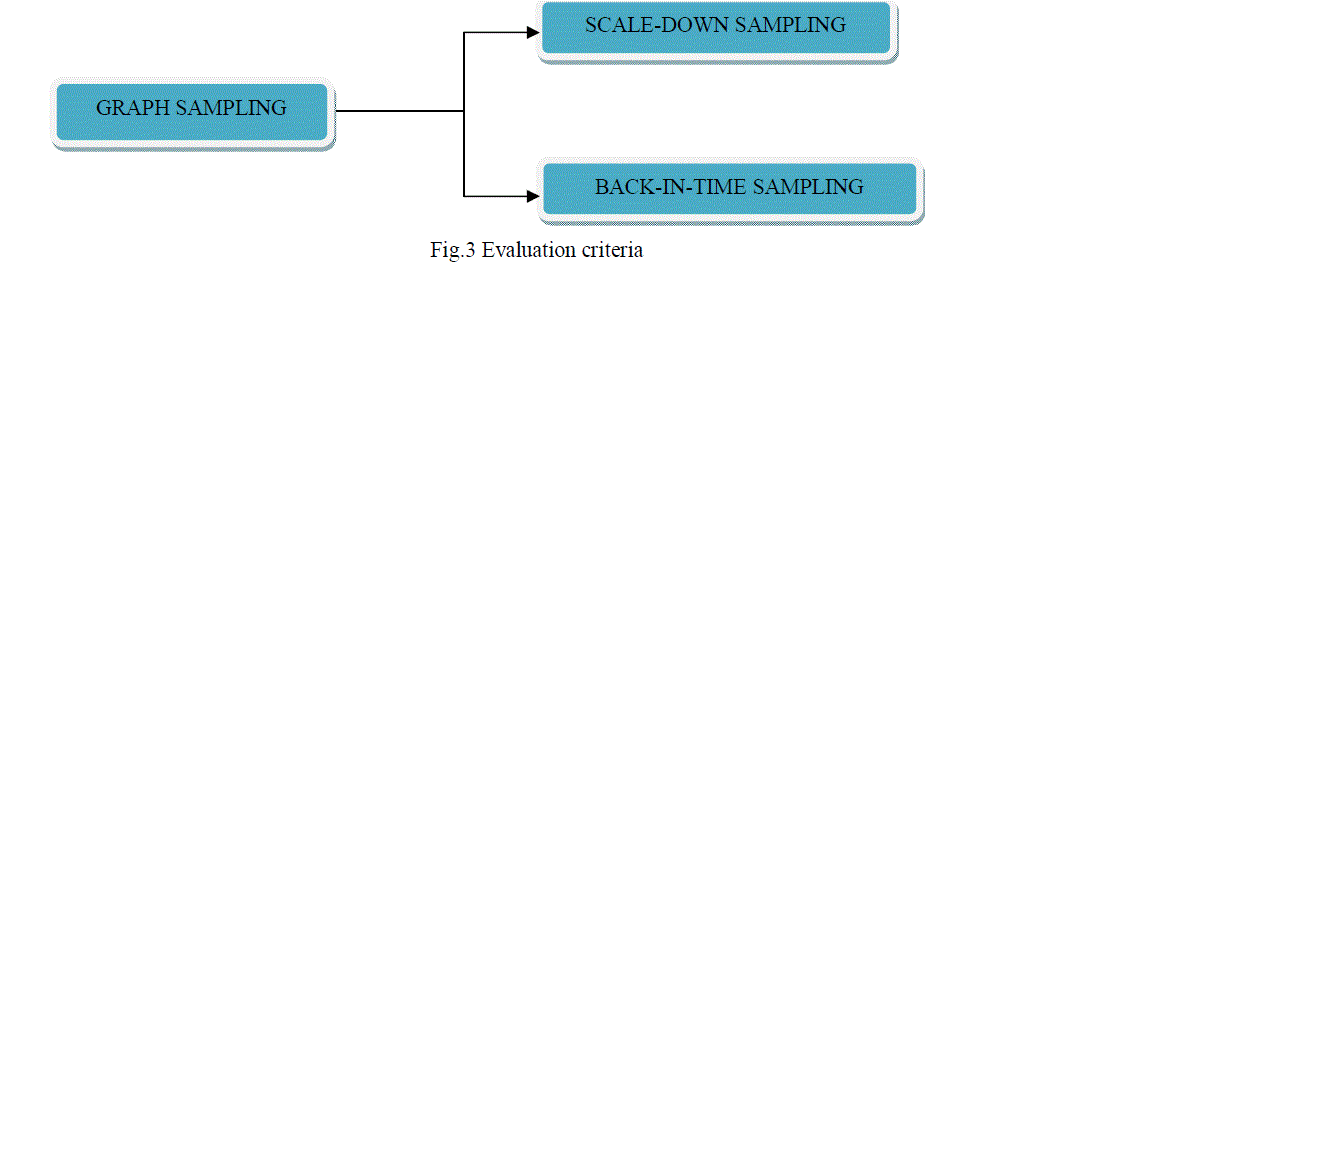
| In graph sampling two aspects [10] are kept in mind: |
| • Scaling down |
| • Back-in-time |
| In the former case, we see whether the sampled graph has the same properties as that of the original graph with lesser number of nodes included in the sample graph. In the latter case, we see similarities in properties when the original graph is of the size same as that of sampled graph. |
EVALUATION CRITERIA
|
| The essential properties that are taken into account for comparing the original and the sampled graph can be categorized in two ways: |
| • Spectral properties |
| • Temporal properties |
| The properties taken into consideration for the evolution of static graphs are mentioned under Scale-down sampling while the temporal evolution is mentioned under Back–in-time sampling. Random walk algorithm in Scale down sampling is implemented for making the comparison between spectral properties of the graph while Forest Fire algorithm in back-in-time sampling is used for comparing the temporal properties of the graph. |
| In case of Scale-down sampling, the evaluation criterion is based on the following: |
| • Distribution of in-degree: In this we take into account the number of nodes with the in-degree equal to a specific node. |
| • Out-degree distribution: Similar to in-degree except that out-going links from a node are calculated. |
| • The number of weakly connected components (wcc) size present in the graph. Existence of the undirected path between two nodes is calculated. |
| • Similarly, size of strongly connected components is also taken into account by evaluating the presence of a directed path between two nodes. |
| • Hop–plot: This is a graph that is used to represent the number of nodes that can be reached in ‘n’ hops. |
| • Hop-plot is then evaluated on WCC |
| • Clustering coefficient distribution [10] |
| In case of Back-in-time sampling, the evaluation criterion is based on: |
| • The law that relates the number of the edges and the number of nodes with time is defined as Densification power law. |
| • Effective diameter: This relates to reachability of maximum number of nodes with respect to the minimum number of hops. As the graph grows with time the effective diameter either stabilizes or shrinks. |
| • Size of the largest WCC normalized with time. |
| • Average of the clustering coefficient with time is also taken into consideration |
ALGORITHMS
|
| There are many algorithms that are used for sampling of graphs but the most frequently sampling algorithm used is Random Walk Algorithm for Scale-down sampling and Forest Fire Algorithm for Back-in-time algorithm. Both the algorithms help in selection of nodes that are used for the construction of sample graph. The algorithms are explained as follows: |
| A. Random Walk Algorithm [11]: |
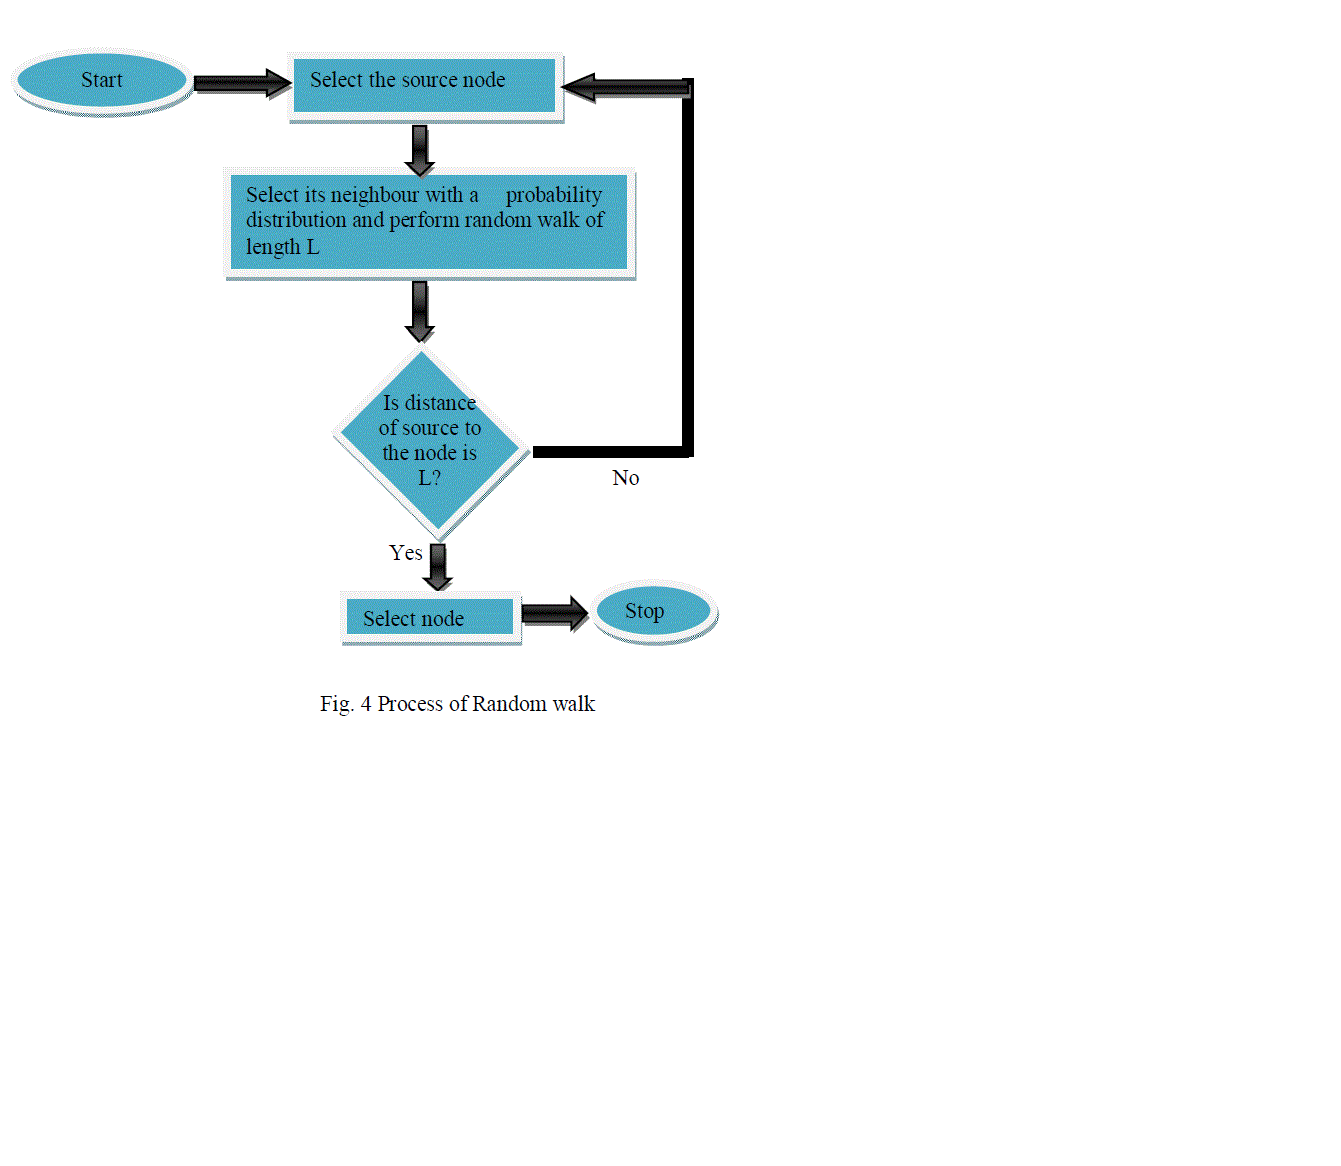
| In random walk algorithm, a random node is selected as the starting vertex and it traverses its neighbours with some probability distribution. This process is repeated till L steps where L can either be the number of hops or the number of edges traversed to go from one node to another. This is known as L length random walk algorithm. There are two key parameters that are taken into account for implementing random walk algorithm; Hitting time and Mixing time. Hitting time refers to the time expected to reach from one node to another. The mixing time takes into account the probability distribution of the nodes. |
| B. Forest Fire Algorithm[12]: |
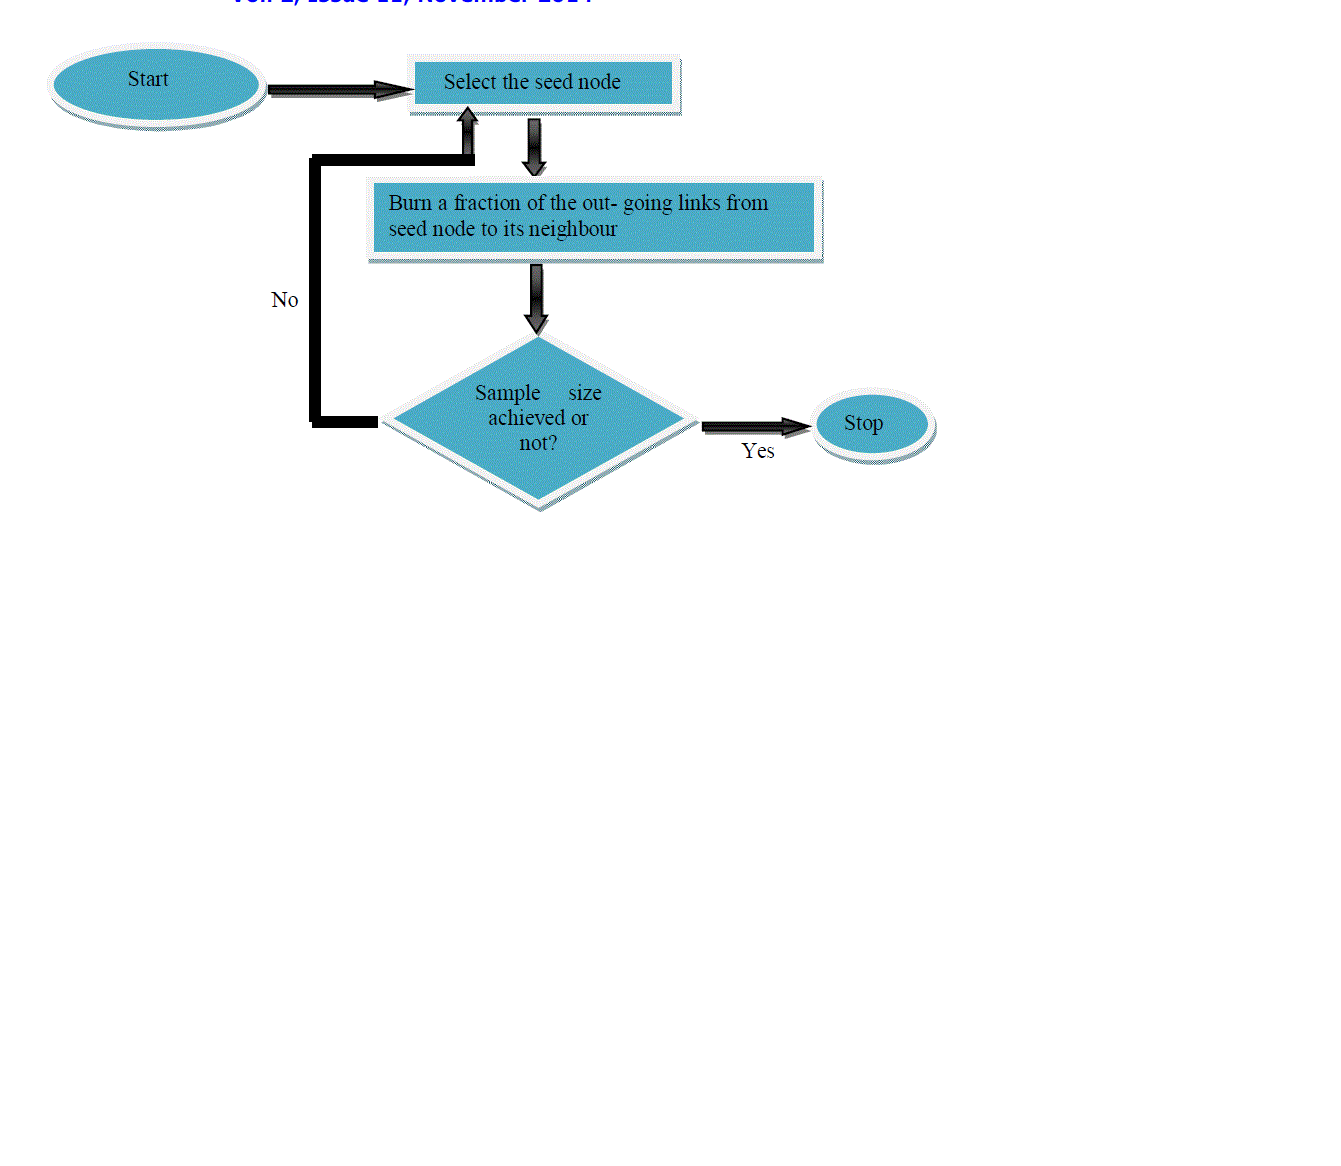
| In this algorithm we randomly choose a node. The selected node is known as the seed node. The outgoing links from the seed node are then processed to reach their neighbouring nodes. The processed links used to reach the neighbouring node are said to get burned. The number of nodes to be burned is selected on the basis of geometric distribution having a mean value that is known in advance. The process iterates itself till the destination node or the required sample size is achieved. This algorithm is used to generate a sample graph whose size is same as that of the original graph and then the temporal properties of both the graphs are compared. |
| The explanation of both the algorithms is explained with the help of the flowcharts. The flowchart for Random Walk is shown in Fig .4 while the flowchart for Forest Fire algorithm is shown in Fig .5 |
APPLICATIONS OF GRAPH SAMPLING
|
| Graph sampling is being used in various fields such as in modelling of internet; object tracking etc. Some of the applications are stated below: |
| • Internet Modeling: For social networking, MHRW [13] algorithm helps in collecting random samples. |
| • Object tracking [14]: Nowadays CCTV camera has been used for tracking various objects so as to prevent offences. In today’s world of smart phones CCTV can also be implemented on mobiles so that one can send information about its location. |
| • Object Recognition [15]: For identifying an object one should have some knowledge about its pixel and shape and as a whole obtained object is compared to the original object for its correct identification. |
| • Compression [16]: The image is compressed when it has to be transferred from source to destination. At the destination end, the decompressed image is then compared to original image. Compression is done to reduce the cost and power consumption of the network. |
| • Feature extraction [17]: When only a specific part of the image has to be analyzed only the part to be analyzed is sent over the network, retrieved at the other end and then compared. The compressed form of the part is send and then retrieved at the receiving end. |
CONCLUSION AND FUTURE SCOPE
|
| Initially one was able to transfer scalar data but with the introduction of the Wireless Multimedia Sensor Network (WMSN) today we can transfer images, audio and video over the network. The WMSN consists of a large number of nodes which are complex in nature and becomes difficult for one to analyze the whole network. This difficulty is reduced with the help of Graph Sampling. Small sampled graphs from original graph are constructed and then various spectral and temporal properties of the sampled graph with the original graphs are compared. This comparison helps in inferring whether the sampled graph can represent a large graph correctly thus reducing the complexity in analyzing the network. |
| For implementing graph sampling two aspects are kept in mind; Scale-down sampling and Back-in-time sampling. In the former case, similarities are evaluated on the spectral properties and the nodes in the sample graph are less as compared to the original graph. In the latter case, the number of nodes is same in both the graphs but the temporal properties form the basis of the comparison. |
| Random walk performs is implemented in case of Scale-down sampling while Forest Fire is implemented in case of Back-in-time sampling. We propose the integration of both the algorithms and generate an algorithm that makes use of both the spectral and the temporal properties of the graph as the basis for making the comparison between the original graph and the sampled graph. |
Figures at a glance
|
 |
 |
 |
 |
 |
| Figure 1 |
Figure 2 |
Figure 3 |
Figure 4 |
Figure 5 |
|
References
|
- F. Akyildiz, T. Melodia and K. R. Chowdhury, “A survey on wireless multimedia sensor networks,” Computer Networks, Science Direct journal on, Volume 51, Issue 4, pp. 921-960, 2007
- N. Ikram, S. Durranii, H. Sajid and H. Saeed, “A Wireless Multimedia Sensor Network Based Intelligent Safety and Security System (IS³),”Sensor Technologies and Applications, IEEE, pp. 388 – 392, 2009
- B. Harjito, and S. Han, “Wireless Multimedia Sensor Networks Applications and Security Challenges ,” Broadband, Wireless Computing, Communication and Applications, IEEE, pp. 842 – 846, 2010
- S. Poojary and M.M.M. Pai, “Multipath Data Transfer in Wireless Multimedia Sensor Network,” Broadband, Wireless Computing,Communication and Applications, IEEE, pp. 379 – 383, 2010
- K.Dempsey, K. Duraisamy, H. Ali and S. Bhowmick, “ A parallel graph sampling algorithm for analyzing gene correlation networks, ”Procedia Computer Science, Elsevier, Volume 4, pp. 136-145,2011
- M. Kurant, A. Markopoulou, P. Thiran, “On the bias of BFS, ” Teletraffic Congress (ITC), IEEE, pp. 1 – 8,2010
- A Mohaisen, P Luo, Y Li, Y Kim and Z Zhang , “ Measuring bias in the mixing time of social graphs due to graph sampling, ” MILCOM, pp.1-6, 2012
- R Zou and LB Holder , “ Frequent subgraph mining on a single large graph using sampling techniques, ” MLG '10 Proceedings of the EighthWorkshop on Mining and Learning with Graphs, ACM, pp. 171-178, 2010
- M. Gjoka, M. Kurant, C.T. Butts and A. Markopoulou, “ Walking in Facebook: A Case Study of Unbiased Samplingof OSNs, ” INFOCOM,Proceedings IEEE , pp. 1 - 9 ,2010
- J. Leskovec and C. Faloutsos, “Sampling from Large Graphs,” ACM, 2006
- K. Li, “Performance analysis and evaluation of random walk algorithms on wireless networks, ”Parallel & Distributed Processing, IEEE, pp. 18,2010
- J. Wang, X. Yu and J. Yan, “Research on Network Simulation Abstract Technology Based on Simplicity Theory,” Wireless Networks andInformation Systems , IEEE, pp. 186 – 192,2009
- T. Wang1, Y. Chen, Z. Zhang, T. Xu, L. Jin, P. Hui, B. Deng and X. Li, “Understanding Graph Sampling Algorithms for Social NetworkAnalysis,” Distributed Computing Systems Workshops, IEEE, pp. 123 – 128, 2011
- Y. Yoon and J. Chun, “Tracking system for mobile user based on CCTV,” Information Networking (ICOIN), IEEE, pp. 374 – 378, 2014
- W. Yuan, Z. Cao, P. Zhao, M. Tan and Y. Yang, “An object recognition approach based on structural feature for cluttered indoor scene,”Networking, Sensing and Control (ICNSC),IEEE, pp. 92 – 95,2014
- M. Yang, L. Chen and W. Xiong, “Compression/transmission power allocation in multimedia Wireless Sensor Networks,”Computing, Networking and Communications (ICNC), IEEE, pp. 1103 – 1107,2014
- M. Civelek, A. Yazici, C. Yilmazer and F.O.Korkut, “Feature extraction and object classification for target identification at wireless multimedia sensor networks,” Signal Processing and Communications Applications Conference (SIU), IEEE, pp. 778 – 781, 2014.
|