Sejuti Haque1*, Md. Rezaul Karim1
Department of Statistics, Jahangirnagar University, Savar, Bangladesh
Received: 29-Aug-2023, Manuscript No. JSMS-23-111514; Editor assigned: 31-Aug-2023, Pre QC No. JSMS-23-111514(PQ); Reviewed: 20-Sep-2023, QC No. JSMS-23-111514; Revised: 29-Sep-2023, Manuscript No. JSMS-23-111514 (R); Published: 06-Oct-2023, DOI: 10.4172/RRJ Stats Math Sci. 9.3.001.
Citation: Haque S, et al. An Application of Box-Cox Transformation in Quantile Regression . RRJ Stats Math Sci.2023.9.001.
Copyright: © 2023 Haque S, et al. This is an open-access article distributed under the terms of the Creative Commons Attribution License, which permits unrestricted use, distribution, and reproduction in any medium, provided the original author and source are credited.
Visit for more related articles at Research & Reviews: Journal of Statistics and Mathematical Sciences
This paper studies the real data application of Box-Cox transformation in Quantile regression. Box-Cox transformation for quantile regression is implemented to estimate quantiles by estimating parameters. For illustration purposes, an actual data application is included that shows the percentage of daily SARS-Cov-2 infected people tested for COVID-19 infection and climatic variables like temperature and humidity. We discovered that temperature and humidity have a substantial impact on the number of daily SARS-Cov-2-infected individuals screened for COVID-19 infection.
Box-cox transformation; Quantile regression; COVID-19; Temperature; Humidity
One of the primary statistical methods for assessing the strength and nature of a relationship between a group of response variables and a group of covariates is regression. The average association between a set of response variables and a set of covariates is the main focus of the mean regression. It offers just one conditional distribution characteristic. Besides, mean regression is highly influenced by extreme values. It is not usable when the quantile of conditional distribution is the main interest (see for example) [1]. On the contrary, according to a linear function of the explanatory variables, quantile regression expresses the conditional quantiles of a dependent variable. It provides full characteristics of the distribution. Compared to mean regression, it is more robust to outliers. It is the sole regression technique that can be used to determine how a covariate affects response variables at various quantile levels. The linear quantile regression model with a power transformation on the response variable is discussed in this paper. Like the classical Box–Cox transformation approach, it extends the applicability of linear models without resorting to nonparametric smoothing, but transformations on the quantile models are more natural due to the equivariance property of the 1 quantiles under monotone transformations [2]. We discussed about Box-Cox transformation. Quantile regression and its theoritical properties is also outlined. To illustrate the applications of the power transformed linear quantile regression model, we consider a real life data in real life application section. Finally concluding remarks are addressed at the end. This Chapter suggests that, the Box-Cox transformed linear quantile regression model can be a useful tool in data analysis.
Box-cox transformation
Data transformations aimed for achieving a certain goal, such as variance stability, effect additivity, and density symmetry. If a suitable transformation is discovered, the standard technique of analysis will be offered. Let W be a random variable on the positive half-line. Then the Box–Cox transformation of W with power parameter λ is defined by
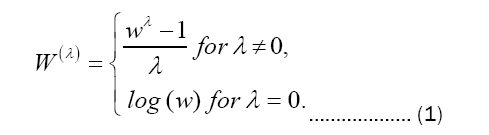
The formula ( Wλ−1)/λ is chosen so that W(λ) is continuous as λ tends to zero and monotone increasing with respect to w for any λ.
Quantile regression
In statistics, quantile regression is a sort of regression analysis that estimates the conditional median (or other quantiles) of the response variable, whereas the method of least squares calculates the conditional mean of the response variable across values of the predictor variables. It is employed when the linear regression requirements aren’t met (i.e., linearity, homoscedasticity, independence, or normality).
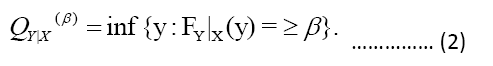
The βthconditional quantile of X given Y is the βth quantile of the conditional probability distribution of Y given X,
 .
.
We use a capital Q to denote the conditional quantile to indicate that it is a random variable. We assume that the βth conditional quantile is presented as a linear function of the explanatory factors in quantile regression for the βth quantile.
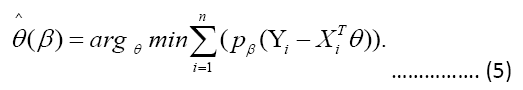
This means that, rather than being constants, the beta coefficients are now functions that are quantile dependent. Given the distribution function of Y , can be obtained by solving
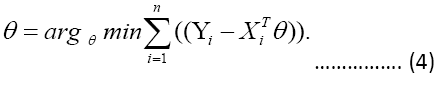
Solving the sample analog gives the estimator of θ,
When β=0.5 the loss function ρβ is proportional to the absolute value function and thus median regression is the same as linear regression by least absolute deviations. The check function ρ is used here, and it gives the error asymmetric weights based on the quantile and overall sign of the error. In terms of mathematics, ρ it has the following form:
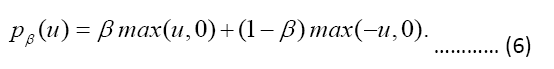
In this case, µ is the error of a single data point and the max function returns the largest value in the parentheses. This means that if the error is positive, then the check function multiples the error by β and if the error is negative, then the check function multiples the error by (1−β). Quantile regression produces mathematical representations that are unique from those produced by the least squares approach. Because the least squares technique considers problems in an inner product space involving projection onto subspaces, the task of minimizing squared errors can be simplified to a numerical linear algebra problem. The minimization problem can be restated as a linear programming issue because quantile regression lacks this structure.
Real data application
The daily reports of the Institute of Epidemiology Disease Control and Research (IEDCR), Dhaka, Bangladesh, were used to collect data on COVID-19 instances from March 18, 2020 to February 12, 2021 in Bangladesh.
Exploratory data analysis
This section included descriptive data as well as various graphs depicting the variables. These are useful for analyzing raw data and determining whether or not a more complex statistical model should be used. It contains descriptive information on the daily proportion due to COVID-19 infected new patients, as well as climatic variables such as temperature and humidity, for n=332 days.
Figure 1a shows a histogram with density plot of the number of new infected cases caused by COVID-19. The figure shows that the proportion of daily infected cases has a distributional shape that resembles a skewed pattern. Since the estimator of the location parameter 3 of the Laplace distribution is the sample median, this distribution can be used to fit median regression models [3].
This clearly indicates that without transformation we cannot get better result. That’s why, we employ Box-Cox transformation to obtain improve inference on transformed variable. Figure 1b depicts a histogram with density plot of the number of new infected cases caused by COVID-19 after Box-Cox transformation. The figure illustrates a symmetric pattern as laplace distribution curve in the proportion of daily infected cases (Figures 1A and 1B).

Figure 1: Histogram for (A) Proportion of daily new infected cases; (B) Proportion of daily new infected cases after Box-Cox transformation.
Quantile regression model
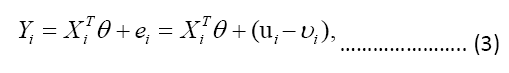
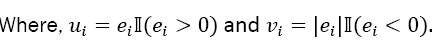
We consider the following regression model to explore solely the conditional association between response variables W(λ)and two covariates named temperature (X1) and humidity (X2). Table 1 represents the summary statistics of quantile regression model. The Quantile regression model is
| Estimate | Coefficients | Std. error | tvalue | P-value |
|---|---|---|---|---|
| Intercept | -0.1843 | 0.0242 | -7.6076 | <0.0001 |
| Temperature | 0.006 | 0.0006 | 10.4872 | <0.0001 |
| Humidity | 0.0017 | 0.0003 | 7.9889 | <0.0001 |
Table 1. Summary statistics of the estimated median regression model for model (1).
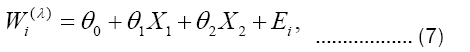
Table 2 shows a significant relationship between temperature and proportion of daily infected cases due to COVID-19 on different level of quantiles. Like temperature, the humidity also significant relationship with proportion of daily infected cases due to COVID-19 (Figures 2A and 2B).

Figure 2: Scatter diagram for P-value for temperature (A) P-value for humidity; (B) after implementing quantile regression.
The beauty of Quantile regression is that, we can find the values of co-efficient for different levels of quantiles. Table 2 shows the values of coefficients with associated P-values for 10%, 25%, 50%, 75% and 90% quantiles. Figure 3 represents a scatter plot of proportion of daily infected cases COVID-19 vs. daily temperature and humidity with different quantile regression lines. The plot shows a scatterplot for a sample of 332, superimposed on the plot are the different quantile regression lines in red (Figures 3A and 3B).
| Q0.1 | Q0.25 | Q0.50 | Q0.75 | Q0.90 | ||
|---|---|---|---|---|---|---|
| Proportion | Coffefficient | -0.1909 | -0.1441 | -0.1843 | -0.1839 | -0.1443 |
| std. Error | 0.0267 | 0.0252 | 0.0242 | 0.0146 | 0.0187 | |
| t−value | -7.1391 | -5.7181 | -7.6076 | -12.5767 | -7.6904 | |
| P−value | 0 | 0 | 0 | 0 | 0 | |
| Temperature | Coefficient | 0.0056 | 0.0053 | 0.0066 | 0.0077 | 0.0074 |
| std. error | 0.0005 | 0.0005 | 0.0006 | 0.0003 | 0.0005 | |
| t−value | 10.976 | 10.114 | 10.4872 | 20.113 | 12.9601 | |
| P−value | 0 | 0 | 0 | 0 | 0 | |
| Humidity | Coefficient | 0.0015 | 0.0012 | 0.0017 | 0.0017 | 0.0014 |
| std. error | 0.0002 | 0.0002 | 0.0002 | 0.0001 | 0.0001 | |
| t−value | 6.4738 | 4.8932 | 7.9889 | 5.2215 | 8.7375 | |
| P−value | 0 | 0 | 0 | 0 | 0 |
Table 2. The summary statistics of quantile regression models at different levels of quantiles for model (1).

Figure 3: Scatterplot and quantile regression fit of (A) proportion of daily infected cases COVID-19 vs. daily temperature; (B) proportion of daily infected cases COVID-19 vs. daily humidity.
In this chapter, we look at the linear quantile regression model with the Box-Cox transformation on response. The Box-Cox transformation is applied on response to avoid the crossing problem. A real data application including the proportion of daily SARS-Cov-2 infected people tested for COVID-19 infection the significant effects of temperature and humidity, meteorological factors such as temperature, humidity is applied to find the significant effects of temperature and humidity on proportion of daily new infected cases due to COVID-19. After implementing the quantile regression model we have investigated that both temperature and humidity have significant impact on the proportion of daily SARS-Cov-2 infected people.3
This research has been conducted with the financial support of a research grant from Jahangirnagar University..
The authors have no conflicts of interest to declare.
This work was carried out in collaboration between all authors. ‘Md. Rezaul Karim’ designed the study, performed the statistical analysis, wrote the protocol, and wrote the first draft of the manuscript. ‘Sejuti Haque’ managed the analyses of the study and managed the literature searches. All authors read and approved the final manuscript.