Keywords
|
| Gene expression data, Locality Sensitive Discriminant Analysis, Artificial Bee Colony, Fuzzy c Means |
INTRODUCTION
|
| For the past few years, microarrays have emerged as a widely used technology for the monitoring of the expression levels of thousands of genes during various biological processes and functions. Extracting the hidden information in this huge volume of gene expression data is quite challenging, and, therefore the need for computationally efficient methods to mine gene expression data is a thrust area for the research community [1]. |
| Moreover, it is a fact that, because of the complexity of the underlying biological processes, gene expression data attained from DNA microarray technologies are mostly noisy and have very high dimensionality. This scenario makes mining of such data very tough and challenging for prediction [3]. Several data mining techniques have been used to address the above mentioned challenge and clustering is one of the most popular tools found capable in analyzing the gene expression data with better accuracy. Clustering techniques identify the inherent natural structures and the interesting patterns in the dataset [2]. |
| The purpose of clustering gene expression data is to reveal the natural structure inherent in the data. A good clustering algorithm should depend as little as possible on prior knowledge, for example requiring the predetermined number of clusters as an input parameter. Clustering algorithms for gene expression data should be capable of extracting useful information from noisy data. Gene expression data are often highly connected and may have intersecting and embedded patterns [4, 5]. Therefore, algorithms for gene-based clustering should be able to handle this situation effectively. Finally, biologists are not only interested in the clusters of genes, but also in the relationships (i.e., closeness) among the clusters and their sub-clusters, and the relationship among the genes within a cluster (e.g., which gene can be considered as the representative of the cluster and which genes are at the boundary area of the cluster) [6]. A clustering algorithm, which also provides some graphical representation of the cluster structure, is much favored by the biologists. |
RELATED WORKS
|
| K-means is a typical partition-based clustering algorithm used for clustering gene expression data. It divides the data into pre-defined number of clusters in order to optimize a predefined criterion. The major advantages of it are its simplicity and speed, which allows it to run on large datasets [8]. However, it may not yield the same result with each run of the algorithm. Often, it can be found incapable of handling outliers and is not suitable to detect clusters of arbitrary shapes. Self Organizing Map (SOM) is more robust than K-means for clustering noisy data. It requires the number of clusters and the grid layout of the neuron map as user input. Specifying the number of clusters in advance is difficult in case of gene expression data [9]. Moreover, partitioning approaches are restricted to data of lower dimensionality, with inherent well-separated clusters of high density. But, gene expression data sets may be high dimensional and often contain intersecting and embedded clusters. |
| Clustering methods for gene expression data should be capable of revealing the inherent structure of the data, extracting useful features from even noisy data, identifying the highly connected and embedded patterns in the data and finding the relationships between the clusters and their sub-clusters [7]. |
| A hierarchical structure can also be built based on SOM such as Self-Organizing Tree Algorithm (SOTA) [10]. Another example of SOM extension is the Fuzzy Adaptive Resonance Theory (Fuzzy ART) [11] which provide some approaches to measure the coherence of a neuron (e.g., vigilance criterion). The output map is adjusted by splitting the existing neurons or adding new neurons into the map, until the coherence of each neuron in the map satisfies a user specified threshold. |
| K-nearest neighbor based density estimation technique is proposed [12]. Another density based algorithm proposed for in three phases: density estimation for each gene, rough clustering using core genes and cluster refinement using border genes. A density and shared nearest neighbor based clustering method is presented [13]. The similarity measure used is that of Pearson?s correlation and the density of a gene is given by the sum of its similarities with its neighbors. The use of shared nearest neighbor measure is justified by the fact that the presence of shared neighbors between two dense genes means that the density around the dense genes is similar and hence should be included in the same cluster along with their neighbors. |
| Fuzzy clustering approaches have received considerable focus recently because of their capability to assign one gene to more than one cluster (fuzzy assignment), which may allow capturing genes involved in multiple transcriptional programs and biological processes. Fuzzy C-means (FCM) is an extension of K-means clustering and bases the fuzzy assignment of an object to a cluster on the relative distance between the object and all cluster centroids. Many variants of FCM have been proposed in the past years, including a fuzzy clustering approach, FLAME [15], which detects dataset-specific structures by defining neighborhood relations and then neighborhood approximation of fuzzy memberships are used so that non-globular and nonlinear clusters are also captured. |
METHODOLOGY
|
| The proposed approach consists of two stages namely dimensionality reduction using Locality Sensitive Discriminant Analysis (LSDA) and clustering using MoABC. |
| A. Locality Sensitive Discriminant Analysis |
| A novel linear dimensionality reduction algorithm called Locality Sensitive Discriminant Analysis (LSDA). For the class of spectrally based dimensionality reduction techniques, it optimizes a fundamentally different criterion compared to classical dimensionality reduction approaches based on Fisher?s criterion (LDA) or Principal Component Analysis. |
| B. Locality Sensitive Discriminant Objective Function for Dimensionality Reduction |
| It is observed that naturally occurring data may be generated by structured systems with possibly much fewer degrees of freedom than the ambient dimension would suggest, a number of research works have been developed with the case considering when the data lives on or close to a submanifold of the ambient space [15]. Then, geometrical and discriminant properties of the submanifold from random points lying on this unknown sub-manifold should be estimated. In this paper, the particular question of maximizing local margin between different classes is considered. |
| The nearest neighbor graph G with weight matrix W characterizes the local geometry of the data manifold. It has been frequently used in manifold based learning techniques, such as [16, 17, 18]. However, this graph fails to discover the discriminant structure in the data. |
| Now consider the problem of mapping the within-class graph and between-class graph to a line so that connected points of ???? stay as close together as possible while connected points of ???? . stay as distant as possible. Let ?? = (??1, ??2,· · · , ???? )T be such a map. A reasonable criterion for choosing a “good” map is to optimize the following two objective functions: |
 |
| Under appropriate constraints. The objective function on equation (1) on within-class graph incurs a heavy penalty if neighboring points ???? and ???? are mapped far apart while they are actually in the same class. Likewise, the objective function in equation (2) on between-class graph incurs a heavy penalty if neighboring points ???? and ???? are mapped close together while they actually belong to different classes. Therefore, minimizing equation (1) is an attempt to ensure that if ????and ???? are close and sharing the same label then ???? and ???? are close as well. Also, maximizing (9) is an attempt to ensure that if ???? and ???? are close but have different labels then ????and ???? are far apart. Hence the high dimensional data obtained above is reduced to gene expression data size. Hence it is utilized to cluster the input microarray gene data using MoABC. |
| C. Proposed Artificial Bees Colony Based Fuzzy Clustering |
| The modifications carried out to improve the basic ABC algorithm and its application used to achieve fuzzy clustering is been given in this section. |
| C. Fuzzy c-Means Clustering (FCM) |
| FCM is a clustering algorithm which allows one data may belong to two or more clusters. It is normally used in pattern recognition [19]. It is based on minimization of the following objective function (3): |
 |
| Where, |
| ?? = is any real number greater than 1 |
| ?????? = is the degree of membership of xi in the cluster ?? |
| ???? is the ith of d-dimensional data |
| ???? is the cluster centre of d-dimension data |
| ???? − ???? 2 is the distance measured of similarity between the measured data and the cluster data |
| Fuzzy partitioning is carried out through an iterative optimization of the objective function with the update of membership ?????? and the cluster centres ???? by: |
 |
| ε denotes a termination criterion between 0 and 1, whereas k are the iteration steps. This procedure converges to a local minimum or a saddle point of Jm. |
| E. Artificial Bee Colony Algorithm |
| It is a swarm intelligent method which inspired from the intelligent foraging behaviour of honey bee swarms. It strength is its robustness and its simplicity. It is developed by surveying the behaviour of the bees is finding the food source which is called nectar and sharing the information of food source the bee which is present in the nest. In the ABC the artificial agents are classify into three types; such as employed bee, the onlooker bee and the scout each of the bee plays different role in the process. The employed bee stays on a food source and in its memory provides the neighbourhood of the food source. Each employed bee carries with her information about the food source and shares the information to onlooker bee. The onlooker bees wait in the hive on the dance area, after getting the information from employed bees about the possible food source then make decision to choose a food source in order to use it. The onlooker bees select the food source according to the probability of that food source. The food source with lower quantity of nectar that attracts less onlooker bees compared to ones with a higher quantity of nectar. Scout bees are searching randomly for a new solution.The employed bee whose food source has been abandoned it becomes a scout bee. The goal of the bees in the ABC model is to find the best solution. In the ABC algorithm the number of employed bees is equal to the number of onlooker bees which is also equal to the number of solutions. The ABC algorithm consist of a Maximum Cycle Number (MCN) during each cycle, there are three main parts: |
| ? Sending the employed bees to the food sources and calculate their nectar quantities |
| ? Selecting the food sources by the onlooker bees |
| ? Determining the scout bee and discover a new possible food sources |
| 1. Employed Bee: In the employed bee phase, each employed bee determines a new solution from the neighbourhood of the current food source (solution). The new food source (new solution) is calculated using equation (7). |
 |
| ???????? represents the position of the ?????????? onlooker bee, ??t denotes the iteration number, ???? represents the position of the ith employed bee. ???? denotes randomly chosen employed bee, ?? represents the dimension of the solution and ????(. ) produces a series of random variables in the range [-1,1]. The employed bee compared the current solution with the new solution and memorizes the best one by apply the greedy selection process. When all employed bees have finished this search process, then they share the fitness value (nectar information) and the position of the food source (solution) to the onlooker bees. |
| 2. Onlooker Bee: In the onlooker bee phase, after getting the information about the nectar and position of the food source each onlooker bee selects a food source with a probability of higher nectar information. The movement of the onlookers is calculated using equation (8). |
 |
| ???????? denotes the position of the ?????????? employed bee, ?? represents the number of employed bees, and ???? is the probability of selecting the ?????????? employed bee. If the selected food source is better than the old solution then it is updated otherwise it keeps the old solution. |
| 3.Scout Bee: If a food source position cannot be improved through fixed cycles, it is called „limit’, it means that the solution has been sufficiently exploited, and it may be removed from the population. In this case, the employed bee become scout bees determine a new random food source (solution) position using equation (9). |
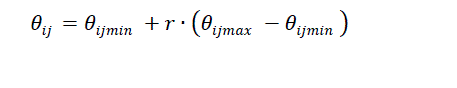 |
| r denotes a random number and ?? ∈ [0,1]. If the new food source is better than the abandoned one, then the scout bee become an employee bee. This process is repeated until the maximum number of cycles (MNC) is reached. Based on the better fitness value the optimal solution is determined by the bee. |
| 4.MoABC based FCM:In order to perform fuzzy clustering for image segmentation using the proposed MoABC-FCM algorithm, a population of SN (??1, ??2, ??3 … . ?????? ) solutions is created, where SN is the number of employed bees or onlooker bees. Each bee represents a potential solution of the fuzzy clustering problem. Each individual bee ???? in generation G is formulated using equation (10): |
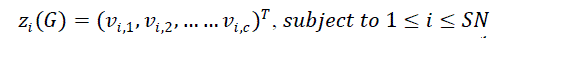 |
| ?? is the number of clusters and, ????,?? represents the ??th cluster center for the ??th bee. |
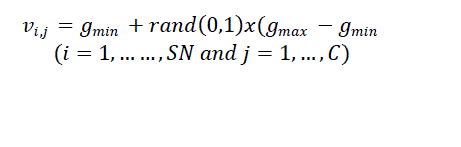
| The position of each individual bee ???? of the population is initialized by randomly chosen cluster centers from the range [???????? , ???????? ], where gmin and gmax are the minimum and the maximum gray levels in the image, respectively. |
 |
| The fitness of a bee indicates the degree of goodness of the solution it represents. In this work, the bee?s quality is measured using the following objective function as in equation (12): |
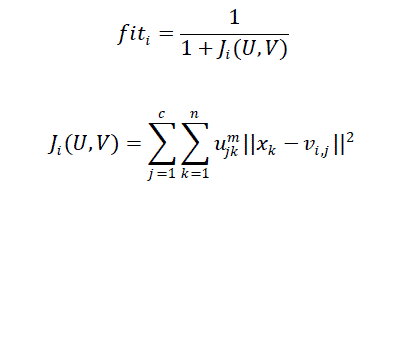 |
| The smaller is ???? , the higher is the individual fitness ???? ???? and the better is the clustering result. The goal of MoABC-FCM algorithm is to determine the optimal position in the search space that satisfies equation (13). When algorithm gets into convergence, it is converted into the optimal fuzzy partition matrix to a crisp partition matrix. The defuzzification is carried out by assigning each pixel to the cluster with the highest membership. |
RESULTS AND DISCUSSION
|
| The proposed technique for evaluating the microarray gene samples of human acute leukemia and colon cancer data are utilized [20]. The high dimensional gene expression data has been subjected to dimensionality reduction and so hence, dimensionality reduced gene data with dimensions has been obtained. Thus, LSDA is applied to identify informative genes and reduce gene dimensionality for clustering samples to detect their phenotypes. |
| A sample of microarray gene dataset of three classes that has been used for testing which are given in the Table II. Clustering for microarray gene expression data whose amount is large can be fully calculated by determining the boundary of the clusters. |
| A sample of microarray gene dataset of three classes that has been used for testing which are given in the Table II. Clustering for microarray gene expression data whose amount is large can be fully calculated by determining the boundary of the clusters. |
| From the Table III, it can be seen that the proposed technique MoABC has provided more accuracy, correlation and less distance and error rate rather than the other gene clustering techniques like FCM, FPCM etc. More accuracy and less error rate leads to effective clustering of the given microarray gene data to the actual class of the gene. |
CONCLUSION
|
| Genes involved in multiple biological processes (simultaneously) may play a major role in one process while playing a minor role in another process. The importance of a gene in multiple processes has potential important for further investigation. In this research paper, an effective microarray gene data clustering technique has been proposed with the features in LSDA and MoABC. Initially, the dimensionality of the microarray data has been reduced with the help of LSDA mechanism. And it has been tested by clustering the microarray gene expression data of human acute leukemia and colon cancer data. From the comparison, it is observed that the approach yields equally good results for the entire functional category. The comparative results have shown that the proposed technique possesses better accuracy, correlation and lesser distance, error rate than FCM, FPCM gene clustering techniques. Hence, the proposed MoABC approach for gene clustering has paved the way for effective information retrieval in the microarray gene expression data. |
Tables at a glance
|
|
|
References
|
- Jiang, D., Tang, C., and Zhang, A. “Cluster analysis for gene expression data: A survey”, Available:
- www.cse.buffalo.edu/DBGROUP/bioinformatics/papers/survey.pdf, 2003. RuiFa, Nandi, A.K. Li-Yun Gong, “Clustering analysis for gene expression data: A methodological review”, 5th International Symposium on Communications Control and Signal Processing (ISCCSP), 2012.
- Ma, P.C.H.; Chan, K.C.C., “Incremental Fuzzy Mining of Gene Expression Data for Gene Function Prediction”, IEEE Transactions on Biomedical Engineering, Volume: 58, Issue: 5, Page(s): 1246- 1252, 2011.
- Belcastro, V. ;Gregoretti, F. ; Siciliano, V. ; Santoro, M. ; D'Angelo, G. ; Oliva, G. ; di Bernardo, D., “Reverse Engineering and Analysis of Genome-Wide Gene Regulatory Networks from Gene Expression Profiles Using High-Performance Computing”, IEEE/ACM Transactions on Computational Biology and Bioinformatics, Volume:9 , Issue: 3, Page(s): 668- 678, 2012.
- Yinyin Yuan and Chang-Tsun Li, “Partial Mixture Model for Tight Clustering in Exploratory Gene Expression Analysis”, Proceedings of the 7th IEEE International Conference on Bioinformatics and Bioengineering, 2007.BIBE 2007.
- Yin, L. and Chun-Hsi Huang, “Clustering of Gene Expression Data: Performance and Similarity Analysis”, First International Multi- Symposiums on Computer and Computational Sciences, 2006.IMSCCS '06.
- Jiang, D., Pei, J. and Zhang A. “DHC: a density-based hierarchical clustering method for time series gene expression data?. In Proceedings of the 3rd IEEE International Symposium on Bioinformatics and Bioengineerin, pp. 393, Bethesda, Maryland, USA, 2003.
- Dhiraj, K.; Rath, S.K.; Pandey, A., “Gene Expression Analysis Using Clustering”, 3rd International Conference on Bioinformatics and Biomedical Engineering , 2009. ICBBE 2009.
- Yano, N. ;Kotani, M., “Clustering gene expression data using self-organizing maps and k-means clustering”, SICE 2003 Annual Conference, Volume:3, Page(s): 3211- 3215 Vol.3, 2003.
- Yin, L.; Chun-Hsi Huang, “Clustering of Gene Expression Data: Performance and Similarity Analysis”, First International Multi-Symposiums on Computer and Computational Sciences, 2006. IMSCCS '06.
- S. Tomida, T. Hanai, H. Honda, and T. Kobayashi, “Analysis of expression profile using fuzzy adaptive resonance theory,” Bioinformatics, vol. 18(8), pp. 1073–83, 2002.
- Chung, S., Jun, J. andMcLeod, D. “Mining gene expression datasets using density based clustering”, Technical Report, USC/IMSC, University of Southern California, No. IMSC-04-002, 2004.
- Syamala, R., Abidin, T. and Perrizo, W. “Clustering Microarray Data based on Density and Shared Nearest Neighbor Measure”. In Proceedings of the 21st ISCA International Conference on Computers and Their Applications (CATA-2006), pp. 23-25, 2006.
- Fu, L. and Medico, E. “FLAME: a novel fuzzy clustering method for the analysis of DNA microarray data”, BMC Bioinformatics, 8(3), 2007.
- Deng Cai, Xiaofei He, Kun Zhou, Jiawei Han, HujunBao “Locality Sensitive Discriminant Analysis”2007.
- M. Belkin and P. Niyogi.“Laplacianeigenmaps and spectral techniques for embedding and clustering”. In Advances in Neural Information Processing Systems 14, pages 585–591. MIT Press, Cambridge, MA, 2001.
- J. Tenenbaum, V. de Silva, and J. Langford.“A global geometric framework for nonlinear dimensionality reduction”. Science, 290(5500):2319– 2323, 2000.
- S. Roweis and L. Saul.“Nonlinear dimensionality reduction by locally linear embedding”. Science, 290(5500):2323–2326, 2000.
- XinqingGeng and Fengmei Tao, “GNRFCM: A new fuzzy clustering algorithm and its application”, International Conference on Information Management, Innovation Management and Industrial Engineering (ICIII), 2012.
- Jian Wen, “Ontology Based Clustering for Improving Genomic IR”, Twentieth IEEE International Symposium International Journal of Data Mining and Bioinformatics,Vol. 3, No. 3, pp.229-259, 2009.
|