Keywords
|
| Data Clustering, K-means, Cluster analysis, Bisection methods. |
INTRODUCTION
|
| Data mining involves the use sophisticated data analysis tools for discover previously unknown, valid pattern and relationships in large datasets. Here clustering is alternatively referred to as unsupervised learning or segmentation. It can be thought of as partitioning or segmenting the data into groups that might or might not be disjointed. [1, 3] A cluster is a collection of objects which are similar between them. Clustering does not have any predefined class. The main advantage of clustering is that interesting patterns and structures can be found directly from very large data sets with little or none of back ground knowledge. The k-means algorithm is successful in producing cluster for many practical applications such as plant and animal classification, image processing, pattern recognition, and document retrieval. But the complexity of the k-means algorithm is very high, especially for large data sets. Moreover, the k-mean algorithm results in different types of clusters on the random choice of initial centroids. [3] So over come of this problem many researchers for improving the performance of k-means algorithms. Here the cluster are formed according to the distance between data points and cluster centers are formed for each cluster for this implementation plan will be in random of input data points. The implementation work was used in mat lab programming software. The number of cluster is chosen by user. Finally cluster is displayed by different colors. |
II. PREVIOUS WORK
|
| Normally, the computer must able retrieve data from a database without any human assumption on specific domain. One of the main task for the system is similarity comparison, extracting feature signatures of every data based on its input values and defining rules of comparing the data’s. So previously the Newton method is assigned for evaluating the cluster using uniform data points. So this process is not effective to handling large datasets. [2, 7] So in order to overcome the previous method limitations, now we apply the bisection method for handling the large dataset with random data inputs |
III. PROPOSED WORK
|
| A system developed for classifying a cluster using adult datasets (fig-3). Here the three main tasks of the system are |
| A. K-means clustering. |
| B. Bisection method. |
| C. Similarity matching. |
| A. K-MEANS CLUSTERING |
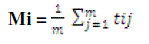
| K-means is an iterative clustering algorithm in which items are moved among sets of clusters until the desired set is reached. A cluster is a collection of data objects that similar to one another with in the same cluster and is dissimilar to the objects in the other clusters. It is the best suited for data mining because of its efficiency in processing large datasets. [1, 5] The cluster mean of |
| Ki = {ti1,ti2,……………….,tim} is defined as |
 |
Algorithm 3.1.The k-means clustering algorithm
|
Input:
|
| D = {d1, d2,......,dn} //set of n data items. |
| k // Number of desired clusters |
Output:
|
| A set of k clusters. |
| 1. Arbitrarily choose k data-items from D as initial centroids; |
| 2. Repeat Assign each item di to the cluster which has the closest centroid; |
| Calculate new mean for each cluster; |
| Until convergence criteria is met. |
| As a result of this loop, the k- centroids may change their position in step-by-step manner. The k-means procedure is easily programmed and is computationally, economical, so that is feasible to process very large samples on a digital computer. The advantage of k-means algorithm is that it works well when cluster are not well separated from each other, which is frequently encountered in data’s. However, the k-means requires the user to specify the initial cluster centers. |
B. BISECTION METHOD
|
Bisection method at the same time gives a Proof of the intermediate value theorem and provides a practical method to find the cluster of the corresponding intervals. Here basically we are allocating the intervals in [1 to 15] for estimating the user requirements [15, 16]. Let f(x) be the continuous function on the intervals [a, b]. let assume that f(a) < 0, while f(b) > 0 , the other case being handled similarly, set a0=a, b0=b. now consider the midpoint m0 = 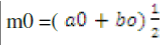 for here our data is segmenting the initial node to end node. For classifying the data, we are following the basic properties. for here our data is segmenting the initial node to end node. For classifying the data, we are following the basic properties. |
| 1. (a0) is increasing sequence; (bn) is a decreasing sequence. |
| 2. an ≤ bn for all n. |
| 3. f (an) < 0 for all n, f(bn) > 0 for all n. |
| 4. bn-an = (b –a) for all n. |
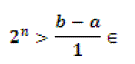
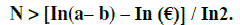
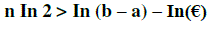
It follows from the first properties that the sequence,(an) and (bn) coverage; set  and and The third property and the continuity of the function f(x) imply that f (a) ≤ 0 and that f (b) ≥ 0. The crucial observation is the fact that the fourth properties implies that a = b. consequently. F (a) = f(b) = 0. When we enter the loop f (a) and f (b) have a opposite sign. It follows that either f (m) or f (a) have an opposite sign. Thus the initial conditions are still satisfied each time we enter the loop. [20, 23] The length of initial condition interval is (b – a). After one time through the loop the length is (b – a) / 2, after two times it is (b- a) /4, after n passes through the loop, the length of the remaining interval is (b – a) /2^n. No matter how small €, eventually (b – a) / 2^n < €. In the fact we can solve this inequality for n The third property and the continuity of the function f(x) imply that f (a) ≤ 0 and that f (b) ≥ 0. The crucial observation is the fact that the fourth properties implies that a = b. consequently. F (a) = f(b) = 0. When we enter the loop f (a) and f (b) have a opposite sign. It follows that either f (m) or f (a) have an opposite sign. Thus the initial conditions are still satisfied each time we enter the loop. [20, 23] The length of initial condition interval is (b – a). After one time through the loop the length is (b – a) / 2, after two times it is (b- a) /4, after n passes through the loop, the length of the remaining interval is (b – a) /2^n. No matter how small €, eventually (b – a) / 2^n < €. In the fact we can solve this inequality for n |
 |
| Check the loop with in n times, whether the cluster in behind the centre or not, for checking we are use below inequality condition. |
 |
| After Checking in equality condition we are calculate the Length the attributes in below condition |
 |
| Finally we are check the nearer attributes in the root of the equation. |
 |
| For this equation compute the classified data in data mining. Compare the speed of convergence the Newton method can be unreliable. If algorithms encounters a point x where f ‘(x) = 0, it crashes; if it encounters point where the derivative is very close to 0 it will become unreliable. The bisection method on the other hand will always work, once you have found starting points a and b where the takes opposite signs and classifying the given data sets. For the below figure- 4 represents bracket technique for using entering the attributes of data clustering [23]. The main usage of bracket rule in applying data mining is to obtaining the data attributes to extract the cluster. |
Bracket rule algorithm.
|
| 1. f(a) f(b) < 0 |
| 2. c = 0.5 (a + b) |
| 3. check f(a) f(c) < 0: |
| % if not then f(c) f (b) < 0 |
| Repeat. This algorithm examines the no of attributes of clustering. |
Bisection algorithm:
|
| The steps to apply the bisection method to find the intervals of the equation as well as find attributes of data cluster. |
| 1. Choose xl and xu as two guesses for the root such that f ( xl) f (xu) <0, or in the other words, f(x) changes sign between xl and xu. |
| 2. Estimate the root, xm, of the equation f(x) = 0 as the midpoint between xl and xu as xm = xl +xu/2. |
| 3. Now check the following |
| a) f(xl) f(xm) < 0 then the root lies between xl and xm; then xl = xl and xu = xm. |
| b) f(xl) f(xm) > 0 then the roots lies between xm and xu; then xl= xm and xu = xu. |
| c) If f(xl) f(xm) = 0; then the root is xm. stop the algorithm if this is true. |
| 4. Find the new estimate of the root xm = xl + xm / 2. |
| Find the absolute relative approximate error as finding the present iteration and previous iteration calculation process. |
| | ? | = xm (new) – xm (old)/ xm(new) * 100. |
| 5. Compare the absolute relative approximate error | ? | with the pre-specified relative error tolerance ?s. if | ?a | > ?then go to step 3, else stop the algorithm. |
| Note one should also check whether the number of iterations is more than the maximum of iterations allowed. If so, one needs to terminate the algorithm and notify the user about it. |
C. SIMILARITY MATCHING
|
| Euclidean distance is used for similarity matching in the present system. The Euclidean distance between two points p = ( p1, p2,…pn) And Q = (q1, q2,...qn), in Euclidean space, is defined as: |
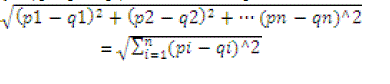 |
| System calculates the Euclidean distance of data of given query data to all other data in the data base. As with classification, then we measure the similarity distance or measure, sim (ti, tl) defined by two tuples, ti, tl € D. Some of the clustering algorithm looks only at numeric data, usually assuming metric data points. But Euclidean distance handle both numeric data and image data in a given data base. |
IV. RESULTS AND DISCUSSION
|
| For this paper we are taken an adult dataset to computing the various techniques like clustering and bisection methods for predicating the cluster. The resulting cluster of random data points of k – means algorithm is presented in fig -1, 2. |
| The random data points can be taken to easily implement and take the results of convenient for our data sets. Data points are given by the user during the execution of the program. For different input data points, the algorithm gives different outputs. |
V. CONCLUSION
|
| In this research, the random data points are used easily implement the values and get good results. For main purpose of using this research is privacy and security for data clustering. For this paper the future work is to calculate suppression for corresponding data sets. So at last the effective k- means and bisection for numerical methods is very efficient to classify the cluster in large data sets. |
Figures at a glance
|
 |
 |
 |
| Figure 1 |
Figure 2 |
Figure 3 |
|
| |
References
|
- Margaret H. Dunham, Data Mining- Introductory and Advanced Concepts, Pearson Education, 2006.
- R.Velmurugan,T.Santhanam“Computational plexity between k-means and k-medoid clustering algorithm for normal and uniform distribution of data points.”journal of computer science 6(3):363-368, 2010, ISSN 1549-3636.
- Borah, S. and M.K. Ghose, 2009 “Performance analysis of AIM-K-Means and K-Means in quality cluster generation.” J. Comput., 1: 175-178.
- Park, H.S., J.S. Lee and C.H. Jun, 2006. “A K-means like algorithm for K-medoids clustering and its performance.
- Rakhlin, A. and A. Caponnetto, 2007. “Stability of k-Means clustering”. Adv. Neural Inform. Process. Syst., 12: 216-222.
- Xiong, H., J. Wu and J. Chen, 2009. “K-Means clustering versus validation measures: A data distribution perspective.” IEEE Trans. Syst.,Man,Cybernet. Part B, 39: 318-331.
- Pang-Ning Tan, Michael Steinback and Vipin Kumar, “Introduction to Data Mining”, Pearson Education, 2007.
- Stuart P. Lloyd, “Least squares quantization in pcm,” IEEE Transactions on Information Theory, 28(2): 129-136.
- Yuan F, Meng Z. H, Zhang H. X and Dong C. R, “A New Algorithm to Get the Initial Centroids,” Proc. of the 3rd International Conference on Machine Learning and Cybernetics, pages 26–29, August 2004.
- MacQueen, J.: “Some Methods for Classification and Analysis of Multivariate Observations.” In Proceedings Fifth Berkeley SymposiumMathematics Statistics and Probability.
- Fahim A.M, Salem A. M, Torkey A and Ramadan M. A, “An Efficient enhanced k- means clustering algorithm,” Journal of ZhejiangUniversity, 10(7):1626–1633, 2006.
- Margaret H. Dunham ”Data Mining: Introductory and Advanced Topics.” 1st Edn., Prentice Hall, USA., ISBN: 10: 0130888923, pp: 315.
- S. Almgren, J. B. Bell, P. Colella, and L. H. Howell, Adaptive projection method for the incompressible Euler equations, in Proceedings of the Eleventh AIAA Computational Fluid Dynamics Conference, AIAA, June1993, p. 530.
- S. Almgren, J. B. Bell, andW. Y. Crutchfield, Approximate projection methods. 1. Inviscid analysis, SIAM J. Sci. Comput. 22(4), (2000).
- S. Almgren, J. B. Bell, and W. G. Szymczak, A numerical method for the incompressible Navier–Stokes equations based on an approximate projection, SIAM J. Sci. Comput. 17(2), (1996).
- BA?STINEC, J., DIBL´IK, J.: Asymptotic formulae for a particular solution of linear non homogeneous discrete equations. In Advances indifference equations, IV.,Comput. Math.Appl. Vol. 45, No. 6-9, pp. 1163-1169, 2003.
- BA?STINEC, J., DIBL´IK, J., R°U ?ZI?CKOV´A, M.: Initial data generating bounded solutions of linear discrete equations. In Opuscula Math.Vol. 26, No. 3, pp. 395-406, 2006.
- DIBL´IK, J.: Discrete retract principle for systems of discrete equations. In Advances in difference equations, III.,Comput. Math. Appl. Vol.42, No. 3-5, pp. 515-528, 2001.
- DIBL´IK, J.: Asymptotic behaviour of solutions of discrete equations. In Funct. Differ. Equ.,No. 11, pp. 37-48, 2004.
- Petersen, J. and Bodson, M. (2000). Control allocation for systems with coplanar controls. In AIAA Guidance, Navigation and Control
- Conference Proceedings. AIAA Paper 2000-4540.
- Petersen, J. and Bodson, M. (2002). Fast implementation of direct allocation with extension to coplanar controls. Journal of Guidance, Control, and Dynamics, 25(3), 464–473.
- Pulecchi, T.andLovera, M. (2007). Attitude control of spacecraft with partially magnetic actuation. In Proceedings of 17th IFAC Symposium on Automatic Control in Aerospace.
|