Keywords
|
| Acoustic wave, electromagnetic waves, sonar waves, Sensor |
INTRODUCTION
|
| The maximum surface of our earth is covered by 70% of water. There are lots of uses of underwater environment like oceanographic monitoring, scientific exploration, disaster monitoring and also especially for oil/gas field exploration. It is difficult to use wired system underwater conditions. The two waves which can be used to establish underwater communication systems are sonar waves and electromagnetic waves [1, 2]. Sonar and electromagnetic waves are different in nature. Sonar waves are caused by a physical vibration of particles and electromagnetic waves are caused by interference in an electromagnetic field. Because of their physical nature, sonar wave’s performance is very good when used in an underwater environment. When it is in underwater communication it suffers from air-water interface. Underwater acoustic communication in the ocean could be highly time-varying and spatial-varying, hence, posing major challenges to the design and development of effective communication systems for underwater applications. Due to the large attenuation and absorption electromagnetic signal does not propagate well in the seawater. Optical signals like lasers cannot be used in under water communication it also absorbed or scattered due to the suspended particles in the upper part of the water .Therefore, acoustic communication is still considered as preferred method for underwater communication, especially for long-distance transmissions. Limited and distance-dependent bandwidth, large propagation delay, severe time-varying multipath and fading channel conditions make the characteristics of the underwater acoustic channel quite different from the commonly used terrestrial ones. |
SONAR WAVES
|
| Basically sonar waves are vibrations produced by physical particles around us like air particles, dust particles water particles. These are expressed as a pressure equation (db) in mathematical form. In air sonar waves travel with the speed of about 400m/sand in water it can increases up to 1500m/s. The propagation speed of these waves depends on physical criteria of the medium like density and temperature |
| A. Sonar Waves in Under Water Communication:- |
| As we know in underwater propagation of sonar waves are mostly dependent on the physical characteristics. These criteria changes rapidly over the air –water interface. When the density of water is much greater than the air density, the medium density will change suddenly. |
| There are basically two types of sonar communication |
| 1. Active sonar communication system |
| 2. Passive sonar communication system |
| 1 Active sonar communication system:- |
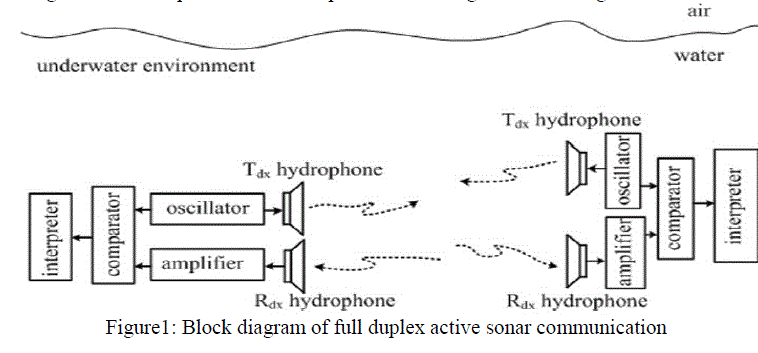
| As shown in fig. active sonar system is fixed with two sets of hydrophone, one of them is acting as transmitter and other one acting as receiver hydrophone. The transmitter hydrophone converts the output of oscillator that is electrical signal into equivalent sonar waves that will propagate in water. The receiver hydrophone receives the sonar waves and then converted them into electrical signals. The interpreter circuit interprets the meaning of received signal. |
| 1.1 Half duplex active sonar communication:- |
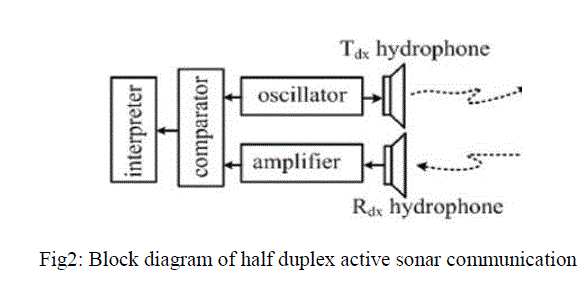
| Fig.2 shows the half duplex active sonar communication system. In this type of system transmitter hydrophone transmit sonar waves into the water until it reaches the target; then, sonar waves get reflected back to the receiver hydrophone. The transmitted and received signals are compared with each other and interpreter interpreted the compared signal into meaningful information. |
| 2. Passive Sonar Communication System:- |
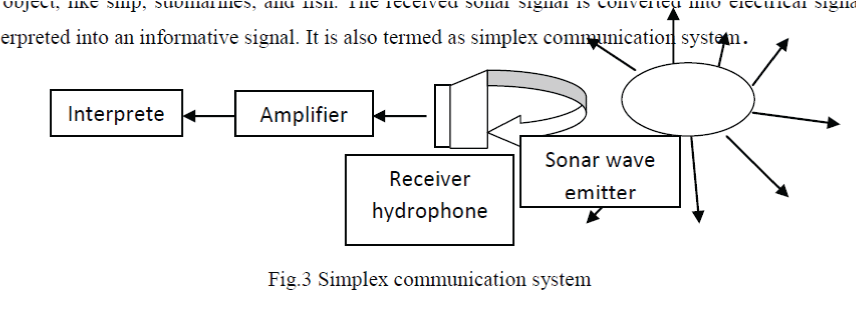
| Fg.3 shows the simple layout of the passive sonar communication system .It can detect any type of sonar signal emitted by underwater object, like ship, submarines, and fish. The received sonar signal is converted into electrical signal, amplified and then interpreted into an informative signal. It is also termed as simplex communication system. |
ACOUSTIC UNDERWATER COMMUNICATION ARCHITECTURE
|
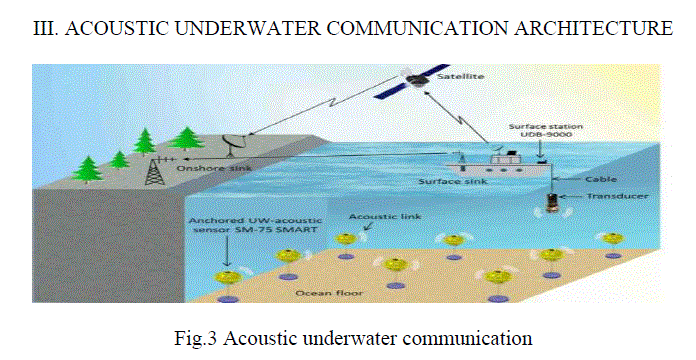
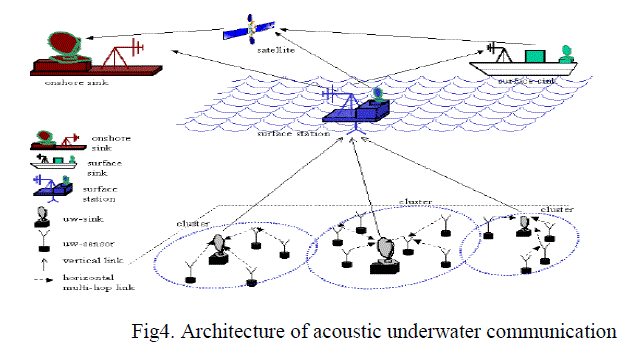
| In underwater network system, a group of sensor nodes are anchored to the bottom of the ocean or may be interconnected to one or more underwater gateways by wireless acoustic links. The sensor network, usually use multi-hop paths, sends data from the ocean bottom network to a surface station. Underwater gateways may be equipped with two acoustic transceivers, namely a vertical and a horizontal transceiver. The horizontal transceiver is used by the underwater gateways to communicate with the sensor nodes to send commands and configuration data to the sensors and/or collect monitored data [3]. The vertical link is used by the underwater gateways to send data to a surface station. The vertical transceivers are usually used as long range transceivers in deep water applications. The surface station may be connected with an acoustic transceiver able to handle multiple parallel communications with the deployed underwater gateways and may communicate with an onshore sink and/or to a surface sink through a long-range radio transmitter and/or satellite transmitter (see Fig.3). Sensor nodes may float at different depths to observe a given phenomenon. One possible solution is to attach each sensor node to a surface buoy, by means of wires whose length can be regulated to adjust the depth of each sensor node. Although this solution enables easy and quick deployment of the sensor network, floating buoys may obstruct ships navigating on the surface, or they can be easily detected and deactivated by enemies in military settings. Furthermore, floating buoys are vulnerable to weather and tampering or pilfering. Typically, sensing devices are anchored to the bottom of the ocean, and are equipped with floatation capabilities. |
| A. Types of Underwater Communication System Architecture:- |
| 1. 2-D Architecture:- |
| 2. Sensor nodes are anchored to the bottom of the ocean with deep ocean anchors. |
| 3. By means of wireless acoustic links, underwater sensor nodes are interconnected to one or more underwater sinks (UW-sinks). |
| 4. UW-sinks are equipped with two acoustic transceivers, horizontal and vertical transceiver. The first is used by the UWsinks to communicate with the sensor nodes, while the second is used by the UW-sinks to relay data to a surface station. Vertical transceivers must be long range transceivers for deep water applications |
| The surface station is equipped with multiple acoustic transceivers, one for each UW-sink deployed. |
| 5. It is also endowed with a long range RF or satellite transmitter to communicate with the onshore sink (OS-sink) or to a surface sink (s-sink). |
| 6. Sensors can be connected to sinks by means of direct links or through multi-hop paths. In case of multi-hop paths, as in terrestrial sensor networks [4], data produced by a sensor is relayed by intermediate sensors until it reaches the UWsink. |
| CHALLENGES IN 2-D ARCHITECTURE: |
| Sensing coverage: Sensors should collaboratively regulate their depth in order to achieve full column coverage, according to their sensing ranges. Hence, it must be possible to obtain sampling of the desired phenomenon at all depths. |
| Communication coverage: Since in 3D underwater networks there is no notion of uw-sink, sensors should be able to relay information to the surface station via multichip paths. Thus, network devices should coordinate their depths such a way that the network topology is always connected, i.e., at least one path from every sensor to the surface station always exists. |
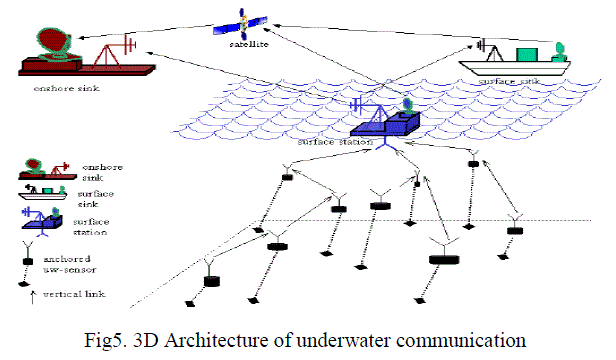
| B. 3-D Architecture:- |
| 1. Sensor nodes float at different depths in order to observe a given phenomenon. |
| 2. The possible solution to achieve different depths would be to attach each UW-sensor node to a surface buoy, by means of wires |
| 3. Multiple floating buoys may obstruct ships navigating on the surface |
| They may also be easily detected and deactivated by enemies in military settings. Due to the above reasons, each sensor is anchored to the ocean bottom and equipped with a floating buoy that can be inflated by a pump. The buoy pushes the sensor towards the ocean surface. The depth of the sensor can then be regulated by adjusting the length of the wire that connects the sensor to the anchor, by means of an electronically controlled engine that resides on the sensor. |
BASICS OF ACOUSTIC UNDERWATER COMMUNICATION
|
| Acoustic waves enable communications over long-distance since they suffer from relatively low absorption. Still, Underwater Acoustic communications are also affected by high path loss, noise, multipath, high and variable propagation delay and Doppler spread. The combined effect of these phenomena causes the UW-A channel to be temporally and spatially variable. This limits the available bandwidth and makes it dependent on both range and frequency. Depending on their range, underwater acoustic communication links can be classifieds very long, long, medium,short and very short [5]. Typical bandwidths of underwater links for various ranges are presented in Table 1 |
FACTORS INFLUENCE ACOUSTICUNDERWATER COMMUNICATIONS
|
| 1. Transmission Path Loss: |
| It is mainly caused by two phenomena: |
| a. Geometric spreading loss |
| b. Attenuation |
| Transmission loss for a signal of frequency f [kHz] over a transmission distance d [m] can be expressed in [dB] as |
| 10 log TL (d, f) = k · 10 log (d) + d · (f) + A, (23.1) |
| Where k is the spreading factor, which describes the geometry of propagation, (f) [dB/m] is the absorption coefficient and A [dB] is the so-called transmission anomaly which accounts for factors other than absorption including multipath propagation, refraction, diffraction and scattering [6, 7], typically, spreading loss depends only on propagation range therefore it is frequency independent. |
| A. Two common types of geometric spreading: |
| 1. Spherical geometric spreading: It occurs when acoustic waves spread spherically outward from a source in an unbounded medium which characterizes deep water communications. [8] |
| 2. Cylindrical geometric spreading: it occurs when acoustic waves spread horizontally because of a medium which has parallel upper and lower bounds which characterizes shallow water communications. The spreading factor, k is equal to 1 for cylindrical and 2 for spherical spreading. In practice, a spreading factor of k = 1.5 is often considered. [8] |
| B. Attenuation:- |
| Attenuation can be mainly concerned to absorption, caused by conversion of energy of the propagating acoustic wave into heat (also referred to as absorption loss). The absorption coefficient for frequencies above a few hundred Hz can be expressed empirically using Thorp’s formula [9],which defines α(f) [dB/m] as a function of f [kHz] |
| α (f) = (0.11f2/f2 + 1+ 44(f2/f2 + 4100) + 2.75 · 10−4f2 ++0.003) · 10−3 |
| For lower frequencies, the absorption coefficient can be expressed as [10] |
| α(f) = (0.002 + 0.11(f2/f2 + 1)+ 0.011f2) ·10−3 |
| C. Noise:- |
| It can be artificial or man-made. The latter is mainly caused by machinery noise (pumps, reduction gears, power plants), and shipping activities, while the former is produced by biological, seismic activities and hydrodynamics (waves, currents, tides, rain, and wind). The contributions of the major noise sources can be expressed through empirical formulae [11, 10], which provide power spectral densities of each source relative to frequency f [kHz] in [dB re μ Pa per Hz] |
| 10 logNt(f) = 17 − 30 log f, (23.6a) |
| 10 logNs(f) = 40 + 20(s − 5) + 26 log f − 60 log(f + 0.03), (23.6b) |
| 10 logNw(f) = 50 + 7.5w1/2 + 20 log f − 40 log(f + 0.4), (23.6c) |
| 10 logNth(f) = −15 + 20 log f, (23.6d) |
| where Nt, Ns, Nw, Nth stand for turbulence, shipping, wind and thermal |
| noise, respectively. The total noise power spectral density for a given frequency |
| f [kHz] is then |
| N (f) = Nt(f) + Ns(f) + Nw(f) + Nth(f). |
| In shallow water, noise is difficult to model or predict compared to the deepwater case, since it shows greater variability in both time and location. In [6], three major noise sources in shallow water environments are identified as wind noise, biological noise (especially noise created by snapping shrimp whose noise signature has a high amplitude and wide bandwidth) and shipping noise. |
| D. Multipath:- |
| Multipath arises from either wave reflections from the surface, bottom and other objects, or wave refraction caused by sound speed variations with depth (acoustic waves always bend towards regions where the propagation speed is lower) [6, 9]. Multipath propagation can severely deteriorate the acoustic signal, as it generates inter-symbol interference (ISI) [10]. The multipath geometry depends on the link configuration. Vertical channels typically have little time dispersion, while horizontal channels may show long multipath spreads [11]. The extent of spreading is highly dependent on depth and distance between transmitter and receiver. The channel impulse response for atime-varying multipath underwater acoustic channel can be expressed as [12] |
| C (?,t)= pΣAp(t)δ(?-?p(t)) |
| Where Ap(t) and ?p(t) denote time-varying path amplitude and time-varying path delay respectively. This expression can be used in simulation studies and in developing receiver algorithms [12, 13]. |
| E. Doppler Spread:- |
| The range of frequencies over which the Doppler power spectrum of the channel is nonzero is called the Doppler spread of the channel, and is denoted as Bd [14]. The Doppler spread can be represented in time by the inverse of thecoherence time of the channel, given by [14] |
| Δtc≈1/Bd |
| Doppler spread occurs as a result of Doppler shifts caused by motion at the source, receiver, and channel boundaries. Mobile nodes exhibit a Doppler shift proportional to their relative velocity, while currents and tides can also force moored nodes to move, introducing slight Doppler shifts. In addition to this, tidal and water currents can introduce Doppler shifts that create surface and volume scatterers relative to a fixed receiver [6]. When a channel experiences a Doppler spread with bandwidth B and if a transmitted signal has a symbol duration of T , then there will be BT uncorrelated samples of its complex envelope [11]. If BT is much less than unity, the channel is said to be underspread, and Doppler spread effectscan be basically ignored. If greater than unity, it is said to be overspread [10]. The Doppler spread can be significant in UW-A channels [5], thus causing degradation in the performance of digital communications. ISI occurs at the receiver with high data rate transmission. Doppler spreading generates two different effects on signals: a simple frequency translation, which is relatively easy for a receiver to compensate for and a continuous spreading of frequencies that creates a non-shifted signal. |
APPLICATION OF ACOUSTIC UNDERWATER COMMUNICATION
|
| Ocean Sampling Networks: Networks of sensors and AUVs, such as the Odyssey-class AUVs, can perform synoptic, cooperative adaptive sampling of the 3D coastal ocean environment. Pollution Monitoring: and other environmental monitoring (chemical, biological, etc.) Distributed Tactical Surveillance: AUVs and fixed underwater sensors can collaboratively monitor areas for surveillance, reconnaissance, targeting and intrusion detection systems. |
RECENT ACTIVITIES SHOWS THE IMPORTANTANCE OF ACOUSTIC UNDERWATER COMMUNICATION
|
| It has been argued that the recent disastrous spill that followed the oil-rig explosion in the Gulf of Mexico in the Summer of 2010 could have been prevented by acoustic sensing/actuating systems (recently mandated for example by Norway and Brazil) that can be triggered by acoustic control signals. This example is only one of many demonstrating the importance of underwater acoustic networked sensing, communication, and control systems, and the potential that this technology can offer in addressing major problems of our times such as climate change monitoring, pollution control and tracking, offshore exploration, study of marine life, disaster prevention, and tactical surveillance. |
| Another example of recent initiatives is the joint IBM and Beacon Institute, Beacon, NY announcement of a $15M funding plan from state and corporate sources to create an environmental-monitoring system for New York’s Hudson River by turning the 315 miles of the river into a distributed network of sensors that will collect biological, physical, and chemical information and transmit the data to a central location to be processed by IBM’s data management center. |
CONCLUSION
|
| At last we find out that acoustic waves are best medium for underwater communication. The 3-D architecture is a better way to communicate underwater. But in acoustic waves there are many factors which affect the underwater communication. To remove the effects of factors which influence the underwater communication, further research going on .so we can summarized in one line that acoustic waves are better medium for underwater communication. |
ACKNOWLEDGMENT
|
| The authors are grateful to Dr. Amod Kumar, Scientist “G”. CSIO Chandigarh for providing necessary facilities, encouragement and motivation to carry out this work |
Tables at a glance
|
 |
| Table 1 |
|
| |
Figures at a glance
|
 |
 |
 |
| Figure 1 |
Figure 2 |
Figure 3a |
 |
 |
 |
| Figure 3 |
Figure 4 |
Figure 5 |
|
| |
References
|
- J.Heidemann, Yuan Li, Affan Syed, Underwater Sensor Networking:Research Challenges and Potential Applicat ion, USI/ISI Technical Report ISI-TR-2005-603, 2005
- Antonio MansillaFabregat ,Desenvolupament , proves decampianàlisideresultats en unaxarxa de sensors, Master in Science in Telecommunicat ion Engineering &Management .UniversitatPolitecnica De Catalunya, 2008.
- D.Pompili,T.Melodia,andI.F.Akyildiz. Three –dimensional and two dimensional Development Analysis foe underwater Acoustic Sensor Network.Ad Hoc networks, 7(4); 778-790, June2009.
- L. Freitag and M. Stojanovic, “Acoustic communications for regional undersea observatories,” in Proceedings of Oceanology International, London, U.K., mar 2002.
- M.Stojanovic. Acoustic (Underwater) Communication. In John G.Proakis,editor, Encyclopedia of telecommunication. John Wiley and Sons,2003
- Robert J.Urick.Principle of Underwater Sound.McGraw-Hill, 1983
- D. Pompili and T. Melodia.Three-dimensional Routing in Underwater Acoustic Sensor Network. In Proc. Of ACM PE-WASUM, Montreal, Canada, October 2005.
- Ian F. Akyildiz, Dario Pompili, TommasoMelodiaBroadband& Wireless Networking Laboratory.School of Electrical & Computer Engineering .Georgia Institute of Technology, Atlanta, GA 30332.
- M. Stojanovic. Underwater acoustic communication: Design consideration on the physical layer. In Proc. IEEE / IFIP Fifth Annual Conference on wireless On demand Network System and Service (WONS 2008), pages 1-10, Garmisch-PAretenkirchen, Germany, January 2008
- D. B .Kilfoyle and A. B. Baggeroer. The State of the art in Underwater Acoustic Telemetry. IEEE Journal of Oceanic Engineering , 25:4-27, January 2000
- I. F. Akyildiz, D. Pompili, and T. Melodia. Underwater Acoustic Sensor Network: Research Challenges. Ad Hoc Network (Elsevier), 3(3): 257- 279, May 2005.
- B. Li, M. Stojanovic, L. Freitag, and P. Willett. Multicarrier communication over underwater acoustic channel with non uniform Doppler shifts. IEEE Journal of Oceanic Engineering, 33(2), April 2008.
- S. F. Mason, C. R. Berger, S. Zhou, and P. willet. Detection, synchronization, and Doppler scale estimations with multicarrier waveform in underwater acoustic communication. IEEE Journal of Selected Area in Communication, 26(9), December 2008.
- J. Proakis. Digital Communications. McGraw-Hill, New York, 1995.
|