Keywords
|
| Biomedical, signal processing, MATLAB, FDA Tool, ECG analysis, MIT-BIH arrhythmia, Physiobank ATM, FIR filter, adaptive filter |
INTRODUCTION
|
| Electrocardiogram (ECG) is a valuable technique that has been in use for over a century, not only for clinic applications [2]. ECG acquisition from the human skin involves the use of high gain instrumentation amplifiers. In general, ECG contaminants can be classified into different categories, including power line interference, electrode pop or contact noise, patient-electrode motion artifacts, electromyographic (EMG) noise, and baseline wandering. Among these noises, the power line interference and the baseline wandering (BW) are the most significant and can strongly affect ECG signal analysis. Except for these two noises, other noises may be wideband and usually involve a complex stochastic process, which also distorts the ECG signal. The power line interference is narrow-band noise centered at 50??Hz or 60??Hz with a bandwidth of less than 1??Hz[2]. These noises have been mixed with ECG signal and nullify these noises using the LMS and the RLS algorithms[1]. |
| Fig.1 shows the basic ECG waveform with schematic representation of a single cycle of ECG corresponding to one heart beat[4]. |
| The ECG noises are due to several interferences like electrode contact,motion artifact, baseline drift, instrumentation noise generated by electronic devices, electrosurgical noise, muscle contraction, muscle contraction |
PROBLEM STATEMENT
|
| The Problem Given |
| • most biomedical signals are weak signals |
| • environment is contaminated with many other signals |
| • “other” signals: interferences, artifacts, “noise” |
| • sources of “noise” |
| – from environment |
| – from measurement equipment (instrumentation) |
| – physiological |
| find: |
| • signal processing techniques (filters) to remove the various noises |
Effects of Artifacts on ECG Recordings
|
| Abnormal patterns of ECG may be due to pathological states or on occasion they may be due to artifacts. To diagnose the presence of undesirable artifacts on the ECG trace, a few recordings are illustrated below: |
| Interference from the Power Line: |
| Power line interference is easily recognizable since the interfering voltage in the ECG would have a frequency of 50Hz . This interference may be due to the stray effect of the alternating current on the patient or because of alternating current fields due to loops in the patient cable. Other causes of interference are loose contacts on the patient cable as well as dirty electrodes. When the machine or the patient is not properly grounded, power line interference may even completely obscure the ECG waveform. |
| Baseline Wandering: |
| Wandering baseline but otherwise normal ECG trace is usually due to the movement of the patient or electrodes. The baseline shift can be eliminated by ensuring that the patient lies relaxed and the electrodes are properly attached. Baseline wander is usually observed immediately after application of the electrodes. It is due to a relatively slow establishment of electrochemical equilibrium at the electrode-skin interface. This can be minimized by selecting the proper electrode material, which will reach equilibrium quickly with a good electrode jelly. |
| Muscle Tremor: |
| Irregular trembling of the ECG trace, without wandering of the baseline occurs when the patient is not relaxed or is cold. It is generally found in the case of older patients. Muscle tremor signals are especially bothersome on limb leads when a patient moves or the muscles are stretched. Therefore, for long-term monitoring, the electrodes are applied on the chest and not on the limbs. For normal routine ECG recordings, the patient must be advised to get warm and to relax so that muscle tremor from shivering or tension is eliminated. |
DIGITAL FIR FILTER
|
| There are two categories of digital filter: the recursive filter and the non recursive filter. The desired frequency response specification Hd(??) corresponding sample response hd(n) is determined using the following relation |
| Where |
Window Function for Experiment:
|
| Algorithm |
| Where h(n) impulse response of the ideal filter and ??(n) denotes the window. |
Kaiser Window:
|
| In this window the side lobe level can be controlled by with respect to the main lobe peak by varying a parameter α. Kaiser window parameter β affects by side lobe attenuation α db.The width of main lobe can be varied by adjusting the length of the filter. |
HanningWindow
|
| The coefficient of a Han window is calculated from the following equation. |
| The width of main lobe is approximately 8π/M and peak of first side lobe is at – 32dB . |
Hamming Window:
|
| The causal Hamming window function are calculated by |
| The width of main lobe is approximately 8π /M and the peaks of first lobe is at – 43dB. |
PHYSIOBANK
|
| PhysioBank currently contains over 36,000 recordings of annotated, digitized physiologic signals and time series, organized in over 50 databases (collections of recordings). We can access the datas from PhysioBank ATM . This allows you to view any of the recordings and annotations in PhysioBank within your web browser. Choose a few records from several different databases to get a sense of the variety of data available. The PhysioBank ATM is best suited for a quick overview rather than in-depth study, because it is slower to generate images on the PhysioNet server than to download the raw data for processing by our own computer. |
a. About records:
|
| Each database consists of a set of records (recordings), identified by the record name. In most cases, a record consists of at least three files, which are named using the record name followed by distinct suffixes (extensions) that indicate their contents. For example, the MIT-BIH Arrhythmia Database includes record 100; the three files 100.atr, 100.dat, and 100.hea together comprise record 100. Almost all records include a binary .dat (signal) file, containing digitized samples of one or more signals; these files can be very large. The .hea (header) file is a short text file that describes the signals (including the name or URL of the signal file, storage format, number and type of signals, sampling frequency, calibration data, digitizer characteristics, record duration and starting time). Most records include one or more binary annotation files (in the example, .atr denotes an annotation file). Annotation files contain sets of labels (annotations), each of which describes a feature of one or more signals at a specified time in the record; 100.atr, for example, contains an annotation for each QRS complex (heart beat) in the recording, indicating its location (time of occurrence) and type (normal, ventricular ectopic, etc.), as well as other annotations that indicate changes in the predominant cardiac rhythm and in the signal quality. In other databases, annotations mark other features of the signals. |
ADAPTIVE FILTER
|
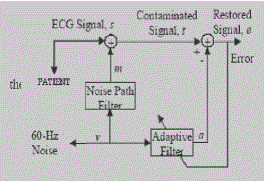
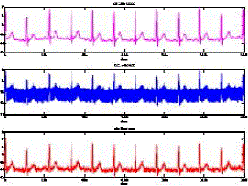
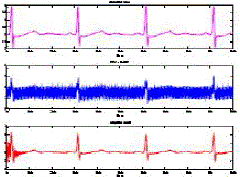
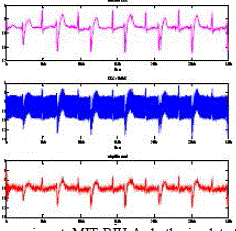
| In first experiment, MIT-BIH Arrhythmia Database data were used as the input: reference annotation (106.atr), data file (106.dat), and header file (106.hea).The result is shown in Fig.6 . In the second experiment, MIT-BIH Arrhythmia Database data were used as the input: reference annotation (220.atr), data file (220.dat), and header file (220.hea). The result is shown in Fig. 7. In the third experiment, MITBIH Arrhythmia Database data were used as the input:reference annotation (202.atr), data file (202.dat), and header file (202.hea).The result is shown in Fig.8 and In the fourth experiment, MITBIH Arrhythmia Database data were used as the input: reference annotation (116.atr), data file (116.dat), and header file (116.hea).The result is shown in Fig. 8. In all result figures, the first signal is the original ECG, the second is ECG+noise, and the third signal is adaptive filter result. |
CONCLUSION
|
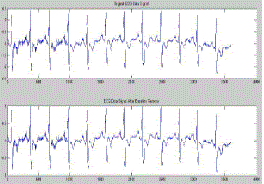
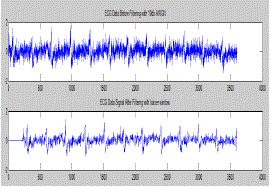
| In this paper we have compare the results of ECG signal filtered by FIR filter with three windows Kaiser, Hamming and Hanning. The average power and signal to noise ratio was carried out to study the effect of noise on ECG signal. Also the adaptive LMS noise cancellation was done Succesfully for 3 different datas from MIT-BIH arrhythmia database. |
Tables at a glance
|
 |
 |
| Table 1 |
Table 2 |
|
| |
Figures at a glance
|
 |
 |
 |
 |
| Figure 1 |
Figure 2 |
Figure 3 |
Figure 4 |
 |
 |
 |
| Figure 6 |
Figure 7 |
Figure 8 |
|
| |
References
|
- Reduction Of Noise From Ecg Signal Using Fir Low Pass Filter With Various Window Techniques- Current Research in Engineering, Scienceand Technology (CREST) Journals-[ ISSN 2320-706X ]- Vol 01 | Issue 05 | July 2013 | 117-122 117.
- Noise Suppression in ECG Signals through Efficient One-Step Wavelet Processing Techniques E. Castillo, D. P. Morales, A. García, F. Martínez-Martí, L. Parrilla, and A. J. Palma.Department of Electronics and Computer Technology, ETSIIT, University of Granada, C/ Daniel Saucedo Aranda,18071 Granada, Spain.Received 16 March 2013; Accepted 13 May 2013. http://www.hindawi.com/journals/jam/2013/763903/
- Filtering for Removing of Artifacts .Josef Goette Bern University of Applied Sciences, BielInstitute of Human Centered Engineering - microLab-Josef.Goette@bfh.ch February 17, 2013 BioMedSigProcAna
- A Real Time Approach: ECG Noise Reduction in Chebyshev Type II Digital Filter-International Journal of Computer Applications (0975 – 8887) Volume 49– No.9, July 2012
- Adaptive Filtering and Compression of BioMedical Signals Using Neural Networks. International Journal of Engineering and AdvancedTechnology (IJEAT)ISSN: 2249 –8958,Volume-2 Issue-3, FEBRUARY 2013. International Journal of Engineering and Advanced Technology(IJEAT)ISSN: 2249 –8958,Volume-2Issue-3, FEBRUARY 2013.
- Accessing the public MIMIC-II intensive care relational database for clinical research
- The Impact of the MIT-BIH Arrhythmia Database
- Interference in the ECG and its elimination
- Denoising on ECG signals based on noise reduction algorithms in EMD and wavelet domains.Md.AshfanoorKabir,CeliaShanaz. Department ofElectrical and Electronic Engineering, Bangladesh University of Engineering and Technology, Dhaka, Bangladesh-Biomedical Signal Processing andControl 7 (2012) 481–489.
- Electrocardiogram (ecg) signal Processing-Leif sornmo,Lund university-sweden,Pablo Laguna-Zaragoza University,Spain.
- A survey of noise removal techniques for ecgsignals.international journal of advanced research in computer and communication engineering -Vol.2,Issue 3,March 2013
- J. A. Van Alste, T. S. Schilder “Removal of Base-Line Wander and Power-Line Interference from the ECG by an Efficient FIR Filter with aReduced Number of Taps” IEEE Transactions On Biomedical Engineering, vol. bme-32, no. 12, December 1985 pg no-1052-1060 Reduced Numberof Taps” IEEE Transactions On Biomedical Engineering, vol. bme-32, no. 12, December 1985 pg no-1052-1060
- Neerajkumar, Imteyaz Ahmad, PankajRai “Signal Processing of ECG Using Matlab” International Journal of Scientific and ResearchPublications, Volume 2, Issue 10, October 2012 pg no.1-6
- E.Ferrara and B.Widrow,"the time-sequenced adaptive filter",IEEE Trans. Circ. Syst., pp. 519-523,June 1981.
- Investigation of Adaptive Filtering for Noise Cancellation in ECG signals. SoroorBehbahani.Biomedical Engineering Department, Science andResearch Branch, Islamic Azad University,Tehran, Iran.Member of Young Researcher Club of Biomedical Engineering Department, Science andResearch Branch, Islamic Azad University, Tehran, Iran.
- The PhysioBank Core Collection- http://www.physionet.org/physiobank/physiobank-intro.shtml
- Processing ecg signal with Kaiser window- based fir Digital filters-Mbachu C.B et al. / International Journal of Engineering Science andTechnology (IJEST)
- http://www.ucl.ac.uk/~ucbpcjh/CHarrison/Arrhythmia_files/CHarrison_CP1-Arrhythmia.pdf
- Katz, A.M.Physiology of the Heart Second Edition, Raven Press New York 1992.
|