Keywords
|
| MUSIC (Multiple Signal Classification); ESPRIT(Estimation of Signal Parameters via Rotational Invariance Techniques); DOA (Direction of Arrival);Smart Antenna. |
INTRODUCTION
|
| Actually antennas are not smart, systems are smart. Generally smart antenna system merges an antenna array with a digital signal-processing capability to transmit and receive in an adaptive and spatially sensitive manner. In other words, such a system can automatically change the radiation patterns to its signal environment. There are two main types of smart antenna include switched beam smart antenna and adaptive array smart antenna. Switched beam systems have some predefined fixed beam patterns. A decision for which beam to access at any given point of time is based on the requirement of the system. Adaptive arrays allow the antenna to rotate the beam to any direction of interest while simultaneously avoiding interfering signals. The smart antenna system is divided into two parts |
| A. Direction of Arrival (DOA) |
| B. Adaptive Beam-forming algorithm |
| A. Direction of Arrival (DOA):The smart antenna system estimates the direction of arrival of the signal, using Classical methods include Sum-and-Delay method and Capon’s Minimum Variance Distortion less Response (MVDR) while Subspace based techniques are multiple signal classification (MUSIC) and The Minimum Norm Technique,estimation of signal parameters via rotational invariance techniques (ESPRIT) algorithms. They involve findings of a spatial spectrum of the antenna/sensor array and calculating the DOA from the peaks of this spectrum. These calculations are computationally intensive. Matrix Pencil is very efficient in case of real time systems and under the correlated sources. |
| B. Adaptive Beam-forming algorithm:It is the method used to create the radiation pattern of the antenna array by adding constructively the phases of the signals in the direction of the targets/mobiles desired and nullifying the pattern of undesired/interfering targets. This can be done with a simple FIR tapped delay line filter. The weights of the FIR filter may also be changed adaptively and used to provide optimal beam forming and actual beam pattern formed. Typical algorithms are the steepest descent and LMS algorithms [7]. Adaptive array antennas are most widely used smart antennas in field of communication. |
RELATED WORK
|
| There has been a lot of research work dedicated towards DOA estimation of smart antenna.There are various methods for estimating DOA [7] of smart antenna. |
| A. Delay and Sum Method |
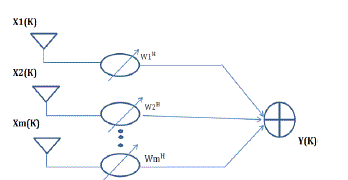
| Delay-and-Sum method [4] is the simplest classical method based on beam forming for estimation of DOA. The total output power of classical beam former can be explained as: |
 eq. (1) eq. (1) |
 |
| Here w=???? ?? .Then output power of classical Beamformer is given by, |
 eq. (3) eq. (3) |
| B. Capon’s Minimum Variance Method |
| The delay-and-sum method [4] works on the premise that pointing the strongest beam in a particular direction yields the best estimate of power arriving in that direction. Capon’s minimum variance technique attempts to overcome the poor resolution problems associated with classical beam forming (delay-and-sum method).Capon’s Method [2] contributes in solving the poor resolution problem by using the idea to utilize some ofthe degrees of freedom to form a beam in the desired look direction and at the same time usingthe remaining degrees of freedom to form nulls in the direction of interfering signal.To measure the power from DOA, θ, the gain of beam former is constrained to be 1 inthat direction and contribution to the output power from the signals approaching from all otherdirections is minimized by using the remaining degrees of freedom. Mathematically this problemis known as a constrained minimization process [4]. |
 |
 eq. (5) eq. (5) |
 eq. (6) eq. (6) |
| C. The Minimum Norm Method |
| Kumaresan and Tufts, proposed a method called the Minimum Norm Method [4], which is applied in a manner similar to MUSIC algorithm over the DOA estimation problem and is defined as “the vector lying in the noise subspace whose first element is one having minimum norm”. The DOAs are specified by the largest peaks of the function as follows: |
 eq. (7) eq. (7) |
| D. MUSIC Algorithm |
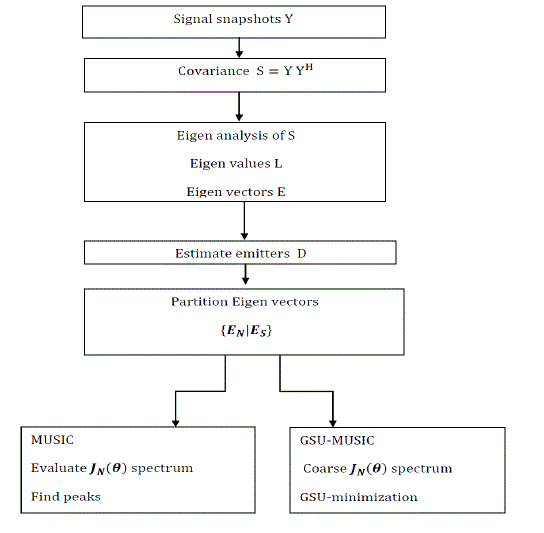
| MUSIC [1] stands for Multiple Signal Classification. It is one of the earliest proposed and a very popular method for super-resolution direction finding, which gives the estimation of number of signals arrived, hence their direction of arrival. MUSIC [1] is a technique based on exploiting the Eigen structure of input covariance matrix. Eigen vectors are easily obtained by either an Eigen decomposition of sample covariance matrix or a Singular Value Decomposition (SVD) of the data matrix. By MUSIC algorithm the powers and cross correlations between the various input signals can be readily obtained and the DOAs of the multiple incident signals can be estimated by locating the peaks of a MUSIC spatial spectrum. We begin with the signal snapshots Y, which is a K?M matrix. Covariance matrix S is computed via (8). The next step is Eigen analysis, getting the eigenvalues L and the corresponding eigenvectors E. In this paper, we describe a partitioning method in Section IV on the set of the normalized eigenvalues, which gives us an estimate of D. We separate the eigenvectors into M - D noise eigenvectors???? and the remaining D signal eigenvectors ????. MUSIC and GSU-MUSIC differ after this step as depicted in Fig. 2. In MUSIC, the spectrum (15) is evaluated for different angles and the peaks are chosen. Numerically, the estimate is limited by the evaluation interval. Let be the number of sensors in a smart antenna array. Let there be snapshots at each sensor. For any k ? {1, K} the k’th snapshot at each sensor is for the same instant in time. Let represent the K?M matrix of snap-shots. This matrix has complex values in general, representing in-phase and quadrature components. The covariance matrix is given by |
 eq. (8) eq. (8) |
| Where denotes Hermitian. The Eigen analysis of yields the eigenvalues and the corresponding Eigen vectors . It has been shown that will contain only positive real values as is positive definite. If there are D < M independent signals, M-D of the eigenvalues will ideally be 0 under no noise condition, but, will be close to 0 depending on the signal-to-noise ratio (SNR). After sorting the eigenvalues in in ascending order, the M? (M-D) matrix , the matrix of the M-D eigenvectors corresponding to the M-D lowest eigenvalues is found. Contain the noise eigenvectors. Can be written as E= {????|????} where are the signal eigenvectors. |
| The array manifold for a direction of arrival is the M?1column vector a(??). It depends on the geometry. For example, for a ULA, it is given by |
 eq. (9) eq. (9) |
 eq. (10) eq. (10) |
| z = ejω And ω is given by |
 eq. (11) eq. (11) |
| Where d is the spacing between the ULA elements and is the wavelength corresponding to the centre frequency of the narrowband signal. The filtered vector which is analogous to the output of the spatial tuned filter as described in [8] is here given by |
 eq.(12) eq.(12) |
| Which is a 1 ? (M – D) row vector then, the energy in the filtered output is |
 eq. (13) eq. (13) |
 eq.(14) eq.(14) |
| For MUSIC, this energy is minimized, i.e., almost close to zero, when the angle corresponds to a DOA. Thus, the objective function for maximization is |
 eq. (15) eq. (15) |
| It is interesting to note that the evaluation of ???? ?? is linear in ??while nonlinear in ω unlike conventional frequency response. The spectrum can be thought of as the inverse of the magnitude squared of the frequency response of the filter given by (12). It is interesting to note that the evaluation of ???? ?? is linear in ??while nonlinear in ω unlike conventional frequency response. The spectrum can be thought of as the inverse of the magnitude squared of the frequency response of the filter given by (12). To know exactly the angles of arrival of the signals, we need to calculate an average over all vectors of an orthonormal basis of the noise space. In other words, we have to calculate the pseudospectre on the extent of the parameters space and seek the minima of this function, which limits its performance in terms of speed and computational resources. |
| E. GSU-MUSIC Algorithm |
| We estimate the number of signals, D, as the number of significant eigenvalues in L, i.e., the clusterof eigenvalues which carries maximum mean energy. The size of the cluster provides an estimate of D. GSU minimization method [3] finds the extreme values of a univariate function accurately. Step I of GSU-MUSIC [11] finds the peaks in two passes. In the first pass, the spectrum is evaluated as in MUSIC for 90° to 90° using coarse intervals. This provides the intervals with left and right points within which accurate peaks are located. The second pass, then estimates very accurate measures of the peak DOAs using GSU minimization [3]. If all the emitters are not found in Step I, Step II finds them by repeating the two passes using fine sweep angles around the peaks found so far. |
FLOWCHART
|
| The GSU-MUSIC algorithm is a two-stage process. The first stage evaluates the objective function at coarse intervals and determines peaks followed by an iterative approach based on GSU minimization to find accurate values of the peaks. If the number of peaks found so far is equal to the number of estimated peaks, the algorithm stops with this first stage. The second stage is an iterative step for fine resolution using finer intervals around the peaks found so far for finding peaks that were missing in previous iterations. |
| Step I. Algorithm for Initial Angles: By evaluating at suitable points, intervals are found within which the peaks, i.e., the DOAs are present. Then, by using God Section Univariate(GSU) minimization technique peaks are located very accurately. |
| Step II. Resolution Technique:If two emitters are too close for the chosen sweep, i.e., samplingangle, the above procedure may give less number of peaks. To resolve these peaks, we repeat the GSU-MUSIC algorithm near each of the two peaks, but, this time using a finesweep angle around on either side of the respective peak and an increased number of snapshots the possible routes. |
SIMULATION RESULTS
|
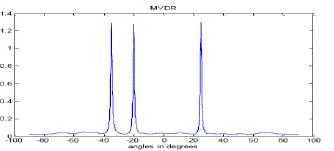
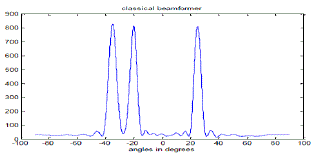
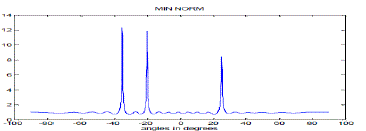
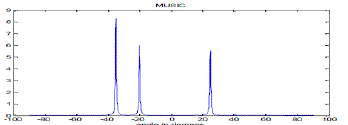
| To analyse the performance of these algorithms, a 20-element uniform linear array with three signals of equal power impinged on the array is simulated in Matlab. For three signals arriving on array at angles -20°, -35°and 25° Sum-and- Delay method, Capon’s Minimum Variance Method (MVDR),Minimum Normalization Method and MUSIC spectrum are plotted for angles between -90° and +90°. Figure 3, 4, 5 and 6 shows the corresponding plots. |
| From figure 3 and 4, it can be observed that both the methods estimate the DOA accurately but the problem with Sum-and-Delay method is that it produce spurious peaks. Additionally the width of the beam and the height of the side lobes in Sum-and-Delay method limit the effectiveness. The resolution of MVDR method is better than Classical Sumand- Delay method. It is clear from the above discussion that the MVDR method offers superior performance and high resolution than Sum-and-Delay method. |
| From the Figures 5 and 6, it is clear that both MUSIC and Min Norm technique estimate the DOAs of impinged signal accurately. Both MUSIC and Min Norm technique are generally considered to be high resolution techniques but from the figures it is clear that Min Norm technique produce spurious peaks at other locations, so it is still inferior to MUSIC and other high resolution techniques. A simulation is performed with 20 sensors uniform linear array tracking two signals (-20°, -35°, and 25°), each with an SNR of 10dB. Figure 4 and 6 shows the comparative performance results using the MUSIC algorithm and the Capon algorithm (MVDR). It can be seen that the DOAs of the three signals are correctly estimated by the two algorithms. The peaks of the MUSIC algorithm are more prominent comparatively to that of MVDR method.The resolution of MUSIC algorithm is high than that of MVDR method that’s why the peaks of MVDR are not as much prominent as that of MUSIC. Though MVDR algorithm is simpler but the problem is that it cannot distinguish between two signals when their DOAs lie very close to each other and also the resolution of MVDR method is very low that’s why it cannot produce very prominent peaks for the estimated DOA as compared to MUSIC algorithm.Under the same array condition, from comparative analysis of figure 4 and 5, it is clear that the DOAs estimated by both the methods are accurate. The peaks for Min Norm Technique is more prominent compared to MVDR algorithm which means that the resolution of Min Norm technique is higher than that of MVDR algorithm. But the Min Norm technique produces spurious peaks at other locations which can limit the performance of this technique, while MVDR algorithm does not produce spurious peaks. From the comparative analysis of figure 3 and 5, it is clear that the resolution of Min Norm technique is higher and Classical Sum-and-Delay method produces much higher spurious peaks. So Min Norm technique shows superior performance over the Sum-and-Delay method but shows comparatively equivalent performance as that of MVDR method. The resolution of Min Norm is high but it produces spurious peaks at other locations while the resolution of MVDR is low but it does not produce spurious peaks. |
CONCLUSION AND FUTURE WORK
|
| The early smart antenna systems were designed for use in military applications to suppress interfering or jamming signals from the enemy. Nowadays, Smart antennas are widely used in the field of communications. Concept of communication systems, which use smart antennas, is based on digital signal processing algorithms. Thus, the smart antennas system becomes capable to locate and track signals by using the both users and interferers and it adapts the antenna radiation pattern to enhance the reception in Signal-Of-Interest direction and minimizing interference in Signal-Of-Not-Interest direction. Comparative study of all methods i.e. Classical Methods (Sum-and-Delay method and Capon’s Minimum Variance method), Subspace based techniques (The Minimum Norm method and MUSIC) is discussed in this paper. The MUSIC algorithm and the MVDR method identify the three signals and have no other spurious components. Of the two, the MUSIC algorithm is able to better represent the locations with more prominent peaks. The Min-Norm algorithm also identifies the signals similar to the MUSIC algorithm, but produces spurious peaks at other locations. The low-resolution classical beam former identifies the three signals, but the locations are not represented by sharp peaks, due to spectral leakage. The classical beam former also produces several spurious peaks. The GSU-MUSIC method is useful for getting accurate results for different kinds of array geometries where MUSIC can be applied. The GSU-MUSIC makes use of gold-section univariate minimization, which is an iterative method. A fixed number of iterations give good results. |
| |
Figures at a glance
|
 |
 |
 |
| Figure 1 |
Figure 2 |
Figure 3 |
 |
 |
 |
| Figure 4 |
Figure 5 |
Figure 6 |
|
| |
References
|
- R. O. Schmidt, “Multiple emitter location and signal parameter estimation,” IEEE Trans, vol. AP-34, no. 3, pp. 276-280, Mar. 1986.
- J. Capon, “High resolution frequency-wave number spectrum analysis,”Proc. IEEE, vol. 57, no. 8, Aug. 1969.
- R. Brent, Algorithms for Minimization without Derivatives. EnglewoodCliffs, NJ, USA: Prentice-Hall, 1973.
- J. Futz, A. Spanias, M.K. Banavar, Narrowband Direction ofArrival Estimation for Antenna Arrays(Morgan & Claypool
- L.C. Godara, Application of antenna arrays to mobilecommunications. part II: beam forming and direction of arrivalconsiderations,
- M.R.Islam, I.A.H. Adam, Performance study of direction of arrival (DOA) estimation algorithms for linear array antenna,
- L.C. Godara, Smart Antennas (CRC press, London, 2004).
- Antenna Theory: Analysis Design, Third Edition, by Constantine A. Balanis ISBN 0-471-66782-X Copyright © 2005 John Wiley & Sons,
- Shahriar Shirvani-Moghaddam, Sakineh Almasi-Monfared. A Comprehensive Performance Study of Narrowband DOA Estimation
- H. Krim and M. Viberg, “Two decades of array signal processing research,” IEEE Signal Processing Magazine, vol. 13, no. 4, pp. 67, July
- K. V. Rangarao and V. Shridhar, “An accurate numerical method for estimating the delay between two omni-directional receiving
|