Keywords
|
| Biometric, Kernel, MFCCs, Phonocardiogram, SVM |
INTRODUCTION
|
| In recent years, it has become very important to identify a user in applications such as personnel security, defence, finance, airport, hospital and many other important areas [8]. So, it has become mandatory to use a reliable and robust authentication and identification system to identify a user. Infact, performance-based biometric systems where by a person is automatically recognized by him performing a pre-defined task using his own biometrics, are preferred over knowledge-based (e.g., password) or possession-based (e.g., key) access control methods. As a result, conventional biometrics systems like fingerprint, iris, face and voice that provide recognition based on an individual behavioural and/or physiological characteristics are becoming more popular [1,7,8,13]. Human heart sounds are natural signals, which have been applied in the doctor’s auscultation for health monitoring and diagnosis for thousands of years. In the past, study of heart sounds focus mainly on the heart rate variability. In the last 4 years, many researchers have investigated the possibility of using heart sounds as physiological traits for biometric recognition [2, 4, 5, 6, 9, 15, 16]. The human PCG-based biometric offers several desirable properties. First, the PCG is not strongly permanent and are difficult to forge and therefore reduces falsification. Moreover, heart sounds are relatively easy to obtain and also inherently provides assurance of subject liveness. |
| Phonocardiography is the sound or vibration of the heart when it pumps blood. In this paper, we use the heart sounds (PCG signals) as a biometric for user identification. Use of phonocardiogram signals has many advantages over other biometrics based on the following properties of heart sounds [12]: |
| 1. Universal: Each living human being has a pumping heart. |
| 2. Measurable: PCG signals can be digitally captured and measured using an electronic stethoscope. |
| 3. Vulnerability: Unlike other biometric technologies, heart sounds cannot be copied or reproduced easily as it is based on intrinsic dynamic signals acquired from the body. Heart sounds cannot be taken without the consent of the person. Moreover, to reproduce the heart sounds, an anatomy of heart as well its surroundings has to be created as heart sounds depends on the anatomy of the body. |
| 4. Uniqueness: Heart sounds depend on the physical state of an individual's health, age, size, weight, height, structure of the heart as well as the genetic factors. The heart sounds of two persons having the same type of heart diseases also vary. |
| 5. Simplicity: Moreover, heart sounds are easy to obtain, by placing a stethoscope on the chest. |
| The main advantages of heart sounds are, so far, the High Universality and the Low Circumvention. The first point is undeniable and objectively true. If our body does not produce the heart sound, it means that we are not alive and so any task of authentication or live verification would be possible. This property is shared with all the biometric traits that depend on organs whose functioning is critical for our life, like the brain. The main drawbacks of heart-sounds biometry are probably the Low Performance and, above all, its overall immaturity as a biometric trait. Of course, heartsounds biometry is a new technique, and as such many of its current drawbacks will probably be addressed and resolved in future research work. |
REVIEW OF RELATED WORKS
|
| In the last years, different research groups have been studying the possibility of using heart sounds for biometric recognition. In this section, we will briefly describe their methods. |
| [12] was one of the first works in the field of heart-sounds biometry. In this paper, the authors obtained good recognition performance using the HTK Speech Recognition toolkit, investigating the performance of the system using different feature extraction algorithms (MFCC, LFBC), different classification schemes (Vector Quantization (VQ) and Gaussian Mixture Models (GMM)) and investigating the impact of the frame size and of the training/test length. After testing many combinations of those parameters, they conclude that, on their database, the most performing system is composed of LFBC features (60 cepstra + log energy + 256ms frames with no overlap), GMM-4 classification, 30s of training/ test length. The authors of [2], one of which worked on [12], take the idea of finding a good and representative feature set for heart sounds even further, exploring 7 sets of features: temporal shape, spectral shape, cepstral coefficients, harmonic features, rhythmic features, cardiac features and the GMM supervector. They then feed all those features to a feature selection method called RFE-SVM and use two feature selection strategies (optimal and suboptimal) to find the best set of features among the ones they considered. The results was expressed in terms of Equal Error Rate (EER), are better for the automatically selected feature sets with respect to the EERs computed over each individual feature set. In [9], the authors describe an experimental system where the signal is first downsampled and is processed using the Discrete Wavelet Transform, using the Daubechies-6 wavelet, and the D4 and D5 sub-bands (34 to 138 Hz) are then selected for further processing. After normalization and framing step, the authors then extract some energy parameters from the signal, and they find that the Shannon energy envelogram is the feature that gives the best performance. The authors of [16] investigate the usage of both the ECG and PCG for biometric recognition but we will focus only on the part of their work that is related to PCG. The heart sounds are processed using the Daubechies-5 wavelet, up to the 5th scale, and retaining only coefficients from the 3rd, 4th and 5th scales. They then use two energy thresholds (low and high), to select which coefficients should be used for further stages. The remaining frames are then processed using the Short-Term Fourier Transform (STFT), the Mel-Frequency filterbank and Linear Discriminant Analysis (LDA) for dimensionality reduction. The decision is made using the Euclidean distance from the feature vector obtained in this way and the template stored in the database. They test the PCG-based system on a database of 21 people and their combined PCG-ECG systems have better performance. The authors of [15] filter the signal using the DWT; then they extract different features: auto-correlation, cross-correlation and cepstra. They then test the identities of people in their database using two classifiers: Mean Square Error (MSE) and k-Nearest Neighbor (kNN). On their database, the kNN classifier performs better than the MSE one. In the march of the PCG recognition’s progress, the proposed methodology for PCG recognition in thi paper is presented in the next section. |
PHYSIOLOGY OF THE HEART SOUND
|
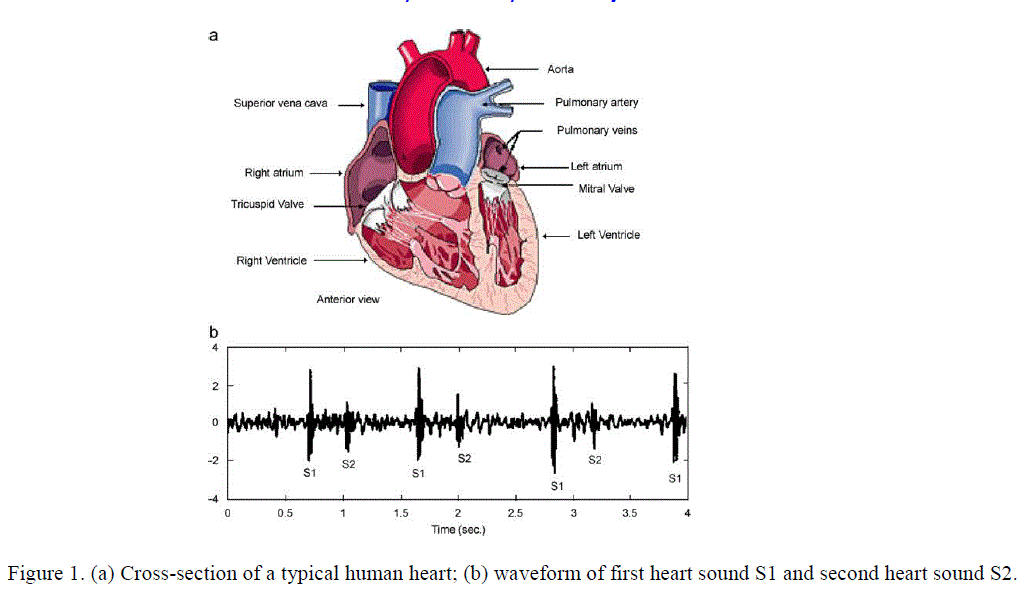
| The human heart is a pump of four-chamber, the two upper chambers called atria are for the collection of blood from the veins and two lower chambers called ventricles are for pumping out the blood to the arteries, as shown in Fig. 1(a). |
| This two sets of valves control the blood flow: the AV-valves (mitral and tricuspid) between the atria and the ventricles, and the semi lunar valves (aortic and pulmonary) between the ventricles and the arteries from the heart .These valves periodically close and open to permit blood flow in only one direction. The mechanical activity of the heart including the blood flow, vibrations of the chamber walls and opening and closing of the valves are the major reasons for generation of the PCGs. Two sounds are normally produced as blood flows through the heart valves during each cardiac cycle (see Fig. 1(b)). The first heart sound S1, is a low, slightly prolonged “lub”, caused by vibrations set up by the sudden closure of the mitral and tricuspid valves as the ventricles contract and pump blood into the aorta and pulmonary artery at the start of the ventricular systole. The second sound S2 is a shorter, high-pitched “dup”, caused when the ventricles stop ejecting, relax and allow the aortic and pulmonary valves to close just after the end of the ventricular systole. They are the “lubb-dupp” sounds that are thought of as the heartbeat. S1 lasts for an average period of 100ms−200ms and its frequency components lie in the range of 25Hz−45Hz. S2 lasts about 0.12s, with a frequency of 50Hz which is typically shorter than S1 in terms of duration and higher in terms of frequency. |
FEATURE EXTRACTION: MFCC
|
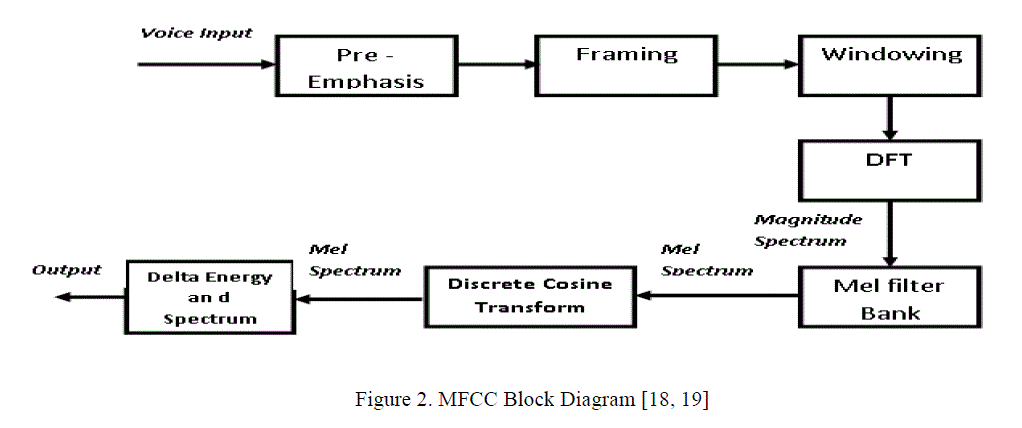
| Feature extraction is a special form of dimension reduction, which transforms the input data into the set features. Heart sound is an acoustic signal and many techniques used nowadays for human recognition tasks borrow speech recognition techniques. The best and popular choice for feature extraction of acoustic signals is the Mel Frequency Cepstral Coefficients (MFCC) which maps the signal onto a Mel-Scale which is non-linear and mimics the human hearing. MFCC system is still superior to Cepstral Coefficients despite linear filter-banks in the lower frequency range. The idea of using Mel Frequency Cepstral Coefficients (MFCC) as the feature set for a PCG biometric system comes from the success of MFCC for speaker identification [17] and because PCG and speech are both acoustic signals. MFCC is based on human hearing perceptions which cannot perceive frequencies over 1Khz. In other words, in MFCC is based on known variation of the human ear’s critical bandwidth with frequency [3, 10].MFCC has two types of filter which are spaced linearly at low frequency below 1000 Hz and logarithmic spacing above 1000Hz. Mel-frequency cepstrum coefficients (MFCC), which are the result of a cosine transform of the real logarithm of the short-term MFCCs are provide more efficient. It includes Mel-frequency wrap-ping and Cepstrum calculation. The overall process of the MFCC [18, 19] is shown in Figure 2. |
| As shown in figure 2, MFCC consists of seven computational steps and each step has its function and mathematical approaches as discussed briefly in the following: |
| Step 1: PRE–EMPHASIS : This step of pre-emphasis process the signal through a filter and compensates the highfrequency part that was suppressed during the sound production mechanism of humans.The speech signal s(n) is sent to a high-pass filter which at higher frequency increases the energy of signal: |
 |
| here, So(n) is the output signal and the value of a usually lies between 0.9 and 1.0.The z-transform of the filter is: |
 |
| Step 2: FRAMING: The heart sound signal is quasi-stationary (slowly varying over time) that is when the signal is examined over a short period of time ,the signal is fairly stationary. Therefore signals are often analyzed in short time segments which practically means that the signal is blocked in frames of typically 20-30 msec. with optional overlap of 1/3~1/2 of the frame size,this is done in order not to lose any information due to the windowing. The signal is divided into frames of N samples and adjacent frames are being separated by M (M<N). |
| Step 3: HAMMING WINDOWING: After the signal has been framed, each frame is multiplied with a window function W(n) .Windowing is done to avoid problems due to truncation of the signal and helps in the smoothing of the signal. Typically the Hamming window is used. If the window is defined as W (n), 0 ≤ n ≤ N-1 then the result of windowing signal is shown below: |
 |
| Where, N = number of samples in each frame; Y (n) = Output signal; X (n) = Input signal. |
| If the signal in a frame is denoted by s (n), n = 0…N-1, then the signal after Hamming windowing is s (n)*w(n), where W(n) is the Hamming window defined by: |
 |
| Step 4: FAST FOURIER TRANSFORM: This mathematical method is used for transforming a function of time into a function of frequency. The Fourier transform convert the convolution of the glottal pulse U[n] and the vocal tract impulse response H[n] in the time domain. The given equation supports the above statement: |
 |
| If X (w), H (w) and Y (w) are the Fourier Transform of X (t), H (t) and Y (t) respectively. |
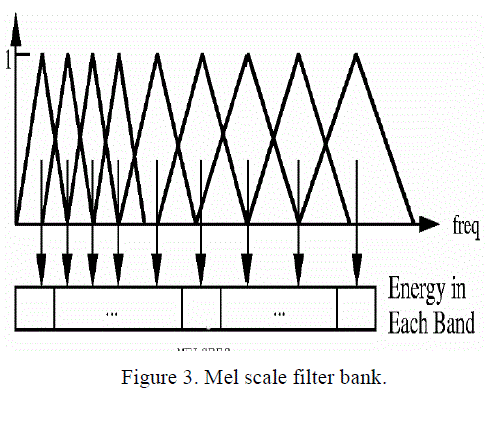
| Step 5: MEL FILTER BANK PROCESSING: In this step, the powers of the spectrum obtained above are mapped onto the mel scale, using windows. A set of triangular filters are used to compute a weighted sum of filter spectral components so that the output of process approximates to a Mel scale. The magnitude frequency response of each filter is triangular in shape and equal to unity at the centre frequency and decrease linearly to zero at centre frequency of two adjacent filters. Then, output of each filter is the sum of its filtered spectral components. After that the following equation is used to compute the Mel for given frequency f in Hz: |
 |
| This figure shows a set of triangular filters that are used to compute a weighted sum of filter spectral components so that the output of process approximates to a Mel scale. |
| Step 6: DISCRETE COSINE TRANSFORM: The mel spectrum coefficients are real numbers (and so are their logarithms), this process convert the log Mel spectrum into time domain using Discrete Cosine Transform (DCT). The MFCC parameters are computed as: |
 |
| where M is the number of filters in the filter bank, J is the number of cepstral coefficients which are computed and Xi is formulated as the “log-energy output of the i- th filter”. |
| Step 7: DELTA ENERGY AND DELTA SPECTRUM: The voice signal and the frames changes, such as the slope of a formant at its transitions. Therefore, there is a need to add features related to the change in cepstral features over time . The energy in a frame for a signal x in a window from time sample t1 to time sample t2, is represented at the equation below: |
 |
CLASSIFICATION: SVM
|
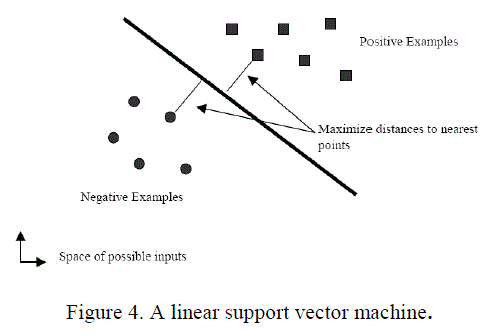
| Support vector machines (SVM) is a new and powerful technique for pattern classification, it is based on statistical learning theory proposed by Vapnik [20] . SVM works equally well for both linearly separable data as well as nonlinearly separable data. With the use of Lagrange Multipliers, the overall problem comes down to finding a function which reduces error and successfully classify the training data. The major advantage of SVM is its ability to classify unknown data points with high accuracy as it works on the concept of maximum margin hyperplane. It improved the classifier performances for small sample learning problems by applying Structural Risk Minimization (SRM), quadratic programming theory and kernel function idea. The SVM has been shown a better generalization performance in many practical applications. |
| Classification methods used in speaker identification process can be divided into two groups: statistical methods that include among the others Gaussian Mixture Models and discriminant methods, which include multilayer perceptrons and polynomial classifiers. Experimental results indicate that SVMs can achieve a performance that is greater than or equal to other classifiers, while requiring significantly less training data to achieve such an outcome [11,14,20] |
| The SVM decision function is defined as follows: |
 |
| Where y is the unclassified tested vector, xi are the support vectors and αi their weights and, b is a constant bias. ,is the kernel function which performs implicit mapping into a high-dimensional feature space. The support vectors are obtained from the training sample through an optimization process, and therefore they are a subset of the training sample. This paper utilizes one-against-one strategy SVM classification method, and a linear SVM classifier which is defined as follows: |
 |
SIMULATION RESULTS AND DISCUSSION
|
| The experimental results of the proposed human identification system are achieved by using 30 speakers selected from the database [21].All of the heart sound signals are noise-free and are sampled at 44100 Hz. Each heart sound in database is approximately of 9 seconds. These heart sounds are analyzed using MATLAB R2008a.The overall performance of the proposed recognition system is summarized in table below: |
| Table 1 show the variation of identification ratio’s with no. of persons, where TPR is true positive rate, TNR is true negative rate, FPR is false positive rate and FNR is false negative rate. The True-positive Rate (TPR) describes the proportion of identification transactions by enrolled users in which the user’s correct identifier is among the returned matches.False-negative Rate (FNR) describes the proportion of identification transactions by enrolled users in which the user’s correct identifier is not among the returned matches. |
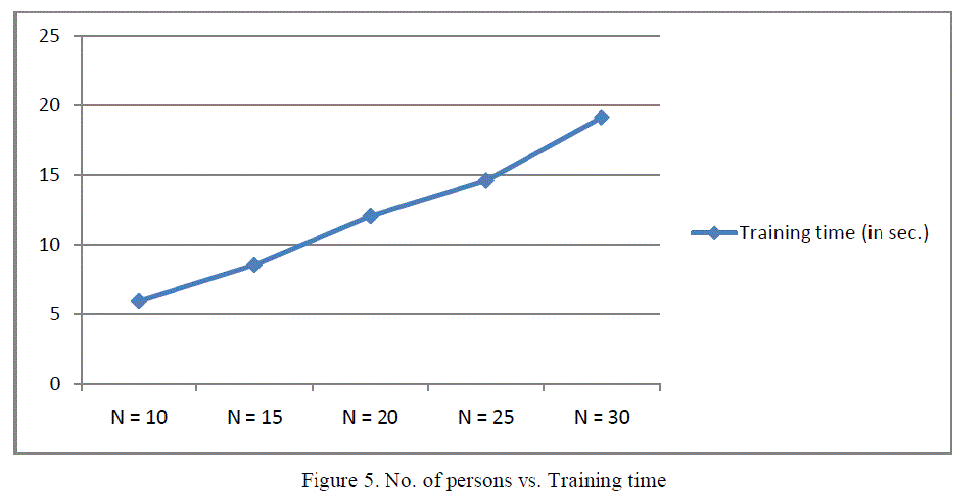
| In the figure 5, it shows the graph of No. of persons vs. Training time. This graph shows the impact of increase in numbers of persons in database to SVM training time.Along with the growth of the number of speakers the time necessary for the process of the classifier computation is lengthening. |
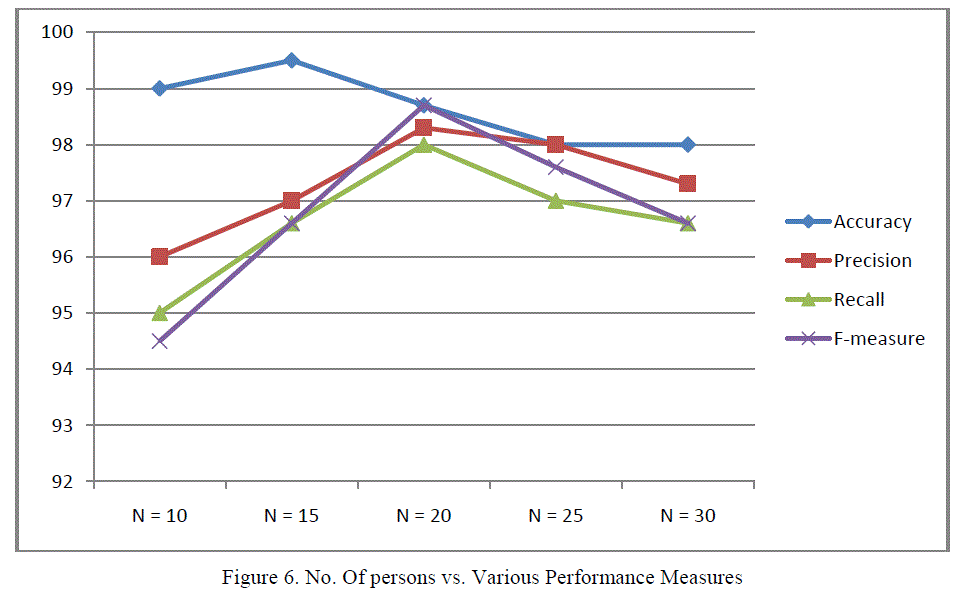
| In the figure 6, it shows the graph of No. of persons vs. Various Performance Measures like accuracy, precision, fmeasure and recall. Accuracy is the proportion of true results (both true positives and true negatives) in the population. On the other hand, precision or positive predictive value is defined as the proportion of the true positives against all the positive results (both true positives and false positives). Recall is defined as the fraction of relevantly retrieved instances. F-measure is the harmonic mean of precision and recall |
CONCLUSION
|
| In this paper, the possibility of using the heart sound signal for human identity verification is investigated, and proposes a study on the use of MFCC and SVM.The performance of the technique has been measured by various parameters. Hence, we can conclude that heart sounds can be used as a biometric, and are reliable as compared to other biometric identification systems as it cannot be easily simulated or copied. Heart sound can be itself used for identification or we can use it with other available identification system to make the overall system easy and reliable to implement. PCG signals are easy to capture and enables real time identification system design. |
Tables at a glance
|
 |
| Table 1 |
|
| |
Figures at a glance
|
 |
 |
 |
| Figure 1 |
Figure 2 |
Figure 3 |
 |
 |
 |
| Figure 4 |
Figure 5 |
Figure 6 |
|
| |
References
|
- A.K.Jain, A.A.Ross, and S. Prabhakar, “An introduction to biometric recognition”,IEEE Transactions on Circuits and Systems for Video Technology, Vol.14(2),pp.4–20, Jan 2004.
- D. H. Tran, Y. R. Leng, and H. Li, “Feature integration for heart sound biometrics”. In Acoustics Speech and Signal Pro-cessing (ICASSP), 2010 IEEE International Conference on, pp.1714 –1717, 2010.
- E.C. Gordon, “Signal and Linear System Analysis, John Wiley &Sons Ltd., New York, USA, 1998.
- F. Beritelli and S. Serrano, “Biometric Identification based on Frequency Analysis of Cardiac Sounds”,IEEE Transactions on Information Forensics and Security, Vol. 2(3),pp.596–604, Sept. 2007.
- F. Beritelli and A. Spadaccini, “Heart sounds quality analysis for automatic cardiac biometry applications”, Proceedings of the 1st IEEE International Workshop on Information Forensics and Security, Dec. 2009.
- F. Beritelli and A. Spadaccini, “Human Identity Verification based on Heart Sounds: Recent Advances and Future Directions”, chapter 11, pp. 217–234, June 2011.
- J. Ortega-Garcia, J. Bigun, D. Reynolds, J. Gonzalez-Rodriguez, “Authentication gets personal with biometrics”,IEEE Signal Process. Mag., Vol. 21 (2), pp.50–62, 2004.
- J.P. Campbell Jr., “Speaker recognition: a tutorial”, Proc.IEEE 85 (9), pp. 1437-1462, 1997.
- J. Jasper and K. Othman, “Feature extraction for human identification based on envelogram signal analysis of cardiac sounds in time-frequency domain”, In Electronics and Information Engineering (ICEIE), 2010 International Conference On, volume 2, pp. V2–228 –V2–233, 2010.
- Jamal Price, sophomore student, “Design an automatic speech recognition system using maltab”, University of Maryland Estern Shore Princess Anne,August 2005.
- Klevan R., Rodman R., “Voice Recognition”, Artec House, London 1997.
- K. Phua, J. Chen, T. H. Dat, L. Shue, “ Heart sound as a biometric ”, Pattern Recognition, The Journal of the pattern recognition society, Pattern Recognition 41,pp. 906 –919, 2008.
- L.O. Gorman, “Comparing passwords, tokens, and biometrics for user authentication”, Proc. IEEE 91 (12), pp. 2019–2040, 2003.
- Müller K. R., Mika S., Rätsch G., Tsuda K., Schölkopf B., “ An Introduction to Kernel-Based Learning Algorithms”, IEEE Transactions on Neural Networks,Vol.12, No.2, March 2001.
- N. El-Bendary, H. Al-Qaheri, H. M. Zawbaa, M. Hamed,A. E. Hassanien, Q. Zhao, and A. Abraham, “Hsas: Heart sound authentication system”,In Nature and Biologically In-spired Computing (NaBIC), 2010 Second World Congress on, pp. 351 –356, 2010.
- S. Fatemian, F. Agrafioti, and D. Hatzinakos, “ Heartid: Cardiac biometric recognition”, In Biometrics: Theory Applica-tions and Systems> (BTAS), 2010 Fourth IEEE International Conference on, pp. 1 –5, 2010.
- T. Ganchev, N. Fakotakis, and G. Kokkinakis. “Comparative evaluation of various MFCC implementations on the speaker verification task”, In Proceedings of the Speech and Computer Patras,Greece, pp. 191–194, 2005.
- ZaidiRazak,NoorJamilah Ibrahim, emranmohdtamil,mohdYamaniIdnaIdris, Mohdyaakob Yusoff,Quranic,“Feature extraction using mel frequencycepstral coefficient(MFCC),Universiti Malaya.
- http://www.cse.unsw.edu.au/~waleed/phd/html/node38.html,downloaded on 3rd March 2010
- Vapnik V. N.., “The nature of statistical learning theory”, Springer, N.Y., 1995.
- http://www.peterjbentley.com/heartchallenge/index.html
|