International Journal of Advanced Research in Electrical, Electronics and Instrumentation Engineering
ISSN ONLINE(2278-8875) PRINT (2320-3765)
ISSN ONLINE(2278-8875) PRINT (2320-3765)
Ashish Siwach1*, Krishan Kumar Sharma2*
|
| Corresponding Authors: Ashish Siwach, E-mail: ashish.siwach@gmail.com Krishan Kumar Sharma, E-mail: krishank_sharma@yhoo.com |
| Related article at Pubmed, Scholar Google |
Visit for more related articles at International Journal of Advanced Research in Electrical, Electronics and Instrumentation Engineering
The proposed paper is a reliability study of repairable system based on the Markov model. The assessment of two unit programmable logic controller (PLC) system is targeted in this study. A sample data from an industry has been processed as the sample. The transient and steady reliabilities of the hot standby system with an expert engineer from vendor side and an internal engineer of the industry are found. To increase the understanding of dynamic reliability of enterprise system this study provide a quantitative method and compare the results with the previous ones
Keywords |
||||||||
| Markov model, hot standby system, reliability, repairable system, PLC. | ||||||||
INTRODUCTION |
||||||||
| In present era of high-tech industrial processes with ever increasing levels of sophistication in engineering systems, reliability plays a major role. Reliability engineering is an engineering field that deals with the reliability of products. Reliability, is the probability of operating a product for a given time under specified conditions without failure. Reliability engineering makes it possible to set specifications on the number of products that still operate under normal use conditions years ahead in the future, thereby predicting its physical lifetime. Measures of system performance are basically of four kinds: 1) reliability; 2) availability and maintainability; 3) mean time to failure (MTTF) and mean time to repair (MTTR); and 4) lifetime. Reliability has been widely used and thoroughly studied as the primary performance measure for non-maintained systems. Typically, the electronics in mobile applications have an economic lifetime of a couple of years. If it is found that the physical lifetime is far beyond what is required, designs may be adjusted in such a way that the performance of the product can be boosted. In this context the physical lifetime of a product is defined as the moment in time at which the reliability of the product has decreased below a given value. Kuo et. al., Misra and Tillman et al. [1], [2], and [3] provide good literature surveys in system-reliability optimization. Tillman et al. [3] classified problems by system structure, problem type, and solution methods they, also described the advantages and disadvantages of various optimization techniques. Various heuristics were developed in 1970's to solve complex system reliability problems where the traditional optimization techniques failed to do so. Kuo and Prasad [1] summarize the developments in optimization techniques, along with recent optimization methods. | ||||||||
| A term related to reliability is degradation; this is used to describe the change in performance of a product or one of the components the product is composed of. If the degradation has reached a given level, the product is said to have reached its lifetime. The degradation rate is the speed at which this process of degradation takes place. Physical lifetime prediction requires a good description of the reliability of the product as a function of time. For this purpose a reliability engineer has several tools, ranging from statistical algorithms to failure analysis tools. Describing the complete set of tools used by reliability engineers lies outside the scope of this dissertation. In this dissertation new developments are described in three important topics of reliability engineering, with a focus on PLC. Many studies [4 - 9] have been taken up for the theoretical aspects of the topic but very rare practical implementation of the concept has been done at the industrial level. Hypothetical industrial cases have been discussed to their full extent in [8 - 9]. In this paper authors discuss the industrial case study of PLCs with practical incidents and data. The ordinary engineer first inspects the failure and tries to repair it, failing to do so the expert engineer is called upon. The model is analyzed by using | ||||||||
| Markov process and regenerative point technique. Markov was a Russian who proposed Markov model in 1907 which explores the interconnections between various states. If the conversion probability from one state to another is only related to the present state and not to any of the previous states, then this process is called Markov process [10]. Various measures of system effective ness such as Mean time to failure (MTTF), mean tie to system failure (MTSF), busy periods of internal and expert repairman are evaluated. In case of any failure the operative unit is first repaired by the internal engineer, if he fails to do so an expert engineer is called upon form outside. Whereas the hot standby is repaired by the internal engineer himself. Section II describes the model and its assumptions and notation taken throughout the paper. Section III discusses about the sojurn time and the transition probabilities of the model described. Section IV throws the light on the availability analysis of the system and the repair man. Section V provides the busy period time of the repair engineer. Section VI describes the profit analysis and graphical interpretations of the model and the data of the system. Section II states the conclusion followed by the references | ||||||||
MODEL DISCRIPTION AND ASSUMPTIONS |
||||||||
| 1. Initially main unit is operative and secondary unit is at hot standby. | ||||||||
| 2. Main unit and secondary unit can transfer data and information in real time operation. | ||||||||
| 3. When main unit fails secondary takes its place. | ||||||||
| 4. Secondary unit in hot standby may fail but its failure rate is lower then the main unit. | ||||||||
| 5. There are two types of failure minor and major, minor is repaired by internal engineer and major failure by expert engineer. | ||||||||
| 6. Priority of operation and repair is given to main unit. | ||||||||
| 7. PLC may fail due to: | ||||||||
| i. power failure | ||||||||
| ii. software corruption | ||||||||
| (virus/malfunction) | ||||||||
| iii. hardware component failure | ||||||||
| iv. unit is burnt | ||||||||
| 8. After each repair whole system works as good as new. | ||||||||
NOMENCLATURE |
||||||||
| O - Operative state | ||||||||
| Hs - Hot standby in operative state | ||||||||
| Ui - Unit under inspection | ||||||||
| Uir - Unit under inspection of internal engineer | ||||||||
| Uhe - Hot standby unit under inspection or internal engineer | ||||||||
| α - Down state rate | ||||||||
| β - Rate at which both units come out of down state | ||||||||
| λ - Constant failure rate of operative unit | ||||||||
| γ - Rate at which failed unit is repaired by expert | ||||||||
| δ - Rate at which hot standby fails | ||||||||
| β1 - rate at which internal engineer repairs hot standbyβ2 - Rate at which unit is repaired by expert engineer | ||||||||
| β2 - Rate at which unit is repaired by expert engineer | ||||||||
| P - Probability of handling failed unit by internal engineer | ||||||||
| Q - Probability of handling failed unit by expert engineer | ||||||||
| Busy | ||||||||
| BR - Busy period of internal engineer when main unit is under repair | ||||||||
| BH - Busy period of internal engineer when hot standby unit is under repair | ||||||||
| BP - Busy period of internal engineer for maintenance | ||||||||
| C0 - Revenue per unit time | ||||||||
| C1 - Cost per unit time for which engineer is busy for inspection | ||||||||
| C2 - Cost per unit time for which the main unit is under repair of internal engineer | ||||||||
| C3 - Cost per unit time for which the main unit is under repair of expert engineer | ||||||||
| C4 - Cost per unit time for which the system is in down state. | ||||||||
| C5 - Cost per unit replacement | ||||||||
| MTTF - Mean Time To Failure | ||||||||
| MTSF - Mean Time to System Failure | ||||||||
| A0 - Steady state availability | ||||||||
| P - Profit | ||||||||
| PLC - Programmable Logic Controller | ||||||||
| Vo - Number of visits of expert engineer | ||||||||
| RP - Replacements | ||||||||
| Φi - Cumulative distribution function for the first passage of time from regenerative state I to the failed state | ||||||||
| K - Cost of internal repair | ||||||||
| R - Reliability | ||||||||
TRANSITION PROBABILITIES AND MEAN SOJOURN TIMES |
||||||||
 |
||||||||
 |
||||||||
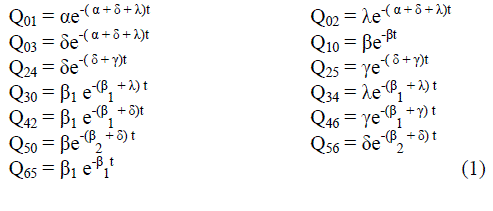
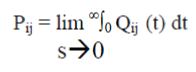
| A transition diagram showing the various states of transition is the system is shown in fig.1. The non-zero elements pij can be calculated by | ||||||||
 |
||||||||
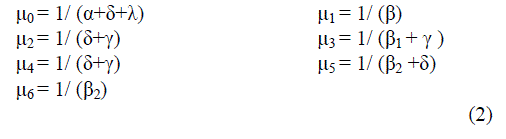
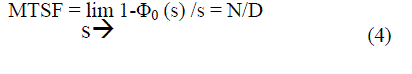
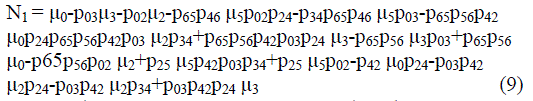
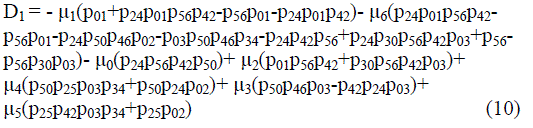
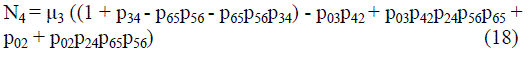
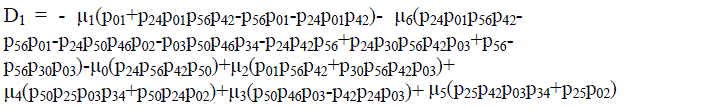
| Mean time to system failure, when the system started from the first stage (stage 0) is represented by: | ||||||||
 |
||||||||
| Where | ||||||||
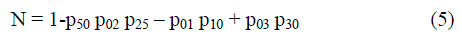 |
||||||||
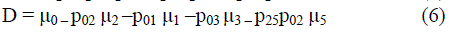 |
||||||||
AVAILABILITY ANALYSIS |
||||||||
| Let us suppose that the system enter the regenerative state‘t’ at t=0 and Ai (t) be the probability of the system at any time‘t’ when the system is in working condition. | ||||||||
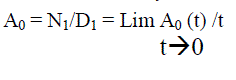 (7) (7) |
||||||||
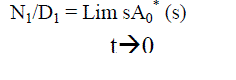 (8) (8) |
||||||||
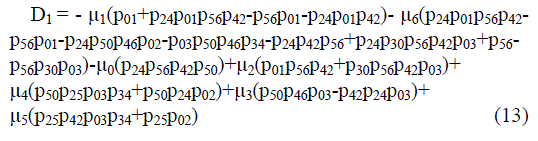
| Where | ||||||||
 |
||||||||
 |
||||||||
BUSY PERIOD ANALYSIS |
||||||||
| A. Internal Engineer for Inspection | ||||||||
| Using probabilistic arguments we obtain recursive relations Bi (t), probability that the engineer is busy, and by applying Lap lace transform for busy period analysis of | ||||||||
| internal engineer whether repair/replacement and solve for | ||||||||
 (11) (11) |
||||||||
 |
||||||||
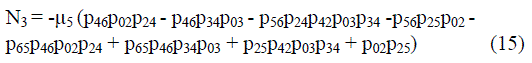
| B. Main unit under repair of internal engineer | ||||||||
| Using probabilistic arguments we obtain recursive relations BRi (t), ), probability that the engineer is busy, and by applying Lap lace transform for busy period analysis of internal engineer whether repair/replacement and solve for BRi * (s): | ||||||||
 |
||||||||
| Where | ||||||||
 |
||||||||
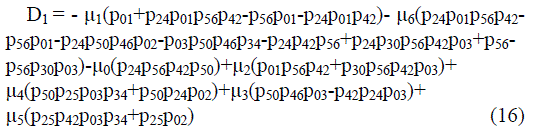 |
||||||||
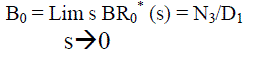
| C. Hot standby unit under repair of internal engineer | ||||||||
| Using probabilistic arguments we obtain recursive relations BHi (t), probability that the engineer is busy, and by applying Lap lace transform for busy period analysis of internal engineer whether repair/replacement and solve for BHi * (s): | ||||||||
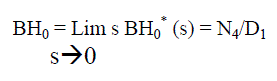 (17) (17) |
||||||||
| Where | ||||||||
 |
||||||||
 |
||||||||
PROFIT ANALYSIS AND GRAPHICAL INTERPRETATION |
||||||||
| In steady state putting these all equations together we get the profit as: | ||||||||
| MTSF = 90793 hr | ||||||||
| Availability (A0) = 0.999702 Expected busy period for inspect (I0) = 2.39803E 04 Expected busy period for repair (B0) = 1.406661 E 02 | ||||||||
| Expected number of visits by the ordinary repairman | ||||||||
| (V0) = 7.082897E 04 | ||||||||
| Expected number of Type-II replacements (RP0) = | ||||||||
| 5.535410E 05 | ||||||||
| Expected number of preventive/corrective maintenances per | ||||||||
| unit time (MT0) = 0.1890301 | ||||||||
| Figure 2. hows the behavior of mean time to system failure with respect to the failure rate for different values of probability. We obtain larger values of meantime to failure on increasing failure rate. Figure 3 shows initially, with the increase in inspection rate, availability decreases more rapidly but there comes a stage beyond which the decrease is availability is very slow with the increase in inspection rate. | ||||||||
| Fis.4 shows the behavior of profit (P) with respect to the preventive/corrective measures (β1) for different values of the revenue per unit uptime. | ||||||||
| It can be concluded from the graph that profit decreases with the increase in the values of 1 and has lower values for higher values of 2. It is also observed from graph that for 2 = 4, the profit is positive or zero or negative according as 1 < or = > or 0.23 and hence 1 should be less than 0.23 inthis case for 2 = 5, the profit is positive or zero or negative according as or = or > 0.225 and hence 1 should be less than 0.225 in this case. | ||||||||
CONCLUSION |
||||||||
| The authors conclude through quantitative analysis and case study that the Markov model is good in evaluating the reliability of hot standby repairable systems. The Markov model is also helpful in analyzing the influence of reliability on the system, according to the states of the system and hence plays a great role in finding the key points to improve the reliability. Hence results in increased quality and quantity of the product with better safety. This paper offers theoretical and empirical approach to the industry that wants to evaluate and improve reliability of their systems. | ||||||||
Tables at a glance |
||||||||
|
||||||||
Figures at a glance |
||||||||
|
||||||||
References |
||||||||
|


