Keywords
|
| CRM, data mining, customer segmentation, Customer (patients) satisfaction. |
INTRODUCTION
|
| In India insurance has a deep rooted history. While “The Oriental Life Insurance Company” was established in Calcutta in the year of 1818 [1], the banking insurance came into the existence in 1990, and subsequently it becomes popular in small time of span. The introduction of modern technologies made drastic changes in banking business [2]. The new generation banks are technology based. The ways in which banks interact with their customers have changed dramatically over the past few years [3][4]. Cashless Bima policy is a unique health insurance policy designed especially for the account holders for both nationalized and private banks. The policy covered the account holder, spouse and two dependent children. This policy covers hospitalization expenses for account holder and family. In case of hospitalization expenses, the entire family is covered for the Floater sum insured as opted for, i.e. either one or all members of the family can utilize the sum insured during the policy period[5][6]. Major exclusions of the policy are: Pre-existing diseases will not be covered. There are a couple of diseases which will not be covered on the half year depending on the company.24hrshospitalization or more is compulsory for a claim to be settled [7]. Actually, today’s customers are very choosy, they want instant information. It becomes the responsibility of the companies (here bank), that how they can keep them up to date, so that information provided by them is adequate and sufficient. Since the needs of the customers are never static but constantly changing, CRM applications need to be flexible and adaptable on the basis of market demand and to customer trends[8][9].The main aim of this paperisto analyse that how data mining technique and CRM strategies can be clubbed together and can be used in banking sector medical insurance.The outline of this paper is as follows: in section two we present related work, in section three we discuss about our methodology. Section four explains customer value, section five deals with CRM and data mining, section six application of data mining technique and section seven gives the conclusion. |
RELATED WORK
|
| This section described the background work of the data mining techniques and customer relationship management (CRM) in the insurance field. Umamaheswari and Janakiraman [10], broadly divided insurance into life, health and non-life insurance. The insurance companies have vital role in insurance provides which meet the requirements of the customers at the same time are affordable. According to Melinda Plescan et al. [11],insurance is the most commonly used mechanism of managing risk. A transaction has always been viewed purely in financial terms. Davenport and Harris [12] and Guszcza [13], said insurance covers pure risks with an element of uncertainty about their occurring. |
| The use of advanced data mining techniques to improve decision making has already taken root in property and casualty insurance as well as in many other industries [14]. Due to the increased stress in day-to-day life, the growth of demand of insurance increased. Data mining helps insurance firms to discovery useful patterns from the customer database. In these days, business needs to satisfy customer’s demand to stay competitive. Consumer or customer is one who determines the direction of the market by buying products or services that satisfy those needs [15].The important resource in contemporary marketing strategies is Customers. Therefore, it is essential to enterprises and organization to successfully acquire new customers and retain high value customers [16]. To achieve these aims different organization use different, business strategies. Customer attrition is an increasingly pressing issue faced by many insurance providers today [17]. Here too data mining technologies are used for retention of the customer. On the other hand CRM strategies have already proved its importance in life insurance sector. Customer relationship Management (CRM) within healthcare organization can be viewed as a strategy to attract new customers and retaining them throughout their entire lifetime of relationship [18]. A new business culture is developing today, where the tools and technologies of data warehousing, data mining, and other customer relationship management (CRM) techniques afford new opportunities for businesses to act on the concepts of relationship marketing. [19]. In these days, business needs to satisfy customer’s demand to stay competitive, Consumer or customer is one who determines the direction of the market by buying products or services here customer segmentation play an important role[20]. Again how customer relationship management can be based on data mining technique is described by Gao Hua [21]. The main purpose of this paper is to analyze that how data mining technique and CRM strategies can be clubbed together and can be used in banking sector medical insurance. |
METHODOLOGY
|
| The purpose of this paper aims to present how data mining techniques can be implemented through customer relationship management (CRM) is useful in banking sector insurance domain. This is a dual approach. Health insurance through bank is a new concept; initially it was not that popular due to lack of advertisement and awareness. Slowly but gradually it becomes popular among the customers. Like insurance companies bank need not to run after the customers, they already have a steady and large customer data base. The goal is selection of customer and proper approach. Data mining process can be modeled virtually any customer; if the necessary information exists in a data base. In order to gather appropriate information for data mining technique, we have used segmentation. Customers are segmented on the basis of their status in the bank. Which include their income, bank transaction, amount deposited, age, sex and social responsibilities (Demographic-segmentation). Here we have used CRM strategies to identify valued customer. Once the customers are selected clustering is used to find pattern among these customers. In case of implementation of CRM most of the organizations give importance to marketing and business strategies only, but our approach is different, we proposed that data mining is also a winning factor of CRM. We have applied data mining techniques on few part of CRM, which give us more appropriate result for the banking sector insurance field. |
CUSTOMER VALUE EVALUATION
|
| A. Customer Value |
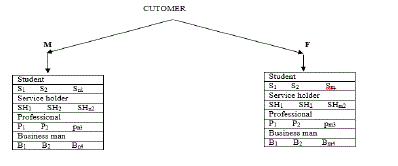
| Since organizations ultimately exist to provide value to their customers [22]. Therefore it is necessary to develop a database for all customers (even unprofitable ones). This is true for both public and private company. In case of bank we already have a large customer database. In order to collect necessary information for data mining purpose we have develop customer-type on the basis of certain parameters (Fig. 1). |
| B. Value Defined |
| Once the customer-type had developed, we defined customer value. Value is defined simply as 'benefits minus costs'. A high value customer is a client who is vital to the survival of the business. Such people usually have a high net worth that require professional wealth management. They also require personalized high standard services from the organization to be retained, where as low value customer plays a less important role in any organizations. Which represent by (Fig. 2 and Fig. 3)[22]. |
| C.MostValued Customer |
| In customer relationship management (CRM) customer valuation is a scoring process used to help a company determine which customers the company should target in order to maximize profit. In case of bank this can be done with the help of demographic segmentation. |
DATA MINING AND CRM
|
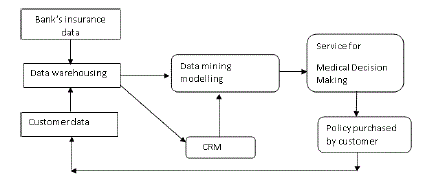
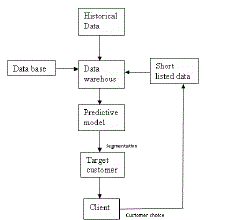
| There are number of definitions available about Data Mining and Customer Relationship Management. Here we will emphasize on the definition, which correlate with each other in context to our topic. Where data mining by its simplest definition automates the detection of relevant patterns in a database. Customer Relationship Management is a process between a company and its customers. The primary users of CRM software are data base makers who are looking to automate the process of interacting with customers [23].In case of banking sector data base about customers is already available, the success lies on the basis of selection and approach to the proper customer. Data mining application automates the process of searching the huge data to find patterns that are good predictor about the customers, where asCustomer Relation Management helps to continue this relation further to achieve the goal. In the following fig. 4 a data warehouse is made with the help of customer’s personal history (M/F), social status , economical status etc) and customer’s data which include customer’s account details. Where CRM is used for refers to the methodologies and tools that help bank managers to manage customer relationships in an organized way, data mining is used to process variety of data analysis and modelling techniques to discover patterns and relationships in data that may be used to make accurate predictions[24]. |
| B.processed Customer Data |
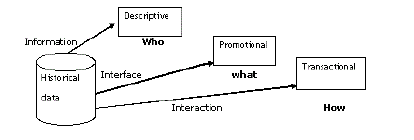
| Customer data can be collected from a variety of different sources. Since we are dealing with demographicsegmentation, it is better to breaking up the data into Descriptive, Promotional, and Transactional sources so that this grouping can reflect where the data come from to some degree (Fig5). Descriptive Data is data about the customer; it is usually some form of summary data. Promotional data includes information about what was done to each customer the richness of this type of data depends on sophistication of CRM system. Transitional data broadly define all data that corresponds to an interaction with the consumer. Include, phone call email service desk to description of the product that consumer purchased [23][26]. |
| C.Customer Selection |
| Once the type of customer is defined (Fig1, Fig3andFig5) the selection of customer can be proceed using data mining technique and CRM (Fig4). Although there are several primary data mining techniques include classification, regression, clustering, summarization and dependency modelling, among others [25]. In this paper, we will discuss about the applicability of clustering, using demographic- segmentations (Fig.5). Demographic Segmentation is the process of dividing the customer base into distinct and internally homogeneous groups in order to develop differentiated marketing Strategies according to their characteristics. |
| There are different types of segmentation based on the specific criteria or attributes used for this purpose [26].There are several reasons to use segmentation in bank. We can use it to create a basic frame work to define and communicate the fact that there is difference between the customers that could be captured at a very high level. Data mining is used for segmentation for variety of ways, it can be used to define customer segmentation based on their predicted behavior, in Fig5 leaf node of the decision tree can be viewed as indusial segments. Here each segment will consist of all the customers that could be classified in the same category. |
| D. Pre-processing Steps |
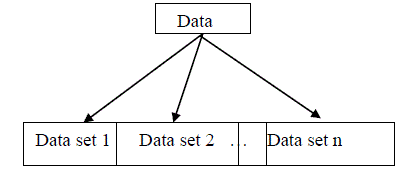
| One of the most critical steps in data mining process is the preparation and transformation of the initial data set [23]. In order to perform this task properly it is needed to choose the object representation. The input to a knowledge discovery process is data base that is a set of object. The most common choice is the attribute representative of objects. Attributes are selected on the basis of actual object. An object is thus representing by a list of attributeand their values. Since in case of bank the number of customer is quite large we have segmented the customer on the basis of attribute which change the data base in to the number of dataset (Fig7 & Fig8)[23][26]. |
| For example if we consider one of attribute as customer salary it can expand as follows: |
DATAMINING MODELBUILDING
|
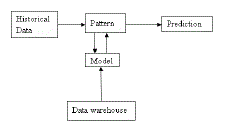
| In data mining, more is better but with some conditions, the most important condition is that the size of the model set and it’s density. Density refers to the prevalence of the outcome of interest or the proportion of records with the given property (often quite low). If we look at the way many of the data mining products are deployed we may see a very similar cycle, data from data ware house is mined for important information about the customers [23](Fig9 & Fig10).It is believed that information is product, the question is how much information is needed , if we see the Fig9 and Fig10 the goal is to find pattern followed by prediction about the customer on the basis of availability of data .Clustering it allows segments to be formed that are based on data that are less dependent on subjectivity. The segmentation of customers is a standard application of cluster analysis, but it can also be used in different, sometimes rather exotic, contexts. Clustering can be performed on the basis of two customers with maximum similarity with the help of similar attribute (Table -1)[26]. |
| A. Distance Measure of Object when Attributes are Binary |
| When items cannot be represented by meaningful p-dimensional measurements, pairs of items are often compared on the basis of the presence and absence of certain characteristic. The presence or absence of a certain characteristics can be describe mathematically by introducing a variable [24] 1for presence of characteristic and 0 for absence of characteristic. Table- 2 explains the fact. |
| |
| |
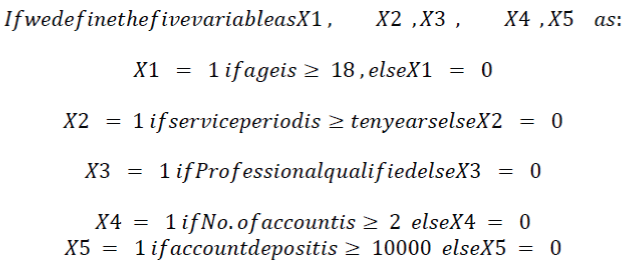 |
| The score for individual A and B on the five binary variables are as shown in Table 2 |
| Now in order to measure similarity or dissimilarity we can use table1, table2 and table3 and find 1-1 match or 0-0 match. It is found that 1-1 match is a stronger indication of similarity than 0-0 match. For example two customer having age more than 65 is a stronger evidence of similarity than the absence of this ability. |
| B. Customer Clustering |
| Cluster analysis is a tool for exploring the structure of data. The core of cluster analysis is clustering. The process of grouping object in to cluster such that the object from the same cluster is similar and object from different cluster are dissimilar. Object can be described in terms of measurement (attribute, feature) or by relationship with other object (pair wise distance, similarity).When we project data in to feature space, the distance in feature space becomes the similarity. One of the methods to measure similarity between two objects is to transform one object in to other and measure how much offer it takes. |
 |
 |
 |
| Here in Table-3 we can see that the distance between A and B is more than the distance between B and C i.e A and B are more dissimilar than B and C or B and C are more similar than A and B. |
CLUSTERING PROCESS
|
| A. Clustering |
| Clustering is a data mining technique of grouping set of data objects into multiple groups or clusters so that objects within the cluster have high similarity, but are very dissimilar to objects in the other clusters. Dissimilarities and similarities are assessed based on the attribute values describing the objects. Clustering algorithms are used to organize data, categorize data, for data compression and model construction, for detection of outliers etc. Common approach for all clustering techniques is to find clusters centre that will represent each cluster. Cluster centre will represent with input vector can tell which cluster this vector belong to by measuring a similarity metric between input vector and all cluster centre and determining which cluster is nearest or most similar one [27]. Cluster analysis can be used as a standalone data mining tool to gain insight into the data distribution, or as a preprocessing step for other data mining algorithms operating on the detected clusters. Many clustering algorithms have been developed and are categorized from several aspects such as partitioning methods, hierarchical methods, density-based methods, and grid-based methods. Further data set can be numeric or categorical [28]. Various clustering techniques are as follows: |
| K-Means Clustering: It is a partition method technique which finds mutual exclusive clusters of spherical shape. It generates a specific number of disjoint, flat(non-hierarchical) clusters. Statistical method can be used to cluster to assign rank values to the cluster categorical data. Here categorical data have been converted into numeric by assigning rank value [29]. |
| Hierarchical Clustering: A hierarchical method creates a hierarchical decomposition of the given set of data objects. Here tree of clusters called as dendrograms is built. Every cluster node contains child clusters, sibling clusters partition the points covered by their common parent. In hierarchical clustering we assign each item to a cluster such that if we have N items then we have N clusters. we find closest pair of clusters and merge them into single cluster. Compute distance between new cluster and each of old clusters. We have to repeat these steps until all items are clustered into K no. of clusters [29].Since clustering is the grouping of similar instances/objects, some sort of measure that can determine whether two objects are similar or dissimilar is required. There are two main type of measures used to estimate this relation: distance measures and similarity measures. |
| The most popular distance measure is Euclidean distance, which is defined as: |
 |
| Where i = (xi1 , xi2, xi3, … … … xip ) and j = (xj1 , xj2 , xj3, … xj1p ) are two p- dimensional data objects. Another well-known metric is Manhattan (or city block) distance, defined as: |
 |
| Both the Euclidean distance and Manhattan distance satisfy the mathematic requirements of a distance function [30]. |
CONCLUSITION
|
| Customer satisfaction relies on good products and services that the company provides. It is true for almost all the sectors. To customize the products and services, a company needs to gain more understanding of customer. Since banking sector medical insurance is totally a new proposal, the bank managers, thus, have finding difficulty to correlate in between the customer data and approachable customer. Keeping this in our mind, in this paper first of all we have segmented this huge data base using clustering technique and then develop data mining model to recognize them and at last using clustering we try to find a pattern in order to recognize this customer. |
Tables at a glance
|
|
|
| |
Figures at a glance
|
 |
 |
 |
 |
 |
| Figure 1 |
Figure 2 |
Figure 3 |
Figure 4 |
Figure 5 |
 |
 |
 |
 |
 |
| Figure 6 |
Figure 7 |
Figure 8 |
Figure 9 |
Figure 10 |
|
| |
References
|
- History of Insurance, IRDA/GEN/06/2007.
- Chitra. K and Subashini.B, “Data Mining Techniques and its Applications in Banking Sector”, International Journal of Emerging Technology and Advanced Engineering,Vol3, Issue 8,pp.2013.
- Jayasree.V and Vijayalakshmi.R and Balan.S, “A review on data mining in banking sector”, American Journal of Applied Sciences, pp.1160- 1165, 2013.
- Bhambri.V,“Implementation of data mining in banking sector- a feasibility study”, IJRIM Vol2, Issue 9,2012.
- www.the oriental insurance.com
- http://www.bankofindia.co.in/english/swasthya.aspx.
- http://www.citehr.com/62496-what-mediclaim-policy-who-come-under.html
- Gupta.G and Aggarwal. H, “Improving Customer Relationship Management Using Data Mining”, International Journal of Machine Learning and Computing,Vol.2, pp.874-877,2012.
- Swift.R.S,“Accelerating Customer Relationships, Using CRM and Relationship Technologies”, Prentice Hall PTR,2001.
- Umamaheswari.K and Janakiraman.S, “Role of Data mining in Insurance Industry”, An international journal of advanced computer technology, Vol 3, Issue-6, pp.2014.
- Plescan.M and Bolyai.B, “University of Cluj-Napoca’, Managing knowledge in insurance companies”.
- Davenport. T. H and Harris, J. G. “Competing on Analytics: The New Science of Winning”, Harvard BusinessSchool Press, 2006.
- Guszcza.J, “Analyzing Analytics”, Contingencies, American Academy of Actuaries, July-August, 2008.
- Prasad. U. D and Madhavi. S, “prediction of churn behavior of bank customers using data mining tools”, Business Intelligence Journal, Vol.5, pp.96-101, 2012.
- Marisa S. Viveros, John P. Nearhos, and Michael J. Rothman,” Applying Data Mining Techniques to a Health Insurance Information System”, pp 286-294,
- Farajian.M.A and Mohammadi.S, “Mining the banking customer behavior using clustering and association rules methods”. IntternattiionallJournall off IndusttriiallEngiineeriing&Producttiion Research, December, Vol21, pp. 239-245,2010
- OshiniGoonetilleke.T. L and Caldera.H.A,“Mining life insurance data for customer attrition analysis”. Journal of Industrial and Intelligent Information Vol1,pp.55-58, 2013.
- Anshari.M,Nabil.M.AandChengLow.P.K,“CRM 2.0 within E-Health Systems”,The Journal of Development Informatics,Vol1, pp. 2012.
- Rygielski .C, Wang.J.CandDavid.C.Y, “Data mining techniques for customer relationship management”, Technology in Society 24, pp. 483– 502, 2002.
- Niyagas.W, Srivihok.A and Kitisin .S, “Clustering e-Banking Customer using Data Mining and Marketing Segmentation”, Ecti transactions on computer and information technology, vol.2, pp. 63-69, 2006.
- Hua.G, “customer relationship management based on data mining technique Naive Bayesian classifier”, School of Economic and Management, Wuhan University, Wuhan, 430072, Hubei. China, pp.978-982, 2011.
- http://www.rafcammarano.com/content/customer-value-project-evaluation.aspx
- Alex Berson, Stephen Smith,and Kurt Thearling. “Building Data Mining Applications for CRM”.
- Biswas.P and Bishnu.P.S, “Modeling health insurance selection in Indian market using Data Mining approach”, IUJ Journal of management, pp. 72 –77 ,vol 2, 2014.
- Fayyad.U, Piatetsky-Shapiro.G, and Smyth.I “From data mining to knowledge discovery:an overview”. In Advances in Knowledge Discovery and Data Mining, Chapter 1. AAAIPress, 1996.
- Tsiptsis.K and Chorianopou.A, “Data Mining Techniques in CRM: Inside Customer Segmentation”. A John Wiley and Sons, Ltd., Publication, 2009.
- Verma.M , Srivastava. M, Chack.NDiswar. A.K and Gupta.N, “A Comparative Study of Various Clustering Algorithms in Data Mining,” International Journal of Engineering Research and Applications (IJERA), Vol. 2, Issue 3, pp.1379-1384, 2012.
- Joshi.A and Kaur.R “A Review: Comparative Study of Various Clustering Techniques in Data Mining”, International Journal of Advanced Research in Computer Science and Software Engineering, Volume3, Issue3,pp.55-57 2013.
- Sovan.P.K, Sahoo.S, and Swain.D.K, “Clustering of Categorical Data by Assigning Rank through Statistical Approach,” International Journal of Computer Applications, pp.1-3, 2012.
- Han,J,Kamber.M, “Data Mining: Concepts and Techniques”, 2nd edition,, Morgan Kaufmann,2006.
|