ISSN ONLINE(2320-9801) PRINT (2320-9798)
ISSN ONLINE(2320-9801) PRINT (2320-9798)
Silk Smita1, Sharmila Biswas2, Sandeep Singh Solanki3
|
| Related article at Pubmed, Scholar Google |
Visit for more related articles at International Journal of Innovative Research in Computer and Communication Engineering
Music signals are not solely characterized because of other mixed audio signals. Mixed audio signals contain music signals mixed with speech signals, voice and even background noise.Thus, mixed signals need to classify separately. Researchers have developed many algorithms to solve this problem keeping in mind with their characteristic features of music signals: by timbre, harmony, pitch, loudness etc. The algorithm ICA (Independent component analysis) uses basis of Blind source separation, HSS(Harmonic structure stability), "SOSM" APPROACH (Second Order Statistical Measures Approach), Sinusoidal Parameters based audio classification using FDMSM etc. are some of the mixed signal classification algorithms. This paper highlights all these existing methods and their experimental results.
Keywords |
| Harmonic structure stability;ICA; HSS; FDMSM; SOSM; audio separation; voice; music |
INTRODUCTION |
| In this digital world, efficient management of the digital content of audio data has become an important area for the researcher. However, due to time-consuming and expensive indexing and labeling that are performed manually, an automatic content-based classification system of mixed type audio signal is a must for various applications of signals used these days. Separation of voice (speech), music and noise in a mixed audio signal is an important problem in music research. Here, voice means the singing voice in a song, music means the instrument. Separation of mixed signal is helpful for many other music researches, such as Music Retrieval, Classification and Segmentation, Multi-pitch estimation, etc. Along with audio signal separation, audio classification is important due to following reasons: |
| (a) Different audio types should be processed differently. |
| (b) The searching space after classification is reduced into a particular subclass during the retrieval process. |
| This approach reduces the computational complexity and one can choose specified field of research for that particular signal. For example, speech signals can be used for speech recognition, music signals for music analysis and voice for speaker recognition. |
II. RELATED WORK |
| In this review, music signals are of prime interest. Music signals are characterized according to their pitch, loudness, duration, harmonic structure and timbre. Timbre is mainly used for the recognition of sound sources. Music signals are more “ordered” than voice. The entropy of music is much constant in time than that of speech [1]. |
| Among various methods [1-16] for signal separation, harmonic structure model [4,5] has extended multi-pitch estimation algorithm used to extract harmonic structures, and clustering algorithm is used to calculate harmonic structure models. Then, signals are separated by using these models to distinguish harmonic structures of different signals. |
| ICA (Independent Component Analysis) is one of the methods for extracting individual signals from mixtures. Its power resides in the physical assumptions that the different physical processes generate unrelated signals. The simple and generic nature of this assumption allows ICA to be successfully applied in the diverse range of research fields [5]. Vanroose used ICA to remove music background from speech by subtracting ICA components with the lowest entropy [6]. General signal separation methods do not sufficiently utilize the special character of music signals. Gil-Jin and Te |
| Won proposed a probabilistic approach to single channel blind signal separation [7], which is based on exploiting the inherent time structure of sound sources by learning a priori sets of basis filters. In Harmonic Structure Stability approach [4], training sets are not required, and all information is directly learned from the mixed audio signal. Feng et al. applied FastICA to extract singing and accompaniment from a mixture [11]. |
| Based on different features and characteristics, audio classification is used to classify most audio into speech, music and noise [2-3]. Many features are used including Cepstrum [4], [5], power spectrum or ZCR proposed in [6] using Support Vector Machine (SVM) classifier. Sinusoidal parameter based audio classification method [5] introduce a new unsupervised Feature selection method; in order to determine which features are optimum is sense of high accuracy in classification. Using only these obtained features it is demonstrated that acceptable classification accuracy is achievable. In addition, the SVM and Relevance Vector Machine (RVM) are employed since they were already proven to be the best classifiers for musical genre recognition in many literatures. This classification system categorizes audio based on new audio features, sinusoidal parameters denoting harmonicity as well as Subband energy. These sinusoidal parameters jointly represent harmonicity ratio (HR) and energies of different frequency subbands. |
| Another method used for classification is Statistical Discrimination and Identification of Some Acoustic Sounds [6].This method finds a pre-processing technique which allows discriminating between the different sounds. This technique is based on the similarity measure μGc introduced by Bimbot and used for speaker recognition tasks. |
III. METHODOLOGY |
A. INDEPENDENT COMPONENT ANALYSIS[9] |
| Blind Signal Separation (BSS) or Independent Component Analysis (ICA) is the identification & separation of mixtures of sources with little prior information. Non-gaussianity is used to estimate the ICA model. ICA involves two basic steps |
| (a) “Nonlinear decorrelation"- In this step, matrix W is calculated so that for any i ≠ j , the components yiand yjare uncorrelated, and the transformed components g(yi) and h(yj) are uncorrelated, where g and h are some suitable nonlinear functions.” |
| (b) “Maximum non-gaussianity”- The local maxima of non-gaussianity of a linear combination y=Wxunder the constraint that the variance of x is constant. Each local maximum gives one independent component. |
B. HARMONIC STRUCTURE STABILITY ANALYSIS[4,5] |
| This algorithm finds the average harmonic structure of the music, and then separate signals by using it to distinguish voice and music harmonic structures. Steps involved in this algorithm are preprocessing, harmonic structure extraction, music Average Harmonic Structure analysis, separation of signals. |
| S(t) is a monophonic music signal. |
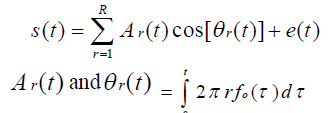 |
| are the instantaneous amplitude and phase of the rthharmonic, respectively, R is the maximal harmonic number, f0(τ) is the fundamentalfrequency, e(t) is the non-harmonic or noise component. |
| Divide s(t) into overlapped frames and calculate f0 l and Ar lby detecting peaks in the magnitude spectrum. Ar l=0, if there doesn’t exist the rth harmonic. l = 1, . . . , L is the frame index. f0 l and [A1 l, . . . ,AR l] describe the position and amplitudes of harmonics. Normalize Ar l by multiplying a factor ρl= C/A1 l( C is an arbitrary constant) to eliminate the influence of the amplitude. Translate the amplitudes into a log scale, because the human ear has a roughly logarithmic sensitivity to signal intensity. Harmonic Structure Coefficient is then defined as an equation. The timbre of a sound is mostly controlled by the number of harmonics and the ratio of their amplitudes, so Bl = [Bl 1, . . . ,Bl R], which is free from the fundamental frequency and amplitude, exactly represents the timbre of a sound. In this paper, these coefficients are used to represent the harmonic structure of a sound. Average Harmonic Structure and Harmonic |
| Structure Stability are defined as follows to model music signals and measure the stability of harmonic structures. |
| Harmonic Structure Bl, Bl i is Harmonic Structure Coefficient: |
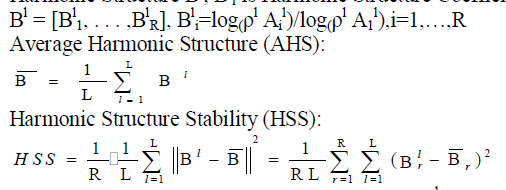 |
| AHS and HSS are the mean and variance of Bl. Since timbres of most instruments are stable, Bl varies little in different frames in a music signal and AHS is a good model to represent music signals. On the contrary Bl, Bl varies much in a voice signal and the corresponding HSS is much bigger than that of the music signal. |
C. Second Order Statistical Measures Approach[7] |
| This method [5], based on mono-Gaussian model [3], uses some measures of similarity, which are called Second Order Statistical Measures (SOSM). These measures are used in order to recognize the speaker at each segment of the speech signal. |
| Two measures (μGC0.5and μG0.5) are used inthis experiment. In the case of sounds classification, measuring the similarity rate by the μGc0.5 permits to have an idea on the type of considered sound. |
| If μGc 0.5 [Threshold_minj, Threshold _maxj] then we identify the considered sound as type « j ».where, |
| Threshold_minj= min(μGc0.5( speech ,soundf)) |
| Threshold_maxj= max(μGc0.5( speech ,soundj)) |
| Where, the word « sound » represents a set of sounds with the same type. And « speech » represents a set of reference speakers. J denotes a certain sound belonging to a certain class “j”. |
D. Sinusoidal Parameters based audio classification [8] |
| Speech signal contains both periodic and non-periodic information due to the impulsive nature of events or”noiselike” processes occurring in unvoiced regions. As a result, we can write for a time window segment of the underlying observed audio signal as follows: |
 |
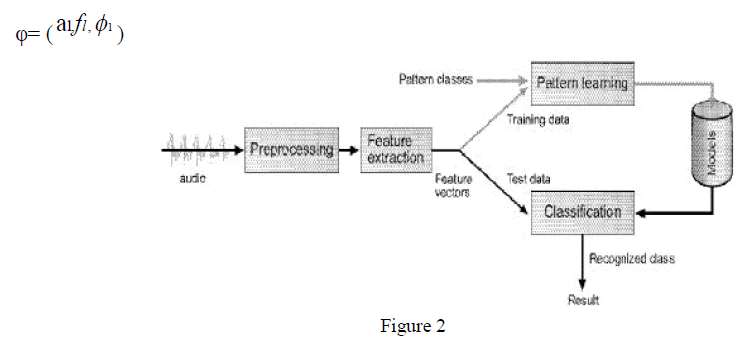
| where n = 1,…,Ns is the sample index, θ= ( al,fl , l ) denote the sinusoidal parameters including the amplitude, frequency, and phase of the l-th sinusoidal component, respectively, L is the number of sinusoidal components in the signal, and (n) is the observation noise modeled as a zero-mean, additive Gaussian noise sequence. In general, it is of interest to estimate the corresponding sinusoidal parameters including frequencies fl, amplitudes al, phases∅l and the number of sinusoids, L. Figure 1[8] shows the basic block diagram of the process which is FDMSM model. Whereas, Figure 2 shows the block diagram of the proposed audio classification system [8]. |
 |
| For extracting the sinusoidal parameters including amplitudes and their related frequencies in some Mel-bands, modified version of-the-state-of-the-art sinusoidal model also called Fixed Dimension Modified Sinusoidal Model (FDMSM) is employed [16]. |
| At the end of the sinusoidal analysis using the FD-MSM approach we reach at triple features for each time window frame as: |
 |
| Further on Feature selection is done to find the smallest subset of the original features using an unsupervised method as pre-process. |
IV. DISCUSSIONS ON RESULTS OBTAINED |
A. INDEPENDENT COMPONENT ANALYSIS [9] |
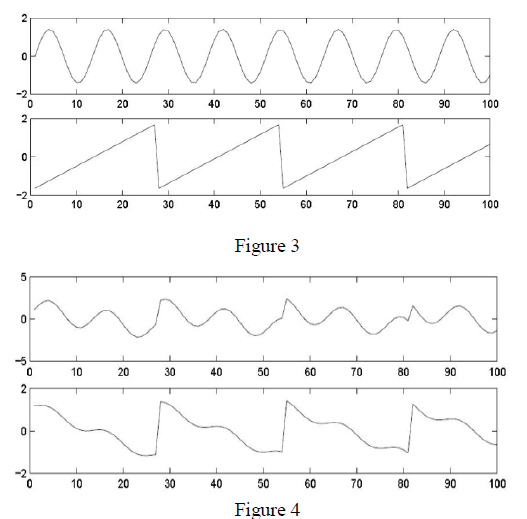
| ICAexperimental results are shown in Figure 3[9].The observed mixture of signals is shown in Figure 4[9].The original speech signals are presented in Figure 3 and the mixed signals is shown in Figure4. The ICA algorithm is used to recover the data in Figure3 using only the data in Figure4. |
 |
B. HARMONIC STRUCTURE STABILITY ANALYSIS [4,5] |
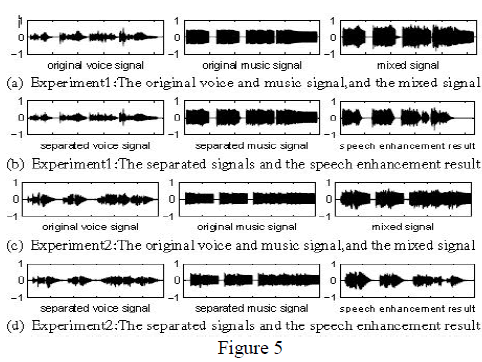
| In Figure 5[4,5], it can be seenthat the mixtures are well separated. The distance between music harmonic structures and the corresponding music AHS is small (the mean distances is 0.01 and 0.006 in experiment 1 and 2, respectively), and the distance between voice harmonic structures and the music AHS is bigger (the mean distances is 0.1 and 0.13 in experiment 1 and 2, respectively). So, the music AHS is a good model for music signal representation and for voice and music separation. |
| Fig. 5 also shows speech enhancement results obtained by speech enhancement software which tries to estimate the spectrum of noise in the pause of speech and enhance the speech by spectral subtraction. |
 |
C. Second Order Statistical Measures Approach[7] |
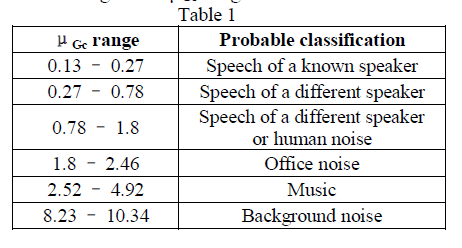
| This method has two aims: firstly, the discrimination between speech and other sounds; secondly the classification of the different acoustical sounds according to the μGc values, used as a measure of similarity, corresponding for each sound. For example, if μGc is within [2.52 – 4.92] then we can state that given sound should be music (Table 1).Table 1[7] shows Classification of sounds according to the μGc range. |
 |
D. Sinusoidal Parameters based audio classification[8] |
| In this approach, assume that S(k) be the spectrum of current speech frame. To accomplish the peak picking process 8 msec hop size is chosen. It has fixed number of sinusoidal parameters and also preserve the synthesize quality as close as possible to the original signal in terms of perception. This results in the significant reduction as well as better clustering performance. Table 2[8] shows mixed type audio classification accuracy. |
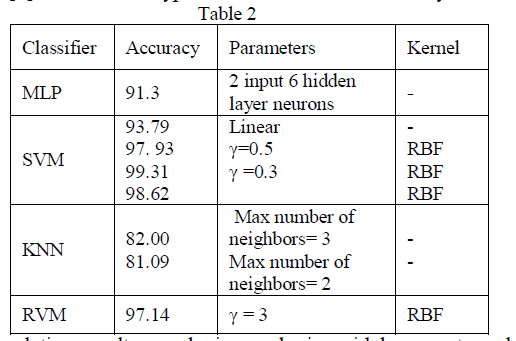 |
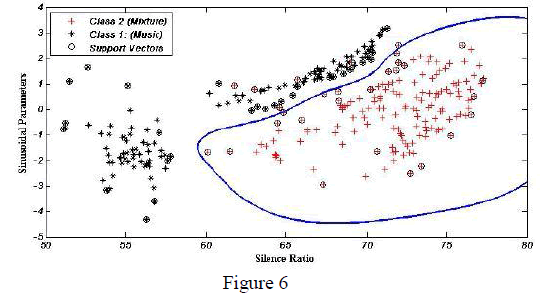
| As it was enlightened in simulation results, employing such sinusoidal parameters along with the so-called SVM classifier, will successfully improve the performance of the proposed classification. Figure 6[8] is showing the decision boundaries using SVM[8]. |
 |
V. CONCLUSION |
| Signal separation is a difficult problem and no reliable methods are available for the general case. The detailed research on all the works done on separation of audio signals has led us to the conclusion that Harmonic Structure characteristic is the effective with respect to others as it preserves the audio quality. Moreover, most of the instrument sounds are harmonic in nature. Harmonic structure of music signal is stable. Harmonic structures of the music signals performed by different instruments are different. So, we can easily classify and separate different signals. However, this algorithm doesn’t work for non-harmonic instruments, such as some drums. Some rhythm tracking algorithms can be used instead to separate drum sounds. |
| Pre-processing techniques like sinusoidal parameter approach and SOSM approach have also led us to the conclusion that selection of feature is an important step in the research field especially in music. That is why, the need to select the most efficient and accurate feature is essential for audio classification. Classifiers like SVM are proven to be the best classifiers as they more accurate than other although it may get trade off by the elapsed time. |