Accelerating Cavity is a metallic chamber which is shaped to resonate at a specific frequency and allows radio waves to interact with passing particle bunches. Accelerating cavity is used to accelerate the charged particles to a higher energy level. At high energy level radiations are emitted which are useful for industrial, medical and other different applications. Automated setup for measurement of accelerating cavity is prepared using LabVIEW. The setup automatically measures field distribution and relative effectiveness of accelerating cavity. A metallic bead is used which perturbs the frequency which is directly proportional to field distribution, hence field distribution can be determined out. The stepper motor with encoder feedback is used to control the motion of bead inside the cavity and also monitors the bead position. The setup is based on PXI and vector network analyser is used to measure the frequency and phase shift for field measurement. Thus the whole setup monitors, controls and acquires real time data using LabVIEW.
Keywords |
| accelerating cavity, LabVIEW, field distribution and relative effectiveness, stepper motor, encoder,
PXI, vector network analyser, real time data. |
INTRODUCTION |
| Automatic test setup for the measurement and evaluation of accelerating cavity is developed at PHPMS, RRCAT. The
accelerating cavity used is a copper cavity. Bead pull method is a commonly used technique to measure the field
distribution in the Radio frequency (RF) cavity. The electro-magnetic field distribution properties of accelerating
cavities are determined using perturbation techniques. A small metallic or dielectric object or a bead displaces stored
electromagnetic energy, causing a frequency shift[1]. This frequency shift is proportional to the amount of original
energy that is stored within the bead volume[2]: |
| Δf / f =ΔU/U |
| The perturbed frequency measurement is taken using a metallic bead. It Plots a graph of Δ f /fo against distance as the
bead travels the cavity’s entire length |
| Measuring the frequency shift between the perturbed resonant frequency f and unperturbated resonant frequency, fo, we
can directly measure the difference between the squares of the magnetic field and electric field, respectively at the
position of the perturbing object. The measurement is performed using vector network analyser. |
The following measurements are taken |
| 1. Initially an unperturbed frequency measurement is taken by VNA and data is stored by using a software. This
measurement is taken without inserting the perturbing object i.e. the bead. |
| 2. Secondly a perturbed frequency measurement is taken by inserting the bead .This plots a graph of Δ f /fo
against distance as the bead travels the cavity’s entire length, the position of bead being continuously
monitored by the feedback encoder. |
| 3. Δ f /fo is then integrated over the length and relative effectiveness of the cavity (R/Q) is found out. |
RELATED WORK AND LITERATURE SURVEY |
| For RF field measurements bead pull technique plays an important role . This technique is basically done to obtain field
distribution inside the resonant structure and also used to obtain the necessary field flatness by tuning. The Bead-Pull
system consists of a small metallic bead being pulled through a cavity while the electric field measurement in the
cavities is done [3]. A stepper motor and a pulley system guide the motion of the bead through the cavity while a
Vector Network Analyser is used to take the RF measurements [4]. A program is written in LabVIEW software and
thus control of hardware is done using LabVIEW. The software will display the stepper motor’s position, monitor the
data acquire the data by Vector Network Analyser and process the data [5].A closed loop motor control is developed
using LabVIEW. The system gives feedback in terms of position [6].The data acquisition is based on motion card. The
motor can be moved forward and backward according to the programming and potentiometer or encoder for position
sensing and feedback is used. Thus in LabVIEW, VIIs are developed in the block diagram window and obtained output
is displayed in the front panel. The front panel also displays the instantaneous position of the motor. The VI uses the
polynomial to generate a velocity profile which in turn is converted into a voltage profile for the motor armature
through a conversion formula. This conversion formula is determined through the use of motor speed-voltage
characteristics. Reading the position of the motor and sending the appropriate voltage is done using motion card [7]. |
PROPOSED SETUP |
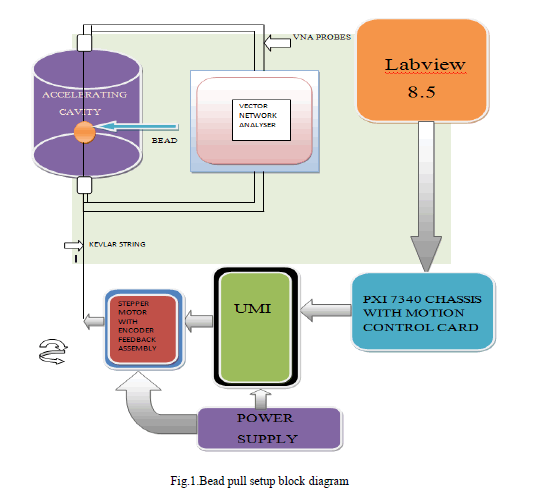
| Experimental set up is shown in Figure 1. The dielectric (Alumina) bead of 4.21 mm radius mounted on a thin Kevlar
string which runs longitudinally through the cavity. Kevlar is used because of its inelasticity and strength under tension.
A counter weight is attached to one end of string for constant tension to the string as it is drawn through the cavity..
Stepper motor drive is used in the Z (longitudinal) plane which pulls the bead through the cavity and then it is
calculated and ensured by the control system that bead moves to a distance of 0.0719 mm for each count. We employ
two probes, one to excite the cavity, and other to detect the excitation, and determine the resonant frequency and
frequency shift. |
 |
TECHNIQUE OF MEASUREMENT |
| A GUI based software programming for measurement, processing, acquisition, storing and on line monitoring of
resonance frequency has been developed in LabVIEW. The GUI also includes facility for data storing in excel file for
further calculation and off line plotting & analytical calculation of different parameters. |
| This software controls the total movements of the stepper motor. If the bead is not at the starting position then user can
move the motor in the forward direction in continuous mode. The software provides user to set the motor for particular
step or count for one command. |
Motion control of a stepper motor |
| Motion control based on position of stepper motor: |
| The controller requires the following information to move to another position in a straight line: |
| • Start position—Current position, normally held over from a previous move or initialized to zero. |
| • End position—Also known as the target position, or where we want to move. |
| • Move constraints—Maximum velocity, maximum acceleration, maximum deceleration, operation mode for motion. |
| NI Motion Controller is used to separately set the acceleration and deceleration jerk values. The motion controller uses
the given information to create a trajectory that never exceeds the move constraints and that moves an axis or axes to
the end position as specified. The controller generates the trajectory in real time, so we can change any of the
parameters while the axes are moving. |
Trajectory planning |
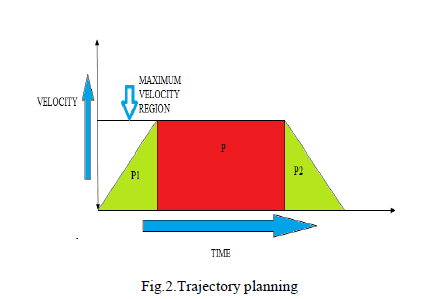
| Trajectory is the path followed by the moving object. |
| (1) According to target position the maximum velocity is set. If the target position is short, smaller number of pulses
are given to the motor. |
| (2) Using this, the time of move can be calculated. |
| (3) Then maximum acceleration or deceleration value is calculated using the velocity and time data .It must follow a
trapezoidal shape. |
| (4) Thus to follow a suitable trapezoidal path the calculation is made using the velocity time graph shown below in
fig.2 |
 |
Mathematical Calculation for trajectory generation |
| The sum of area of two triangles, that is, (P1+P2) must be less than the middle rectangle (P) to follow a trapezoidal
trajectory. Thus first velocity is set at minimum, that is, 100. At counts/sec say, for 3000 counts target position and then
slope is reduced by increasing maximum acceleration value. Thus time is reduced and suitable time is obtained for
constant velocity path. Thus the steps cannot be missed and the motor will follow the predetermined steps for motion in
the cavity. |
Motor motion algorithm in LabVIEW |
| The move algorithm includes the following steps: |
| (1) Specify:-Enable Encoder, Set Operation mode |
| (2) Insert Move:- Constraints: Maximum Velocity in counts/sec, Acceleration and deceleration in counts/ss. |
| (3) Start motion:-Starts the move |
| (4)Read position-Reading the exact position of motor shaft. |
| (5) Reset motion: It will reset the motor to the starting point. The start position is always the current position of the axis
or axes. The target position and set operation mode is set as the absolute position is loaded to move to a position
relative to the starting position. Although any parameter can be updated while the move is in progress, the new
parameter is used only after a subsequent Start Move [8]. |
Algorithm of measurement: |
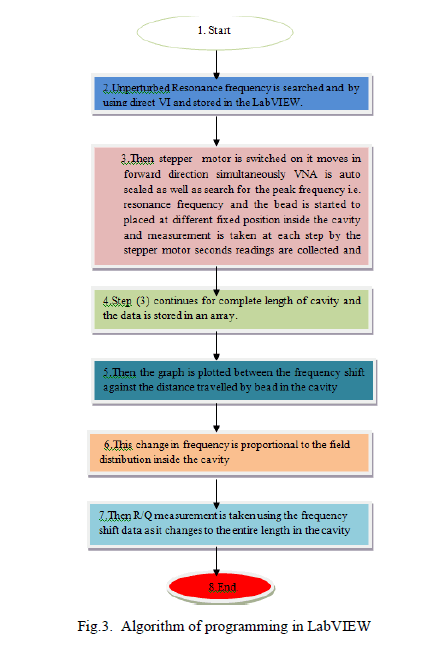
| The algorithm of programming is shown in fig.3. Here the steps to obtain field
distribution and the relative effectiveness(R/Q) of accelerating cavity are presented. |
 |
RESULTS |
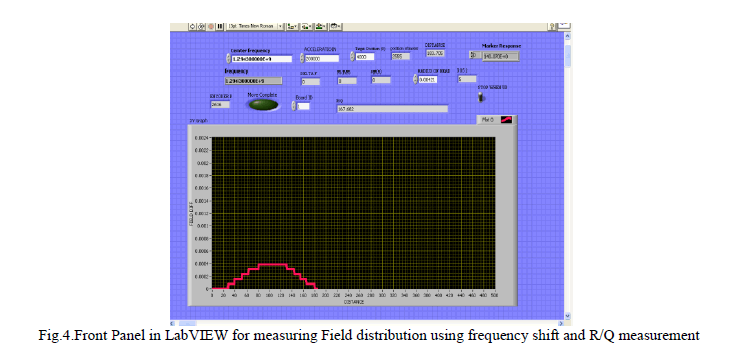
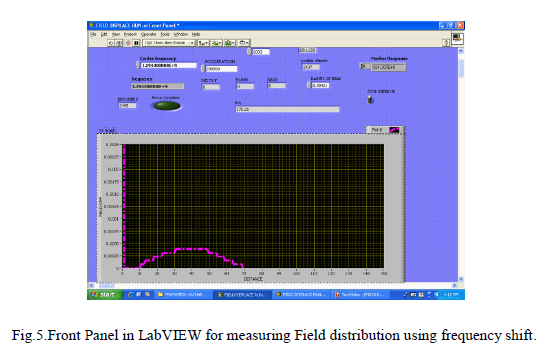
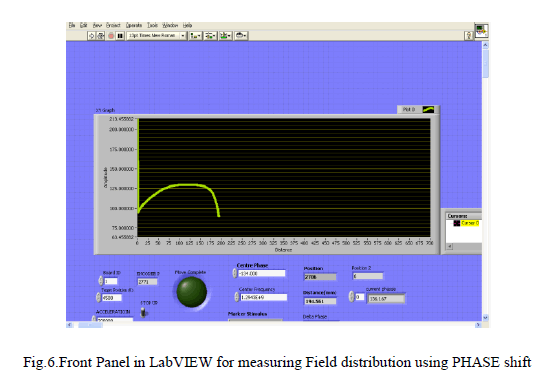
| The obtained output of field distribution pattern is shown in the fig.4.and fig.5. The graph is plotted between the
electromagnetic field distribution at y axis and distance at x axis. First the bead is outside the cavity so that there is no
electric field. So initially the change in field distribution is zero. As soon as the bead enters to the spherical region of
the accelerating cavity there is relative shift in the electromagnetic field. The stepper motor moves the bead in steps and
RF reading is taken by vector network analyser at each step of the motor. Now as the bead enters the centre of the
cavity there will be maximum shift which is measured by the vector network analyser. This shift is in the form of
frequency. So using frequency shift data, field distribution inside the cavity is recorded. Now to evaluate R/Q the
change in the frequency is integrated over the length of cavity. To evaluate this the frequency shift data is added
continuously using a software and it is multiplied by suitable constants and stored in the software. In fig 6, .using phase
shift data, the field distribution is recorded. At the centre of the cavity there is maximum phase shift. The phase shift
has more sensitivity compared to the frequency shift so a smooth sine wave curve is obtained. |
 |
| Description of graph: Field distribution v/s distance travel by bead along the entire cavity length
Thus the graph is obtained at :
Centre frequency: 1.2943GHz
Perturbed frequency: 1.2943GHz to 1.2938GHz
Preset Velocity of motor: 300counts/sec, Preset acceleration of motor: 200000counts/sec2
Radius of bead: 4.21mm
Target position: 4000 counts.
Encoder resolution: 512 lines/revolution or 2048 counts/revolution
Output: Relative Effectiveness(R/Q):167.682 ohm
Fig. |
 |
| Description of graph: Field distribution v/s distance travel by bead along the entire cavity length
Thus the graph is obtained at :
Centre frequency:1.2943GHz
Perturbed frequency:1.2943GHz to 1.2937GHz
Preset Velocity of motor:200counts/sec
Preset acceleration of motor:200000counts/sec2
Radius of bead:4.21mm
Target position:4000 counts.
Encoder resolution:512 lines/revolution or 2048 counts/revolution |
 |
| Description of graph: Field distribution v/s distance travel by bead along the entire cavity length
Thus the graph is obtained at
Centre frequency:1.2943GHz
Perturbed frequency:1.2943GHz to 1.2938GHz
Preset Velocity of motor:200counts/sec
Preset acceleration of motor:200000counts/sec2
Radius of bead:4.21mm
Target position:4000 counts.
Encoder resolution:512 lines/revolution or 2048 counts/revolution |
CALCULATIONS |
| The graph of frequency shift against the bead position is plotted using a LabVIEW software. As frequency shift is
proportional to the change in the electromagnetic field inside the cavity, field distribution in the cavity is determined.
Also relative effectiveness ratio (R/Q) is found out using the frequency change as the bead travels to the entire cavity. |
R/Q is calculated as: |
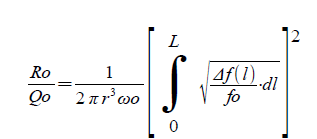 |
| wo = angular unperturbed resonant frequency rad/s)
r = radius of bead (m)
L = length of cavity (m)
Δ f(l) = perturbation change in frequency (Hz)
fo = unperturbed resonant frequency (Hz) |
| Centre frequency (f0): 1.2943GHz
Perturbed frequency: 1.2943GHz to 1.2938 GHz
Radius of bead(r): 4.21 mm
Output Obtained: Relative Effectiveness(R/Q): 167.682 ohm |
CONCLUSION |
| An automatic technique for measuring the field distribution and relative effectiveness ratio (R/Q) in accelerating cavity
is developed. The technique can be considered useful in many applications. LabVIEW environment offers many
advantages for real time control and data logging. The LabVIEW programming techniques can be learnt very quickly
compared to the conventional codes and programs can be developed rapidly for interfacing instruments and hardware.
The measurement of unperturbed resonant frequency and perturbed resonant frequency and relative effectiveness ratio value of the RF cavity is determined using a vector network analyser. For higher accuracy a mechanical setup with
higher precision and a constant cavity temperature is required. This will enable accurate phase and frequency shift for
more accurate measurements. |
References |
- Mohania P.*, Rajput V.*, Baxy D.*, Agrawal A.*, Mahawar A.*, Singh K. .*, Shrivastava P.* DESIGN AND DEVELOPMENT OF RF SYSTEM FOR VERTICAL TEST STAND FOR CHARACTERIZATION OF SC RF CAVITIES Indian Particle Accelerator Conference, 2011 (InPAC2011) , IUAC, New Delhi, Feb., 15-18, 2011
- Bead-Pulling Measurement Pulling Measurement (Multi-cell Cavity Field Flatness) Prepared by Sung-Woo Lee
- P.A. McIntosh, “Perturbation measurements on RF cavities at Daresbury”, these proceedings.
- www.rohde-schwarz.com
- JacklineKoech Electrical and Computer Engineering Department University of Massachusetts Amherst, Massachusetts, 01003 Advisor: David Peterson Antiproton Source Department, Accelerator Division Fermi National Accelerator Laboratory Batavia, Illinois, 60510
- Kenjo, t.: 'Stepping motors and their microprocessor controls', Clarendon Press, 1985, pp 196-230.
- J.A. Clarke and P.A. McIntosh, “The Application of LabVIEW for Data Acquisition at an Accelerator Laboratory”, EPAC1994
- www.ni.com/motion
- Design of Automatic Test Setup for Accelerator Cavity Characterization and Measurement "Vikas Rajput and P. Shrivastava, National Symposium on Instrumentation(NSI-33) Dec 2008,Andhra University ,Vishakhapatnam
|