ISSN ONLINE(2320-9801) PRINT (2320-9798)
ISSN ONLINE(2320-9801) PRINT (2320-9798)
Ms.S.Indumathi1, Mr. P. Ranjithkumar2
|
| Related article at Pubmed, Scholar Google |
Visit for more related articles at International Journal of Innovative Research in Computer and Communication Engineering
Cloud data centre’s improve CPU utilization of their servers (physical machines or PMs) through Virtualization (virtual machines or VMs). Over virtualized and under virtualized PMs suffer performance degradation and power dissipation respectively. In this paper, system that uses virtualization technology to allocate data center resources dynamically based on application demands and support green computing by optimizing the number of servers in use. Thus minimizes the hardware cost and saves the energy and used when a system under a heavy load thus improves the system performance. The concept of “skewness” is introduced to measure the unevenness in the multidimensional resource utilization of a server. By minimizing skewness, we can combine different types of workloads nicely and improve the overall utilization of server resources. Finally minimizes the overload in a server by mitigate the process from high load (i.e. hot spot) server into normal load server (i.e. warm state) with the help of mitigation list. Physical Machine does not allow using a server in case of overload. Thus avoid the failure of server under high load.
Keywords |
| Image processing, CBIR, Canny Edge Detection Algorithm, Ayurveda Medicinal System, Edge histogram, Color Histogram. |
INTRODUCTION |
| Medicinal plants form the backbone of a system of medicine called Ayurveda and is useful in the treatment of certain chronic diseases. Ayurveda is considered a form of alternative to Allopathic medicine in the world. This system of medicine has a rich history. Ancient epigraphic literature speaks of its strength. Ayurveda certainly brings substantial revenue to India by foreign exchange through export of ayurvedic medicines, because of many countries inclining towards this system of medicine. There is Considerable depletion in the population of certain species of medicinal plants. Hence we need to grow more of these plant species in India. This rejuvenation work requires easy recognition of medicinal plants. Plant diseases have turned into a dilemma as it can cause significant reduction in both quality and quantity of agricultural products. Diseases in leaves cause major production and economic losses in agricultural industry. Monitoring of health and detection of diseases in leaves is critical for agriculture and medical system. The most significant part of research on plant disease to identify the disease based on CBIR (Content based image retrieval) that is mainly concerned with the accurate detection of diseased plant. It is important for Ayurveda practitioners and also traditional botanists to know how to identify the medicinal plants through Computers. Based on the color space, histogram, and edge detection techniques, we can able to find the disease of plant. Hence here is a proposal of identification of these plants using leaf edge histogram, color histogram. |
| The methodology here gives the identification of medicinal plants based on its edge features. The color image is converted to its gray scale equivalent image. From this gray scale image, calculate the edge histogram. Apply canny edge detection algorithm for this purpose. The next information i.e., the area is calculated by the proposed algorithm. The next information is the color of the image which is extracted in the form of the histogram for the overall image. These algorithms are applied for the test image and the database image and difference in edge histogram and color histogram is calculated. Obtain the average value of these parameters. Repeat this process for all the leaf images in the database and calculate the difference in the average value parameter between the test and database image. The test image and database image pair which gives the least values is the correctly identified image in turn the plant. |
| Content based image retrieval (CBIR) offers efficient search and retrieval of images based on their publishing, medicine, architecture, etc. |
II. RELATED WORK |
A. Types of Diseases |
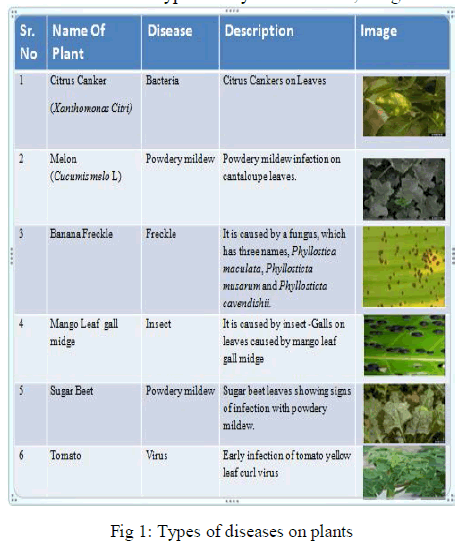
| Plant diseases may be broadly classified into three types. They are bacterial, fungal and viral diseases. |
 |
B. Parameters for Identifying Healthy or Infected Plant |
| Edge histogram is chosen to find the given plant shape. Since edge detection is used to characterize the plant boundaries, it is considered an important stage in feature extraction and classification. |
| Variables involved in the selection of an edge detection operator include: |
| • Edge orientation: The geometry of the operator determines a characteristic direction in which it is most sensitive to edges. Operators can be optimized to look for horizontal, vertical, or diagonal edges. |
| • Noise environment: Edge detection is difficult in noisy images, since both the noise and the edges contain high-frequency content. Attempts to reduce the noise result in blurred and distorted edges. Operators used on noisy images are typically larger in scope, so they can average enough data to discount localized noisy pixels. This results in less accurate localization of the detected edges. |
| • Edge structure: Not all edges involve a step change in intensity. Effects such as refraction or poor focus can result in objects with boundaries defined by a gradual change in intensity. |
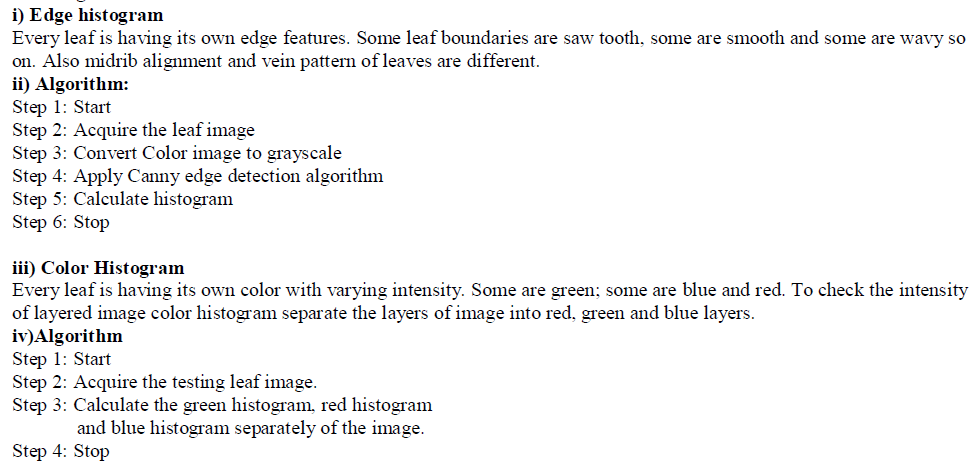
| Color histogram helps for finding color distribution of pixels in a plant image. All of the different colors and shades of colors in RGB color are derived from varying combinations of RED, GREEN and BLUE. All of the different colors and shades of colors in RGB color are derived from varying combinations of RED, GREEN and BLUE. The color of each pixel in an RGB digital image is determined by the tonal value (0-255) assigned to each color channels for each pixel. In other words every pixel has a numerical tonal value assigned for each of the three color channels R, G and B. |
C. Content Based Image retrieval (CBIR) |
| The term [CBIR] describes the process of retrieving desired images from a large collection on the basis of features (such as color, texture and shape) that can be automatically extracted from the images. Content based image retrieval (CBIR) offers efficient search and retrieval of images based on their content. In many current applications with large image databases, traditional methods of image indexing have proven to be insufficient. Now days Users are not satisfied with the traditional information retrieval techniques. so content based image retrieval technique is a source of exact and fast retrieval. Conventional databases allow for textual searches on Meta data only. Content Based Image Retrieval (CBIR) is a technique which uses visual contents, normally called as features, to search images from large scale image databases according to users’ requests in the form of a query Edges convey essential information to a picture and therefore can be applied to image retrieval. The edge histogram descriptor captures the spatial distribution of edges. The retrieval may involve the relatively simpler problem of finding images with low level characteristics (e.g. finding images of sunset) or high level concepts (e.g. finding pictures containing bicycles).With the development of the Internet, and the availability of image capturing devices such as digital cameras, image scanners, the size of digital image collection is increasing rapidly. This paper is organized as follows; Section 2 introduces canny edge detection algorithm; Section 3 gives the literature review; Section 4 discusses our proposed methods; Section 5 gives the experimental results and section 6 gives the conclusion to the problem |
III. PROPOSED ALGORITHM |
a. Canny Edge Detection Algorithm |
| The Canny edge detection algorithm is known to many as the optimal edge detector. Canny's intentions were to enhance the many edge detectors already out at the time he started his work. The canny edge detector first smoothes the image to eliminate and noise. It then finds the image gradient to highlight regions with high spatial derivatives. The algorithm then tracks along these regions and suppresses any pixel that is not at the maximum (nonmaximum suppression). The gradient array is now further reduced by hysteresis. Hysteresis is used to track along the remaining pixels that have not been suppressed. Hysteresis uses two thresholds and if the magnitude is below the first threshold, it is set to zero (made a nonedge). If the magnitude is above the high threshold, it is made an edge. And if the magnitude is between the 2 thresholds, then it is set to zero unless there is a path from this pixel to a pixel with a gradient above T2. The methodology here is that first picked up the images of healthy and infected plants. Then apply the canny edge detection algorithm on samples. Canny edge detection algorithm preserving the structural properties to be used for further image processing. The purpose of edge detection in general is to significantly reduce the amount of data in an image. The aim of this algorithm with regards to the following criteria: |
| i) Detection: The probability of detecting real edge points should be maximize while the probability of falsely detecting non edge points should be minimized. This corresponds to maximizing the signal to noise ratio. |
| ii) Localization: the detected edges should as close as possible to the real edges. |
| ii) Localization: the detected edges should as close as possible to the real edges. |
The Canny Edge Detection Algorithm |
| The algorithm runs in 5 separate steps: |
| 1. Smoothing: Blurring of the image to remove noise. Implemented through Gaussian Filtering with Specific Kernel Size (N) and Gaussian Envelope Parameter Sigma. |
| 2. Finding gradients: The edges should be marked where the gradients of the image has large magnitudes. |
| 3. Non-maximum suppression: Only local maxima should be marked as edges. Find gradient direction and using these directions perform non maxima suppression. |
| 4. Double Thresholding: Potential edges are determined by thresholding. |
| 5. Edge tracking by hysteresis: Final edges are determined by suppressing all edges that are not connected to a very certain (strong) edge. |
IV. PROPOSED METHODOLOGY |
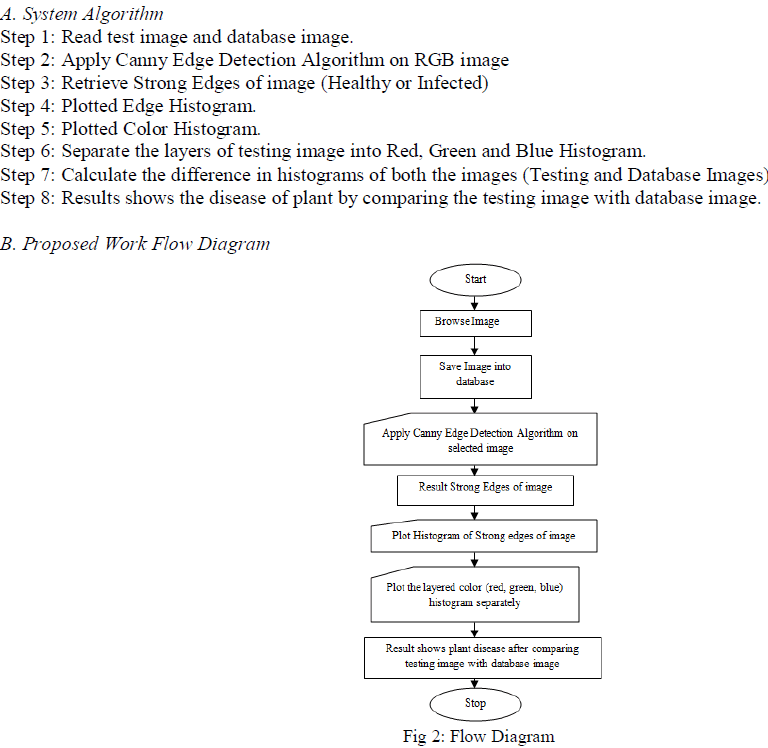
| The methodology here gives the identification of medicinal plants based on its edge features. The color image is converted to its gray scale equivalent image. From this gray scale image, calculate the edge histogram. Apply canny edge detection algorithm for this purpose. The next information is the color of the image which is extracted in the form of the histogram for the overall image. Plant diseases cause major production and economic losses in agriculture and forestry. The bacterial, fungal, and viral infections, along with infestations by insects result in plant diseases and damage. The medicinal plants are used in ayurvedic medicines. Manual identification of medicinal plants requires a priori knowledge. The color histograms are obtained in RGB color spaces. This system of medicine is useful in the treatment of certain chronic diseases such as cancer, diabetes, blood pressure, skin problems etc. But, the knowledge of these plants dies with the experts, because of the fact that the experts do not share with others. Hence it is necessary to use technology and develop tools for the recognition and use of medicinal plants from their image. |
| The RGB images of healthy and infected plants will pick up. Apply the CANNY’s edge detection technique on RGB image to detect the edges of layered images. Choose the test sample of plant. When the testing sample(healthy or infected) is selected, the training process will started again on the testing image and plot the histogram for the strong edges of testing samples. Histogram is a tool used to show central tendencies. For any statistical data can use the good old parameters of mean, median and mode and can directly find them. Color histogram separate the layers of RGB image into red, green and blue color histogram to check the intensity of each color pixels in that testing image which is helpful for identification of healthy and infected sample. |
 |
C. Image Acquisition |
| The images of leaves of medicinal plants were obtained from a 5 to 12 mega pixel camera and it can be used as per our requirement. The distance between camera and the leaf was maintained to be 15cms and the image was taken from the top view. All the images were taken in natural day light with white background. |
D. Images saved to database: |
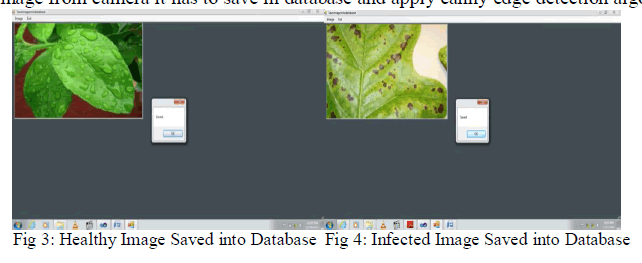
| After capturing the image from camera it has to save in database and apply canny edge detection algorithm. |
 |
| The methodology here gives the identification of medicinal plants based on its edge features. The color image is converted to its gray scale equivalent image. From this gray scale image, calculate the edge histogram. Apply canny edge detection algorithm for this purpose. |
E. Histogram |
 |
V. EXPERIMENTAL RESULTS |
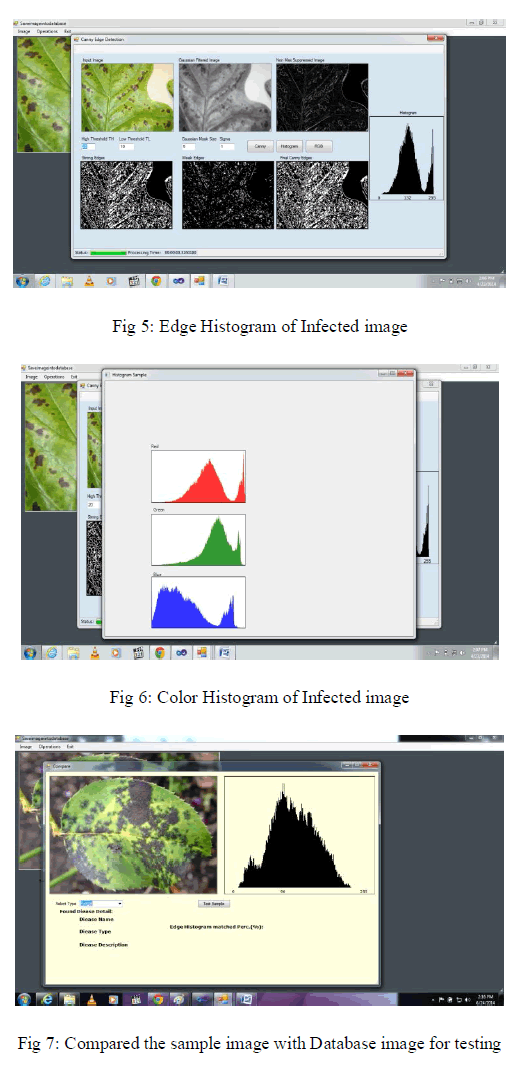
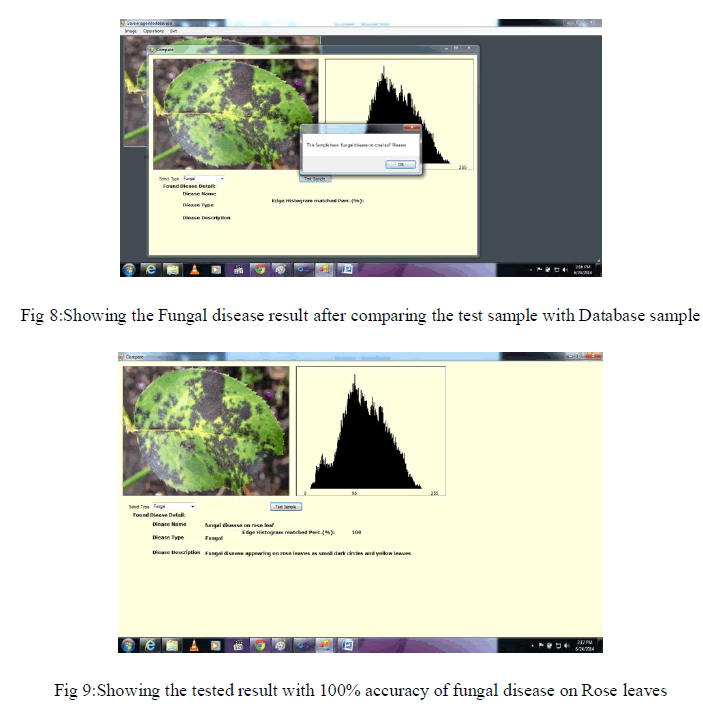
| The Canny Edge Detector first smoothes the image to eliminate the noise. It then finds the image gradient to highlight regions with high spatial derivatives. The algorithm then tracks along these regions and suppresses any pixel that is not at the maximum (nonmaximum suppression). The gradient array is now further reduced by hysteresis. Hysteresis is used to track along the remaining pixels that have not been suppressed. Hysteresis uses two thresholds and if the magnitude is below the first threshold, it is set to zero (made a nonedge). If the magnitude is above the high threshold, it is made an edge. And if the magnitude is between the 2 thresholds, then it is set to zero unless there is a path from this pixel to a pixel with a gradient above T2. Draw the Edge histogram of strong edges after applying Canny |
| Edge Detection Algorithm and then draw the color Histogram to separate the red, green blue layer histogram for pixels intensity of each color to find the mean and median value of testing sample which is stored in database. |
 |
 |
VI . CONCLUSION |
| To wind up all the information discuss above, I should like to conclude that Canny Edge Detection Algorithm is an efficient and accurate technique for detecting edges of healthy and infected plants and significantly reduces the amount of data and filters out useless information, while preserving the important structural properties in an images. Plot the histogram of strong edges of healthy and infected plant after applying Canny edge Detection Algorithm. In training process separate the layers of testing image into Red, Green and Blue layers histogram which is one of the parameter for testing the image with database image. In this paper compare testing sample with the diseased sample and these steps will take few minute to display the comparison result on the basis of mean median values of image histogram and Display which type of disease. The work assists human beings in classification of medicinal plants in the real world and considered an essential task in pharmaceutical industry, Ayurvedic practitioners and botanists. |