Research & Reviews: Journal of Material Sciences
ISSN:2321-6212
ISSN:2321-6212
Cossa P1, Sitoe A1, Madivate C2, Attore F3, Manhique A1*
1Department of Chemistry, Faculty of Sciences, Eduardo Mondlane University, Maputo, Mozambique
2Department of Medical Sciences, Higher Institute of Sciences and Technology of Mozambique, Maputo, Mozambique
3Department of Environmental Biology, Faculty of Sciences, Sapienza University of Rome, Rome, Italy
Received: 05-Feb-2025, Manuscript No. JOMS-25-160907; Editor assigned: 08-Feb-2025, Pre QC No. JOMS-25-160907 (PQ); Reviewed: 22-Feb-2025, QC No. JOMS-25-160907; Revised: 05-Jun-2025, Manuscript No. JOMS-25-160907 (R); Published: 12-Jun-2025, DOI: 10.4172/2321-6212.13.2.006
Citation: Cossa P, et al. Biosafety Assessment of Clay-Based Utensils from Three Regions of Mozambique. RRJ Pure Appl Phys. 2025;13:001.
Copyright:© 2025 Cossa P, et al. This is an open-access article distributed under the terms of the Creative Commons Attribution License, which permits unrestricted use, distribution and reproduction in any medium, provided the original author and source are credited.
Visit for more related articles at Research & Reviews: Journal of Material Sciences
This study aimed to characterize clay deposit from three regions in Mozambique (Macupulane, Mutamba and Lichinga), evaluate the leaching of heavy metals into water boiled in clay pots produced by those clays and the non-carcinogenic human health risk. Raw clays sample were subjected to physicochemical (pH, specific surface area, and cation exchange capacity), thermal, elemental and mineralogical characterization. Furthermore, clay samples were used to produce handcrafted clay pots at different kiln temperatures (800 to 1000°C). To simulate heavy metal leaching during boiling distilled water were heated for 3, 4, and 5 hours during three consecutive days (cycles) to simulate real-life use of clay pots. Mineralogical analysis using X-ray Diffraction (XRD) revealed that kaolinite was the predominant clay mineral in Mutamba and Lichinga clays (63.10% and 67.10% wt.%), while quartz dominated in Macupulane clay (79.70 wt.%). X-ray Fluorescence (XRF) analysis indicated that all samples were primarily composed of SiO2 (47.11% to 84.92% by weight) and Al2O3 (4.92% to 26.44 wt.%). The thermal behavior of the clays aligned with their mineral composition. Leaching experiments demonstrated that Macupulane clay pots exhibited higher heavy metal leaching into boiled water during the third heating cycle and after 5 hours of boiling. The leaching process was significantly influenced by boiling time, kiln temperature, raw clay source, and repetitive use of clay pots (p<0.05). Human health risk assessment revealed that arsenic, cadmium, and chromium were the most leached heavy metals, posing unacceptable non-carcinogenic risks to consumers of water or food prepared in those clay pots.
Clay pots; Food; Heavy metal; Kaolinite; Leaching; Mozambique; Water
Ceramic ware is traditionally and widely used in rural areas of Mozambique, as well as other sub-Saharan African regions, for cooking and preserving foodstuff. In addition, ceramic wares are used to prepare traditional medicines which are then administered, usually to children [1]. These ceramic utensils are still frequently found in Mozambique rural areas as everyday household items employed for serving a diverse range of foods and beverages at different temperatures (hot or cold). Ceramic products are usually made by mixing common clays with small quantities of light clays fired in traditional kilns at temperatures not much higher than 800 to 900°C. However, following the initial firing, the items are coated with a moist glaze and undergo a second firing at around 900-1000°C [2].
Clay ceramic ware offers several advantages, making them highly versatile for use in homes, commercial kitchens, and social functions, they are resistant to corrosion, good insulators that can withstand high temperatures, are easy to clean, are hard but brittle and usually come in a lovely color [3]. However, unlike modern utensils, traditional ones lack a protective layer of inert material, which can make them potential sources or routes of contamination [4-6].
As clay pots are made from clay, they have the potential to contain heavy metals found in the earth's crust [7]. Certain ceramic wares have been recognized as sources/routes of exposure to Potentially Toxic Metals (PTMs) when used with acidic food or alkaline foods. Studies have demonstrated that when clay cookware comes in contact with food, migration (leaching process) of trace elements into food occurs under different conditions such as pH, type of food or high temperature reached during cooking. Therefore, clay pots pose a significant impact on human health [8].
Although trace levels of some metals, such as Cr, Fe, Cu and Zn are necessary for normal body functioning, excessive intake of these metals can have severe health consequences [9,10]. Metals that are ingested can be hazardous to humans as they tend to bioaccumulate in the body and cause harm to internal organs. Their concentrations increase in biological systems over time because they are slowly metabolized or excreted and are therefore stored in the system [11]. Cd, Ni, and Pb primarily affect the kidney, while As can cause failure in multiple organs [12,13]. A recent study conducted by Mathee and Street discovered that the ingestion of mercury, lead, arsenic, and cadmium resulted in over one million cases of illness and more than 56,000 deaths [14]. Among these cases, lead accounted for 54% of the deaths, methylmercury and arsenic accounted for 22% and 20% respectively, and cadmium accounted for 1%.
Uriah et al., in Nigeria investigated the risk of metal exposure from the use of traditional clay made utensils. The authors heated reference water (distilled water) of known metal for 1-2 hours in clay pots. The results revealed that heated waters displayed significantly higher concentrations of As (0.043-0.440 mg/L), Tl (0.326 mg/L) and Zn (0.801-1.16 mg/L), Al (0.109-0.79 mg/L), Fe (0.042-0.178 mg/L) compared to that of the reference water concentrations. Chagas et al., investigated the leaching of lead from clay pot of Brazil origin using Inductively Coupled Plasma Optical Emission Spectroscopy (ICP-OES) [15]. The concentration of leached Pb was found to exceed 2.0 mg/kg, which is the limit regulated by the Brazilian Health Regulatory Agency. Furthermore, the concentration increased with longer contact time between the food and the pot. In the study carried out by Fatunsin et al., different types of pot such as clay, non-stick, stainless steel, aluminum cast pot, aluminum and glass pots were evaluated. The study showed that heated water in clay pot gave the highest concentrations of Cr and Ni, (7.27 and 22.63 μg/L, respectively). In another study by Boisa and Bekee [16], the concentrations of Fe leached upon exposure of Ara-Ekiti clay pot to water of neutral pH, alkaline pH and acidic pH were 0.16 ppm, 0.08 ppm and 1.15 ppm at room temperature, and 0.19 ppm, 0.16 ppm and 5.33 ppm at 100°C, respectively. However, the results of this study indicate that Cd, Cr, Cu, and Pb were not present in leachable forms in clay pots.
In developing countries records of toxic elements in food and food wares are not known to consumers due to lack of studies.
Nonetheless, to the best of our knowledge, there are no studies that specifically investigate the leaching of toxic heavy metals into water heated using clay pots manufactured in Mozambique. Therefore, studies are needed to evaluate the elemental composition and leaching potential of clay deposits and food ware products made from them. Thus, this work aims to investigate the leaching potential of toxic metals such as (As, Cd, Co, Cr, Pb, Se and Zn) from raw clays and traditional clay pots from three selected areas in Mozambique, specifically in Macupulane in Gaza province, Mutamba in Inhambane province and Lichinga in Niassa province. Previously, the physicochemical and thermal characteristics of the clays were investigated, and the influence of repetitive use, clay pot heating temperature, and cooking/boiling duration were also analysed.
Sampling
Samples of the clays used in this study were collected in three regions in Mozambique, specifically in the provinces of Gaza (Macupulane, 24°48' 31"S and 33°59' 10"E), Inhambane (Mutamba, 24°15' 26"S and 35°14' 17"E) and Niassa (Lichinga, 13°17' 60"S and 35°14' 45"E). At each location samples were taken at a depth of about 1 m with soil auger. After being collected, the samples were stored in plastic bags at room temperature and transported to the Chemistry Department of Eduardo Mondlane University, where the experimental part of the study took place. The clay samples were broken up and air-dried for 7 days, ground in a porcelain mortar and sieved with a mesh size of <4 μm (Figure 1). The sieved samples were homogenized, labelled in plastic bags and stored in the laboratory for subsequent analyses. Hereinafter, Macupulane clay is referred as MA, Mutamba clay as MU and the Lichinga clay as LI (Figure 1).

Figure 1. Images of the MA (a), MU (b) and LI (c) clay samples.
Clays characterization
X-Ray Diffraction (XRD): The mineralogical composition of clay samples was assessed by X-Ray diffraction (XRD)diffractometer. The experiments were performed on a Malvern Panalytical Aeris diffractometer (United Kingdom) operating at 40 kV and 0.9 mA. The measurements were performed on the 4 μm sieved raw clays using PIXcel detector and fixed slits with Fe-filtered Co-Kα radiation, with the following experimental conditions: receiving slit placed at 0.040°; counting area was from 5 to 70° on the 2θ scale; and counting time was 1.5 s. The phases were identified using the X'Pert high score plus software. The relative quantities of the phases present in the samples (mass percentage) were estimated using the Rietveld refinement method.
X-Ray Fluorescence (XRF): The chemical composition of clay samples was determined using X-Ray Fluorescence (XRF)spectrometer. XRF analyses were carried out using an ARL9400Os wavelength dispersion instrument. To analyze the elements, present in the clay sample, the sample was prepared by weighing 1 g of the clay sample, adding 9 g of lithium tetraborate (Li2Bi4O7), melting the mixture and analyzing the elements present in the sample in the form of oxides of the elements that make up the clay samples.
Thermal analysis: Thermogravimetric Analysis (TGA) were carried out using in a thermal equipment SDT Q600 V20.9 Build 20 of Thermal Analysis Instruments, Thermal Analysis (TA) Instruments (Delaware, USA) at constant heating rate of 10°C/min from room temperature to 800°C, under air atmosphere with a flow rate of 100 mL/min. The testing was carried out using 8 mg samples of raw clay powder in an aluminum crucible.
Physicochemical characterization: The physicochemical properties of the clays determined in this study were pH, Cation Exchange Capacity (CEC) and Specific Surface Area (SSA). The CEC and SSA was determined using the methylene blue method according to procedures specified in the ASTM C837-09 standard [17]. The procedure consisted of preparing a clay suspension ratio (2:10, clay: Water) and adding methylene blue dye (1.5 g/L) to the previously prepared clay suspension under stirring in a magnetic stirrer at 500 rpm. After every 3 minutes of stirring, a drop of the mixture was collected on a Whatman 113 filter paper and the end of the process was determined by the appearance of a light blue halo around the dark blue spot on the filter paper. After the appearance of the halo, the test was terminated and the volume of methylene blue used to form the halo was recorded for the purposes of calculating the CEC and the SSA of the clay, according Equations (1) and (2)
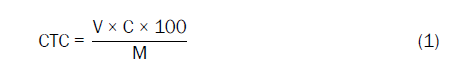
Where, V and C represent the volume and normal concentration of the methylene blue solution, respectively. M is the molar mass of methylene in kg.
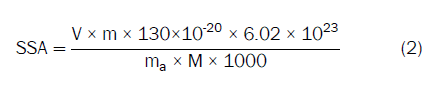
Where, V is the volume of methylene blue used; m is the mass of methylene blue used to prepare the solution; the value 130 × 10-20 represents the specific area of methylene blue (130 A2); 6.02 × 10²³ is Avogadro's number, M is the molar mass of methylene in kg and ma corresponds to the mass of dry clay.
The samples pH was determined in deionized water solution according to procedures recommended by Kusimi and Kusimi. The pH measurements were performed using a HANNA Edge HI2002-02 pH meter calibrated with standards (Titrisol standard solutions) at pH 4 and pH 7, with an accuracy of ± 0.05. About 20 g of the soil samples <2 mm from the three samples were weighed into plastic bottles with screw caps and 50 mL of deionized water was added and the plastic bottles were capped. The resulting suspension was shaken in a shaker to mix for a period of 15 minutes. The bottle cap was removed and the pH meter was measured.
Leaching experiments
In order to test the leaching of heavy metals from MA, MU and LI clay pots to water heated therein, 27 specimens (Figure 2) for each province were produced and burned at a temperature of 800, 900 and 1000°C, washed several times with distilled water with a pH of 7 and dried. For the experiments, the clay pots were filled with de-ionized water to about 90% of its capacity and heated up at 100°C during 3, 4 and 5 hours. Thereafter the water was allowed to cool, filtered and stored in polyethylene bottles and kept at 4°C for further analysis. Part of the water was conserved and reheated in two consecutive days. Some fraction of de-ionized water not used for the leaching test was preserved for analysis as blank.
Heavy metal in boiled water analysis by ICP-OES: The concentrations of As, Cd, Co, Cr, Pb, Se and Zn leached to water after boiling in clay pots were determined by ICP-OES (ICPE-9800 Series, Shimandzu, Kyoto, Japan) with the following analysis conditions: Plasma power 1.20 kW, plasma gas flow 10.00 L/min, auxiliary gas flow 0.60 L/min, carrier gas flow 0.70 L/min. Calibration curve were constructed from a multi-element stock standard solution of 100 μg/mL (Custom Made Multi-Element Standard; Matrix: 5% HNO3; Certified Aqueous Reference Material; Spectroscopic Solutions -de Bruyn; Chemists for Chemists; Ultraspec; Sanas). For that propose, 20, 40, 0, 80, 1 0 and 250 μL of the stock solution were pipetted into a 50 mL centrifuge tube to prepare standard solutions of 40, 80, 120, 160, 320 and 500 ppb and 1.65 mL of 65% HNO3 were added to each centrifuge tube and then the volume was topped up with deionized water. To analyze the water heated samples, 10 mL of the sample was taken and the same amount of HNO3 was added and read on the ICP-OES.
Human health risk assessment
The carcinogenic and non-carcinogenic risks for ingestion of water contaminated with clay pots leached heavy metals were evaluated through Estimated Daily Intake (EDI) calculated using the Equation (3).

Where, Cmetal (mg/L) is the heavy metal concentration in water, IR is the water ingestion rate (1.5 L/day for adults and 0.7 L/day for children), EF is the exposure frequency (350 days/year), ED is the exposure duration (70 years and 15 years for adults and children, respectively), BW is the average body weight (60 kg for adults and 15 kg for children), AT is the average exposure time which is given as AT=30 × 365 for adults and AT=6 × 365 for children for non-carcinogens [18]. The estimated daily dose values were compared with the corresponding Tolerable Daily Intake (TDI) recommended by WHO [19].
Hazard quotient evaluates the substance potential exposure at the level where there are no adverse effects. The non-cancer risks due to non-carcinogenic effects in heated water were determined by the Hazard Quotient (HQ) presented in Equation (4):

Where, EDI is the chronic daily intake and RfD is the reference oral dose. The values of the RfD and TDI for different metals are listed in Table 1. The overall potential non-carcinogenic health risk caused by exposure to a mixture of heavy metals in the heated water was estimated using the Hazard Index (HI). This was computed according to the EPA guidelines for health risk assessment using Equation (5) [20].
| Heavy metal | As | Cd | Co | Cr | Pb | Se | Zn |
|---|---|---|---|---|---|---|---|
| TDI (mg kg-1 dia-1) | 0.0021 | 0.0008 | 0.023 | 0.3 | 0.0036 | 0.093 | 0.43 |
| RfD (mg kg-1 dia-1) | 0.0003 | 0.001 | 0.0003 | 0.003 | 0.0035 | 0.005 | 0.3 |
Table 1. TDI e RfD values.
Statistical analysis
SPSS Software (version 24.0, IBM, Inc., New York, USA) was used for statistical analysis of the data obtained for each parameter. For comparison purposes the data were subjected to multivariate Analysis of Variance (ANOVA). The differences between mean were considered statistically significant at the probability level of P<0.05. Mean values and the measurement uncertainty (standard deviations) were computed with Microsoft Excel 2021.
Clays mineralogical composition
XRD: The results of semi quantitative mineralogical analysis (in wt.%) obtained by XRD of the three clay samples studied are presented in Table 2. According to the results, the percentage of quartz is relatively higher in MA clay sample (79.70 wt.%), compared to MU and LI clay (29.20 wt.% and 21.10 wt.%, respectively). Kaolinite is the main clay mineral present in MU and LI samples with a proportion varying from 63.10 to 67.10 wt.%, while MA sample presents 15.20 wt.%. All clays also contain lower contents of plagioclase, varying from 1.00 to 1.60 wt.% and muscovite (0.10 to 1.30 wt.%). Small amounts of gibbsite (4.50 wt.%) were only detected in MU samples, whereas smectite was not detected in MU samples. However, smectite was detected in the MA and LI sample at 1.70 and 2.00 wt.%, respectively (Table 2).
| Samples | Mineral content (wt%) | |||||||
|---|---|---|---|---|---|---|---|---|
| Quartz | Microcline | Kaolinite | Muscovite | Gibbsite | Plagioclase | Siderite | Smectite | |
| MA | 79.7 | 2.1 | 15.2 | 0.1 | 0 | 1.2 | 0 | 1.7 |
| MU | 29.2 | 0.2 | 63.1 | 1.3 | 4.5 | 1 | 0.7 | 0 |
| LI | 21.1 | 6.9 | 67.1 | 0.7 | 0 | 1.6 | 0.6 | 2 |
Table 2. Results of mineralogical analysis (in wt%) obtained by XRD for the clay samples.
According to Schulze cla mineral’s composition pla a vital role on cla properties such as la ered structure, size, exchangeable ions, and texture [21]. These properties are responsible for the ability to exchange ions, plasticity, ability to hold ions, or water on the surface, high adsorbing capacity etc. Therefore, the susceptibility of clays to heavy metal leaching depends mainly on the mineralogical and chemical composition of the clay. In general, high smectite content clay are more susceptible to heavy metal leaching than kaolinitic clays due to the weak bonding between two silica sheets that allow cations exchange [22,23]. On the other hand, kaolinitic clay have a more compact crystalline structure and are less prone to heavy metal leaching. These clays have a lower ion exchange capacity and therefore have a lower rate of metal release into the liquid medium [24].
Elemental composition of clay samples: Table 3 shows the XRF results of MA, MU and LI clay samples. The results show that the three samples present a similar composition, in general, although in variable proportions. MA and MU samples presented high percentages of Si (as SiO2) and Al (as Al2O3) with ~85 wt.% in total content which according to Kouadio et al., is an indicative of the silico-aluminous nature of the two clays. However, LI sample presents a different perspective showing Si-Al percentages below 65%, characteristic of kaolinitic clays [25]. These results can be associated with the presence of silicates according to the XRD results (Table 2), and free SiO2 identified as quartz. These predominant elements are followed by the Fe (as Fe2O3) with proportions varying from 1.77 to 11.82 wt.%. Fe2O3 is more predominant in LI clay sample, with contents of 11.82 wt%. This high iron content in these samples is consistent with the pink color observed (Figure 1). The MA and MU clay contains a low iron content (<4 wt.%) which is a consequence of the white color of the sample (Table 3).
| Samples | Fe2O3 | SiO2 | Al2O3 | K2O | Mn3O4 | CaO | MgO | TiO2 | Na2O | BaO | Cr2O3 | ZrO2 | MnO | LOI |
|---|---|---|---|---|---|---|---|---|---|---|---|---|---|---|
| MA | 1.77 | 84.92 | 4.92 | 0.73 | 0.07 | 0.28 | 0.29 | 0.48 | 0.3 | 0.09 | 0.07 | 0.03 | 0.06 | 5.99 |
| MU | 3.37 | 68.76 | 14.61 | 1.43 | 0.02 | 0.45 | 0.48 | 0.41 | 0.21 | 0.03 | 0.03 | 0.02 | 0.02 | 10.16 |
| LI | 11.82 | 47.11 | 26.44 | 0.21 | 0.09 | 0.01 | 0.14 | 2.19 | <0.010 | 0.01 | 0.01 | 0.06 | 0.08 | 11.83 |
Table 3. Composition of major oxides (% by mass) of MA, Mu and LI clays.
The alkaline-earth elements, Ca and Mg are present in all samples. The presence of Ca and Mg are associated to the presence of exchangeable cations. The total content of alkaline elements (Na and K) as Na2O and K2O is <2 wt.%. The content of K2O (values in the range 0.73 to 1.43 wt.%) is higher than Na2O (values in the range <0.01 to 0.30 wt.%). These elements can be associated to the presence of silicates containing K and/or Na in their crystal structures, in particular muscovite as in other studies [26,27]. The relatively high values of Loss on Ignition (LOI) in the MA (6.90%) and MU (9.84%) samples compared to the LI clay sample (11.72%) may be related to the dehydroxylation of minerals or hydrated hydroxides, oxidation of organic matter and decomposition of carbonates.
The concentrations of selected trace elements (As, Cd, Co, Cr, Pb, Se and Zn) obtained from the MA, Mu and LI clays are provided in Table 4. The order of concentrations is Cd <Se<As<Pb<Zn<Co<Cr for MA clay, Cd<Se<Co<As<Pb<Zn<Cr for MU and Cd<As<Se<Pb<Co<Zn<Cr for LI clay sample. The observed concentration for Zn, 88.50 mg/kg, in LI sample is within the range of concentrations of Zn (88-290 mg/kg) as reported by Boisa and Bekee. High concentration of Cr was observed in all samples, ranging from 95.15-441.41 mg/kg. However, Boisa and Bekee reported lower Cr concentrations (52.27-76.21 mg/kg).
|
Heavy metal |
As |
Cd |
Co |
Cr |
Pb |
Se |
Zn |
|
MA |
2.33 |
0.04 |
32.82 |
441.41 |
13.78 |
0.15 |
18.11 |
|
MU |
9.5 |
0.07 |
6.39 |
172.89 |
16.5 |
5.24 |
18.57 |
|
LI |
7.99 |
0.02 |
31.96 |
95.15 |
15.78 |
11.36 |
88.5 |
Table 4. Minor element composition of MA, Mu and LI clays in mg/kg.
Previous studies have highlighted the presence and elevated levels of the metals in clays [28,29]. In the study carried out by Kouadio et al., clays from the Grand-Morie region (Ivory Coast) presented concentrations of Cd (0.05-0.12 mg/kg), Pb (10.60-39.00 mg/kg) and Zn (23-130 mg/kg) within the range of the clays analyzed in this study. The authors also reported high Cr levels (130 to 830 mg/kg) as observed for MA e MU clay samples. The contents of metals As, Cd, Co, Cr, Pb, Se and Zn in these clays can pose a risk to human health due to the fact that these metals can migrate into water and onto food during cooking or heating in pans made from these clays [30]. However, the leaching of these metals from pans will depend on the oxidation state of the metal, pH, type of food, high temperatures of cooking and contact time of cooking [31].
Heavy metals such as As, Cd, Co, Cr, Pb, Se, Zn, among others occur naturally in clay/soil. However, high concentrations of these elements are frequently due to contamination. The main sources of clay contamination by heavy metal include agriculture, domestic and industrial pollution.
Physicochemical characterization
The Cation Exchange Capacity (CEC) is defined as the sum of cations that a mineral can effectively associate under a specific pH condition. This capacity originates from two sources:
The CEC values obtained for MA, MU and LI samples are presented in Table 5. The CEC values of MA, MU and LI clays are 3.00, 5.00 and 6.00 meq/100 g respectively. Based on Kouadio et al., the CEC of kaolinitic clay is within the range 3 to 15 meq/100 g, therefore, all clays samples are well within the range of cation exchange capacity values of a kaolinitic clays. The low CEC values observed in all analysed samples are due to the presence of impurities in the clay, such as quartz. This observation is corroborated by XRD results were all samples showed high quartz content (Table 5).
| Samples | pH | CEC (meq/100 g) | SSA (m2/g) |
| MA | 7.27 | 3 | 23.41 |
| MU | 6.31 | 5 | 39.02 |
| LI | 6.52 | 6 | 46.83 |
Table 5. pH, CEC and SSA values for MA, MU and LI samples.
Table 5 shows that the pH of clay samples was slightly acidic in MU (6.31) and LI (6.52) sample and slightly basic in MA sample (7.27). The pH values, obtained for MU and LI samples are within the range, 4.80-6.90, reported in previously studies. The effect of pH on the CEC of kaolinite is well documented. This author also stated that higher pH leads to a higher CEC values. However, in this study the related trend was not observed, where the MU clays with the highest pH values showed lower CEC. This may again be evidence of the presence of impurities in the clays analyzed. According to Ali Sultan et al., the pH value of clays can influence the leaching of metals due to change in solubility of metal present in the clay leading to their release into the water and food during heating [33]. In general, clays with a more acidic pH have a greater potential to leach metals, while clays with a more alkaline pH tend to have less metal leaching.
The values of Specific Surface Areas (SSA) are also presented in Table 5. The results of MA sample were 23.41 m2/g, 39.02 m2/g for MU sample and 46.83 m2/g for LI sample. Previous studies reported that kaolinitic clays specific surface area ranged from 18.0 to 48.5 m2/g [34,35]. Hence, MU and LI clays specific surface areas are in agreement with those of kaolinitic clays. Although all samples contain the same major clay minerals, LI sample, which is richer in iron content (11.82 wt.%) has a larger surface area (46.83 m2/g) than MA sample. Similarly, tendency was also observed in Sei1 et al., study. According to Eusterhues et al., iron oxyhydroxides contribute strongly to the specific surface area [36]. The SSA value for MU and LI is higher than the range reported by Gupta and Bhattacharyya in kaolinitic clays (3.10 to 18.70 m2/g) [37]. Therefore, we can assume that the clays studied will have interesting adsorption capacities.
Thermogravimetric analysis
Thermograms of clays samples under air atmosphere were examined as shown in Figure 3. DTG-curves shows that all samples presented three mass losses. These observations are in agreement with Snellings et al., statements [38], that three phenomena can be clearly distinguished in thermal analysis curves of clay materials. The first mass loss event ranged from 25 to 150°C with mass loss of 5.80 wt.% for MA, 25 to 170°C with mass loss of 6.80 wt.% for MU sample, and from 25 to 100°C with mass loss of 2.70 wt.% for LI. The peak temperatures were approximately 50°C for all samples. For González-Miranda et al., the first mass loss approximately 50-200°C can be attributed to the dehydration of mechanically retained or adsorbed water (free moisture). The second mass loss event observed in DTG curves ranged from 225-250°C (0.80 wt.%) for MA, 230-253°C (0.9 wt.%) for MU and 200-270°C (3.60 wt.%) for LI sample. According to Snellings et al., the second mass loss event (200-300°C) is related to dehydration process of molecular water that may be adsorbed at the inner surface of minerals. Additionally, Rat et al., also stated that this mass loss can be associated to loss of water molecules from the exchangeable cations, loss of water in the interlayer of silicates or even elimination of water from gypsum (Figure 2).

Figure 2. TG-DTG of samples MA, MU and LI clays.
The differences in the loss and temperature range of the dehydration step for the three samples can be explained by storage conditions, structure and crystallinity of the clay mineral, and nature and abundance of the cations in the interlayer region. The last mass loss event occurs between 352 to 532°C (5.90 wt.%), 352 to 535°C (6.61 wt.%) and 350 to 530°C (7.90 wt.%) for MA, MU and LI clay samples, respectively. For this region DTG peaks are observed at temperatures of 450°C, 460°C and 475°C, respectively. Between 350-950°C clay sample undergo a loss of mass due to dehydroxylation clay minerals. The hydroxyls groups in the clay structure are much more strongly bonded than adsorbed or interlayer water and requires a higher temperature for its removal. Kaolinite is dehydroxylated by heating with the formation of an amorphous phase metakaolinite. Upon heating, hydroxyls are liberated over a broad temperature range as represented by Reaction (1).
R(1)
The OH- represented in Reaction (1) is the structural OH groups of the silicates. An OH- group attracts H+ from its adjacent group and produces H2O as vapour that evolves from the solid phase. The obtained results are consistent with the results reported by González-Miranda et al., showing that the progressive heating of clay samples produces a mass loss in the temperature range 400-800°C being associated to the dehydroxylation of kaolinite, with peak centered at 540°C and formation of metakaolinite. It should be noted that the total weight loss by TG is 12.50, 14.30 and 14.20 wt.% for the samples MA, MU, LI, respectively. This shows that lower kaolinite content is related to lower mass loss (Table 2).
Determination of potentially toxic metals leaching
Figures 4-6 show the As, Cd, Co, Cr, Pb, Se and Zn content due to the leaching of MA, MU and LI clay pot containers (fired at 800°C, 900°C and 1000°C) into water boiled during 3, 4 and 5 h at different cycles. It can be observed that the leached concentration ranges were 0.082 to 0.185 mg/L for As, 0.003 to 0.080 mg/L for Cd, 0.001 to 0.002 mg/L for Co, 0.014 to 0.096 mg/L for Cr, 0.001 to 0.003 mg/L for Pb, 0.003 to 0.027 mg/L for Se and 0.067 to 0.708 mg/L for Zn. In general, Figures 4, 5, and 6 show that amount of metal leached from various clay pots followed the order of 3 h<4 h<5 h (boiling time, BT), 800°C>900°C>1000°C (Fired Temperature, FT), 1st time boiling<2nd boiling<3rd boiling (repetitive use, RU) and MA>MU>LI (clay source, CS). The statistical effect of these variables was evaluated through multivariate ANOVA and its results are presented in Table 6 (Figure 3).

Figure 3. Concentrations of (a) As, (b) Cd, (c) Co, (d) Cr, (e) Pb, (f) Se and (g) Zn leached from MA clay pot to water boiled at 3, 4 and 5h for 3 consecutive cycles.
The As level in heated water for first time (0.117 ± 0.026 mg/L) was significantly (p<0.05) different from second time (0.125 ± 0.027 mg/L) and third time (0.127 ± 0.0271 mg/L) heating. The As leaching showed a significant increase (p<0.05) with an increase in boiling time. However, significant decrease (p<0.05) with an increase in clay pot fired temperature. The As content in heated water is higher than WHO acceptable limit (0.01 mg/L) for drinking water [39], meaning that As leaching from clay pots poses a serious health risk. According to Maobe et al., high concentration As can damage the pulmonary, nervous, renal and respiratory systems, as well as causing skin pathology [40]. It can also induce disorders in the central nervous system, liver, lungs, heart, kidney and brain. It leads to hypertension, abdominal pain, skin rashes, intestinal ulcers and is associated with various types of cancer.
The concentration of Cd leached to water from clays pot when boiled for 3 h (0.016 ± 0.017 mg/L) was significantly (p<0.05) different from that of the water boiled for 4 h (0.013 ± 0.007 mg/L) and 5 h second time (0.014 ± 0.006 mg/L). The Cd leaching showed a significant increase (p<0.05) with a reduced with firing temperature and increased with contact time of boiling. The Cd content in leachate is approximately 50 times higher than WHO acceptable limit (0.003 mg/L) for drinking water. The higher level of Cd in the leachate are of much concern, as Cd is linked to adverse reproductive outcomes, neurological disorders and impaired cognitive development in children [41]. Cadmium has been associated with problems in respiratory pathways, including lung cancer (Figure 4).

Figure 4. Concentrations of (a) As, (b) Cd, (c) Co, (d) Cr, (e) Pb, (f) Se and (g) Zn leached from Mutamba clay pot to water boiled from 3, 4 and 5 h for 3 consecutive cycles.
It can be observed from Figures 4(c), 5(c) and 6(c) the lowest (p<0.05, Table 6) concentration of Co was recorded in the clay pots that were fired at 1000°C (0.0011 ± 0.0002 mg/L). Whereas, the highest concentration was recorded in the 800°C fired clays pots (0.0013 ± 0.0003 mg/L). Additionally, from Table 6 that raw clay source origin and repetitive use of clay pots significantly affected the Co concentration in water (p<0.05). Nevertheless, there was no significant (p>0.05, Table 6) variation in Co concentration between heating duration time. Co is essential in trace amounts for living organisms, mainly in the form of vitamin B12, and is important for the functioning of red blood cells. Although it is not easily stored in the body, consumption of high amounts can cause adverse effects in lungs, heart, and skin. Notwithstanding, the concentration of Co leached into heated water is lower than WHO permissible maximum of 0.01 mg/L, therefore no health risk is inhered Co levels in heated water.
The leaching of Cr from the clay pot produced using Mutamba clay (0.056 ± 0.021 mg/L) was significantly (p<0.05) different from Macupulane clay (0.039 ± 0.015 mg/L) and Lichinga (0.034 ± 0.013 mg/L) clays. The As leaching showed a significant increase (p<0.05) with an increase in boiling time, decrease of clay pot fired temperature and repetitive use. The Cr content in heated water is within WHO permissible maximum limit (0.05 mg/L) for drinking water, meaning that Cr leaching from clay pots from Mucupulane, utam a and Lichinga doesn’t poses a serious health risk in terms of Cr levels. The lead content leaching from clay pot prepared with Macupulane clay (0.0020 ± 0.0008 mg/L) was found to be significantly (p<0.05, Table 6) different from those prepared using Mutamba (0.0017 ± 0.0006 mg/L) and Lichinga (0.0019 ± 0.0007 mg/L) clay. There was also significant (p<0.05) difference in the mean level of Pb among heated water during 3 h (0.0016 ± 0.0006 mg/L), 4 h (0.0018 ± 0.0007 mg/L) and 5 h (0.0022 ± 0.0007 mg/L). The progressive use (long contact time of heating) of clay utensil and fired temperature has a significant on lead concentration lead to water. According to Valadez-Vega et al., lead is considered to be among the most dangerous metals for human health because it affects the central nervous system, causes anemia and gastrointestinal damage, and is associated with alterations in genetic expression. However, the leached Pb level in water heated in clays pots from MA, MU and LI during different conditions are within the WHO acceptable limit (0.01 mg/L) for drinking water. The average concentrations of Se leached for first time (0.0086 ± 0.0034 mg/L) was significantly (p<0.05) lower than second time (0.0115 ± 0.0045 mg/L) and third time (0.0155 ± 0.0062 mg/L) heating. There is also a statistically significant (p<0.05) differences between the Se concentration leached to water during heating in clay pot fired at different temperature and from different sources. The increase in water heating duration, the Se concentration increases significantly (p<0.05) as it can be seen in Table 6. Selenium levels leached to water during all conditions from MA, MU and LI clay sample was lower than WHO acceptable limit (0.01 mg/L) for drinking water. Selenium, which is nutritionally essential for humans in lower concentration, is a constituent of more than two dozen selenoproteins that play critical roles in reproduction, thyroid hormone metabolism, DNA synthesis, and protection from oxidative damage and infection [42,43]. The concentration of Zn leached to water from clays pot when heated for 3 h (0.2189 ± 0.1523 mg/L) was significantly (p<0.05) different from when the water was heated for 4 h (0.2479 ± 0.1702 mg/L) and 5 h second time (0.2744 ± 0.1855 mg/L). From preparation of clay pots the highest concentration of Zn was recorded in the MA clay pots (0.165 ± 0.048 mg/L) followed by MU clay pots (0.455 ± 0.133 mg/L) and lowest was at LI clay pots (0.121 ± 0.035 mg/L). The Zn leaching showed a significant increase (p<0.05) with an increase in fired temperature and long contact time of heating. The Zn content in heated water is much lower than WHO acceptable limit (3 mg/L) for drinking water (Figure 5).

Figure 5. Concentrations of (a) As, (b) Cd, (c) Co, (d) Cr, (e) Pb, (f) Se and (g) Zn leached from Lichinga clay pot to water heated from 3, 4 and 5 h for 3 cycles.
The results showed in Table 6 indicates that clay source has significant effect in heavy metal leach ability to water (p<0.05). For example, at 1000°C in first day, the As content leached to water from clay pot prepared with MA clay (0,128 ± 0,001 mg/L) were significantly higher compared to MU (0,094 ± 0,001 mg/L) and LI (0,089 ± 0,002 mg/L) clays. At this temperature the Co and Pb content leached from LI clay (0.003 and 0.001 mg/L) were significantly higher compared to MA (0.001 and 0.0009 mg/L) and MU (0.0009 and 0.0008 mg/L) clays. On the other hand, the leached content of Cd, Cr, Se and Zn to heated water in 1000°C kilned clays pots were significantly higher in MU clay (0.008, 0.046, 0.009 and 0.348, respectively) (Table 6).
| Heavy metal | Variables | Sum of square | df | Mean square | F-value | P-value |
| As | FT | 0.124 | 2.000 | 0.062 | 330.350 | 0.000 |
| RU | 0.005 | 2.000 | 0.002 | 12.310 | 0.000 | |
| BT | 0.002 | 2.000 | 0.001 | 5.510 | 0.005 | |
| CS | 0.124 | 2.000 | 0.062 | 291.867 | 0.000 | |
| Cd | FT | 0.004 | 2.000 | 0.002 | 19.460 | 0.000 |
| RU | 0.003 | 2.000 | 0.002 | 16.840 | 0.000 | |
| BT | 0.0004 | 2.000 | 0.0002 | 1.990 | 0.139 | |
| CS | 0.004 | 2.000 | 0.002 | 17.063 | 0.000 | |
| Co | FT | 1.00E-06 | 2.000 | 1.00E-07 | 6.390 | 0.002 |
| RU | 1.00E-06 | 2.000 | 1.00E-07 | 4.490 | 0.012 | |
| BT | 1.00E-06 | 2.000 | 1.00E-07 | 3.700 | 0.026 | |
| CS | 1.26E-06 | 2.000 | 6.30E-07 | 6.087 | 0.000 | |
| Cr | FT | 0.021 | 2.000 | 0.011 | 68.290 | 0.000 |
| RU | 0.025 | 2.000 | 0.012 | 78.730 | 0.000 | |
| BT | 0.003 | 2.000 | 0.001 | 7.980 | 0.000 | |
| CS | 0.021 | 2.000 | 0.011 | 40.033 | 0.000 | |
| Pb | FT | 4.00E-06 | 2.000 | 2.00E-06 | 9.850 | 0.000 |
| RU | 5.50E-05 | 2.000 | 2.80E-05 | 130.000 | 0.000 | |
| HT | 1.50E-05 | 2.000 | 7.00E-06 | 34.820 | 0.000 | |
| CS | 4.19E-06 | 2.000 | 2.09E-06 | 4.187 | 0.000 | |
| Se | FT | 0.004 | 2.000 | 0.002 | 375.580 | 0.000 |
| RU | 0.002 | 2.000 | 0.001 | 175.970 | 0.000 | |
| BT | 2.68E-04 | 2.000 | 1.30E-04 | 24.700 | 0.000 | |
| CS | 0.004 | 2.000 | 0.002 | 141.438 | 0.000 | |
| Zn | FT | 5.346 | 2.000 | 2.673 | 995.330 | 0.000 |
| RU | 0.946 | 2.000 | 0.473 | 176.170 | 0.000 | |
| BT | 0.125 | 2.000 | 0.062 | 23.250 | 0.000 | |
| CS | 5.346 | 2.000 | 2.673 | 376.286 | 0.000 |
Table 6. Multivariate ANOVA results for Fired Temperature (FT: 800; 900 and 1000°C), Repetitive Use (RU: 1-3 cycles), raw clay sources origin (CS: MA, MU and LI); Boiling duration time (BT: 3-5 h).
The present study confirmed that boiling duration, frequency of usage, temperature of firing clay pots and raw clay source can affect significantly the leaching of heavy metals into water and food. The obtained results are consistent with previous studies [44]. For these authors the processes of leaching can increase when the cookware is used repeatedly for a longer time. As we can see, the levels of heavy metal leached from clay pots begin with the first heating and increased with further clay pot use in subsequent cycles. Similar trend was obtained by Valadez-Vega et al. The long-time use (repetitive use) of Macupulane, Mutamba and Lichinga clay pots for food cooking, water heating and storage may be a source of heavy metals excessive introduction into human systemic circulation.
Other important factor on heavy metal leaching from clay pot is the firing temperature. It was observed that from clay pots kilned at 1000°C leach less heavy metal to water. This observation is consistent with the findings of a previous study Etim and may be explained by the glassy layer on the pot surface which is formed due to fusion of minerals into a non-crystalline state. The vitreous layer formed during firing can act as a physical and chemical barrier, reducing the leaching of heavy metals into the water during heating. In general, clay pots that have been fired at higher temperatures tend to have a lower rate of heavy metal leaching into the water during boiling compared to unfired clay pots. Clay pot raw materials also significantly contributed to levels of heavy metals in boiled water. According to Snellings et al., kaolinite and quartz are relatively inert mineral, therefore does not readily leach heavy metals into water. Thus, it was expected less leaching effect from MA compared to MU and LI clays. The non-leachability of heavy metals from kaolinitic clays even at increased temperatures and pH conditions has previously been highlighted in Boisa and Bekee. However high level of leaching from clay pots produced with clays rich in kaolinite and quartz were observed in present study. This fact can be explained by the interactions of the various identified factors. The levels of As and Cd in water samples boiled from different clay pots were higher than the WHO maximum permissible limits for drinking water. These high levels are health concern.
Human health risk assessment
The obtained data for EDI, HQ and HI values of water boiled in clay pots from MA, MU and LI samples under different conditions is shown in Table 7. The mean EDI values of heavy metals concentrations in clay pots boiled water, for adults and children were found in the order of As>Zn>Cr>Cd>Se>Pb>Co. EDI values for children were higher compared to adults due to quantity of water consumption (1.7 L/day for adults and 0.7 L/day for children) and the mean body weight (60 kg for adults and 15 kg for children). The obtained EDI values were compared with the corresponding tolerable daily intake. Arsenic estimated the daily intake (Figure 7a) of water boiled in MA, MU and LI clay pots is approximately 5.9, 4.2 and 4.0 times higher than the correspondent TDI values (0.0021 mg/kg bw/day), respectively. Mean EDI values for Cd (Figure 7b) were 1.74 and 1.88, for adults and children respectively, higher than recommended tolerable daily intake (0.0008 mg/kg bw/day) in water boiled in MA and MU clay pots, however, the mean EDI value of Cd in LI clay pots boiled water (0.0004 mg/kg bw/day for adults and 0.0010 for children) was lower than the TDI. The calculated EDI values shows that it is probable that the current level of exposure for As and Cd through boiled water in MA, MU and LI clay pots would pose a health risk in Mozambican population, especially to children under 15 years old. The mean EDI values for Co, Cr, Pb, Se and Zn were much lower than the correspondent tolerable daily intake for the metals in both adults and children, suggesting that the current risk level of these metal is of low concern and therefore negligible (Figure 6).

Figure 6. Estimated the Daily Intake (EDI) values for (a) As and (b) Cd.
As given in the Table 7, the HQ values ranged from 0.89 to 3.95 for As, 0.26 to 3.12 for Cd, 0.15 to 0.62 for Co, 0.02 to 2.00 for Cr, 0.02 and 0.07 for Pb, 0.05 to 0.46 for Se, 0.02 to 0.19 for Zn. The hazard quotient values should be less than 1 [45], therefore Co, Pb, Se and Zn they pose no obvious risk for exposed population from metal leaching through clay pots utensils during water heating and food preparations.
However, HQ values of As, Cd and Cr were above 1, representing a health risk. HQs of five heavy metals in boiled water were summed up to obtain non-carcinogenic Hazard Index (HI). HI equal to or above 1 is considered unacceptable. The HI values obtained for all samples are greater than 1, implying significant non-cancer risk to those who would consume the water boiled in these clay pots even if the pots are a kilned at 1000°C.
Therefore, heavy metal leaching for clay pots is sufficient to cause adverse health effect, particularly in children, when regularly used to water boiling and food cooking. There is a need to raise awareness in communities about the levels of heavy metals in water and food leached from the use of clay pots utensils, especially those handcrafted. Mozambique government and other developing countries should formulate policies to address this issue and regulate artisanal activities in order to prevent the introduction of harmful substances such as heavy metal into human body, that can bioaccumulate and induce a variet of pathologies damaging communit ’s health. ucupulane, Mutamba and Lichinga communities need to be aware about the risk of using clay pots utensils to prepare and store water and food (Table 7).
| Metal | EDI Cd (Adults) × 10-3 | EDI Cd (children) × 10-3 | HQ Cd (Adults) | HQ Cd (children) | ||||||||
| 800°C | 900°C | 1000°C | 800°C | 900°C | 1000°C | 800°C | 900°C | 1000°C | 800°C | 900°C | 1000°C | |
| Macupulane clay pots | ||||||||||||
| As | 8.47 | 7.2 | 6.58 | 19.77 | 16.81 | 15.34 | 1.69 | 1.44 | 1.32 | 3.95 | 3.36 | 3.07 |
| Cd | 1.3 | 0.72 | 0.49 | 3.04 | 1.67 | 1.13 | 1.3 | 0.72 | 0.49 | 3.04 | 1.67 | 1.13 |
| Co | 0.07 | 0.05 | 0.05 | 0.17 | 0.13 | 0.11 | 0.25 | 0.18 | 0.16 | 0.57 | 0.42 | 0.37 |
| Cr | 2.57 | 1.71 | 1.39 | 5.99 | 3.99 | 3.24 | 0.86 | 0.57 | 0.46 | 2 | 1.33 | 1.08 |
| Pb | 0.1 | 0.1 | 0.06 | 0.24 | 0.22 | 0.14 | 0.03 | 0.03 | 0.02 | 0.07 | 0.06 | 0.04 |
| Se | 0.8 | 0.72 | 0.55 | 1.86 | 1.68 | 1.29 | 0.16 | 0.14 | 0.11 | 0.37 | 0.34 | 0.26 |
| Zn | 8.1 | 7.78 | 7.59 | 18.89 | 18.15 | 17.7 | 0.03 | 0.03 | 0.03 | 0.06 | 0.06 | 0.06 |
| HI | 4.32 | 3.1 | 2.58 | 10.07 | 7.24 | 6.01 | ||||||
| Mutamba clay pots | ||||||||||||
| As | 6.13 | 5.13 | 4.72 | 14.31 | 11.97 | 11.01 | 1.23 | 1.03 | 0.94 | 2.86 | 2.39 | 2.2 |
| Cd | 1.34 | 0.85 | 0.53 | 3.12 | 1.98 | 1.23 | 1.34 | 0.85 | 0.53 | 3.12 | 1.98 | 1.23 |
| Co | 0.07 | 0.05 | 0.04 | 0.16 | 0.12 | 0.1 | 0.23 | 0.17 | 0.15 | 0.53 | 0.39 | 0.35 |
| Cr | 0.09 | 0.09 | 0.06 | 0.22 | 0.21 | 0.13 | 0.03 | 0.03 | 0.02 | 0.07 | 0.07 | 0.04 |
| Pb | 0.09 | 0.09 | 0.06 | 0.22 | 0.21 | 0.13 | 0.03 | 0.03 | 0.02 | 0.06 | 0.06 | 0.04 |
| Se | 0.84 | 0.98 | 0.58 | 1.95 | 2.28 | 1.35 | 0.17 | 0.2 | 0.12 | 0.39 | 0.46 | 0.27 |
| Zn | 24.64 | 21.98 | 20.95 | 57.49 | 51.28 | 48.88 | 0.08 | 0.07 | 0.07 | 0.19 | 0.17 | 0.16 |
| HI | 3.1 | 2.37 | 1.84 | 7.23 | 5.52 | 4.29 | ||||||
| Lichinga clay pots | ||||||||||||
| As | 5.74 | 4.88 | 4.47 | 13.39 | 11.38 | 10.44 | 1.15 | 0.98 | 0.89 | 2.68 | 2.28 | 2.09 |
| Cd | 0.69 | 0.38 | 0.26 | 1.61 | 0.89 | 0.6 | 0.69 | 0.38 | 0.26 | 1.61 | 0.89 | 0.6 |
| Co | 0.08 | 0.06 | 0.05 | 0.19 | 0.14 | 0.12 | 0.26 | 0.19 | 0.17 | 0.62 | 0.45 | 0.4 |
| Cr | 2.23 | 1.49 | 1.21 | 5.21 | 3.47 | 2.83 | 0.74 | 0.5 | 0.4 | 1.74 | 1.16 | 0.94 |
| Pb | 0.11 | 0.1 | 0.06 | 0.26 | 0.24 | 0.15 | 0.03 | 0.03 | 0.02 | 0.07 | 0.07 | 0.04 |
| Se | 0.34 | 0.3 | 0.23 | 0.8 | 0.71 | 0.55 | 0.07 | 0.06 | 0.05 | 0.16 | 0.14 | 0.11 |
| Zn | 6.53 | 5.57 | 5.25 | 15.23 | 13 | 12.25 | 0.02 | 0.02 | 0.02 | 0.05 | 0.04 | 0.04 |
| HI | 2.97 | 2.15 | 1.81 | 6.93 | 5.02 | 4.22 | ||||||
Table 7. EDI, HQ and HI values of heavy metals in water boiled in clay pots from MA, MU and LI samples.
The mineralogical characterization by XRD of clays from Mucupulane-Gaza province, Mutamba-Inhambane province and Lichinga-Niassa province (Mozambique), showed that they are constituted mainly by a mixture of clay minerals such as kaolinite, quartz and accessory minerals (microcline, smectite, plagioclase, gibbsite and siderite). The chemical analysis by XRF indicated that silica (47.11 to 84.92 wt.% of SiO2), alumina (4.92 to 26.44 wt.% of Al2O3), were predominant, with medium content of iron (1.77 to 1.77 wt.% Fe2O3). These values are in the range established for kaolinitic clay, which is the main mineral component of analyzed samples. The elemental composition showed that content of essential and harmful heavy metals (As, Cd, Co, Cr, Pb, Se, and Zn) in investigated clays samples is higher than WHO standards for soils. Thermal analysis through TG/DTG curves confirmed that the clays are predominantly kaolinite and approximately 7 wt.% are mechanically retained or adsorbed water. The specific surface area and cation exchange capacity values clearly indicate that all samples are kaolinitic clays. Lichinga clays sample showed the best values for specific surface area (46.83 m2/g) and cation exchange capacity (6 meq/100 g) and lower pH value (6.52) when compared to Mucupulane and Mutamba samples. Leaching of investigated heavy metal into water boiled in clay pots were confirmed. High concentrations above the WHO maximum permissible limits (0.01 mg/L) for As and Cd in drinking water were found in all boiled water samples heated in clay pots produced from Mucupulane, Mutamba and Lichinga clays. The leaching experiments showed that effect of boiling time (cooking duration), kilned temperature, raw clay source and repetitive use of clay pots in heavy metal leaching was significant to the concentration of metals. The Human health risk assessment showed that As, Cd and Cr showed high hazard indices compared with other metals signifying unacceptable non-carcinogenic risk bringing about adverse health effects, for the local community and consumers of the water and food prepared in those pots. Efforts should be directed to inform the community and clay pots producers on the risk to health of using those type of pots.
References
[Crossref] [Google Scholar] [PubMed]
[Crossref]
[Crossref] [Google Scholar] [PubMed]
[Crossref] [Google Scholar] [PubMed]
[Crossref] [Google Scholar] [PubMed]
[Crossref] [Google Scholar] [PubMed]
[Crossref]
[Crossref] [Google Scholar] [PubMed]
[Crossref] [Google Scholar] [PubMed]
[Crossref] [Google Scholar] [PubMed]
[Crossref] [Google Scholar] [PubMed]
[Crossref] [Google Scholar] [PubMed]
[Crossref] [Google Scholar] [PubMed]
[Crossref] [Google Scholar] [PubMed]
[Crossref] [Google Scholar] [PubMed]