Keywords
|
| Tumor, MRIScan, CT Scan,K-Means clustering, Fuzzy c-means |
I. INTRODUCTION
|
| A tumor may be primary or secondary. If it is the origin, then it is known as primary. If the part of the tumor spreads to another place and growson its own, then it is known as secondary. The brain tumor affects CSF (Cerebral Spinal Fluid) and causes strokes. The physician gives the treatment for the strokes rather than the treatment for tumors. So the detection of the tumor is important for that treatment. The life expectancy of the personaffected by the brain tumor will increase if it is detected at an earlier stage. Normally tumor cells are of two types Mass and Malignant. The detection of the malignant tumor is somewhat difficult to mass tumor. For the accurate recognition of the malignant a 3-D representation of brain and 3-D analyser tool is required. This paper focuses on the detection of mass tumor. The development platform for the detection is matlab because it is easy to develop and execute. At the end, we are providing systems that detect the tumor and its shape. |
| An image is an array or a matrix of square pixels (picture elements) arranged in columns and rows. In Image processing,the input is an image, such as a photo or video frame the output of image processing may be either an image or a set of features or parameters related to the image. The techniques for image-processing involve treating the image as a two-dimensionalsignal and then applying standard signal-processing techniques to it. Image processing generally refers to digital image processing, but visual and analog image processing are also possible. The acquisition of images (producing the input image) is referred to as imaging. Digital Image composes of finite number of elements(as picture elements, image elements, pels, and pixels) each havinga particular location and value. Pixel is the most widely used term for denoting the elements of the digital image. Image processing involves varying the nature of an image in order to either to improve its pictorial information for human interpretation or render it more suitable for autonomous machine perception. The image will have ranging from 1 to 256 each and the brightness values also ranging from 0 (black) to 255 (white). A digital image is a collection of a large array of separate dots, each of which has a brightness related with it. |
| In general, radiologists carefully look into medical images, and diagnose a patient’s disease by obtaining useful information and interpreting medical images with their experience, knowledge, and wisdom. For the purpose of attaining a correct diagnosis radiologist need to learn and archive a huge number of cases with various types of diseases in their own mind according to their specialty. A good radiologist does not need to have a particularly good eye but rather a sensible ability to identify precisely what he or she is looking at when looking at medical images. Thus it can be said that good radiologists have high and flexible abilities of learning and pattern recognition. Since CAD systems provide radiologists with a “second opinion” for assisting them in the diagnosis of patient’s diseases it entails the CAD system to have similar abilities as the radiologists in terms of learning and pattern recognition even though good CAD systems cannot reach radiologists’ high diagnostic abilities. Consequently machine learning and pattern recognition techniques are substantially important in developing CAD systems. Pattern recognition is the act of extracting features from some objects in raw data and making a decision based on the classifier output such as classifying each object into one of the possible categories of various patterns. |
II. OBJECTIVE AND MOTIVATION
|
| A number of institutions perform special medical checks for brain, known as “Brain Dock” in Japan, by using forwardthinkingskills like computed tomography (CT), magnetic resonance imaging (MRI) and positron emission CT (PET), because the Japanese are also keen in preventing various neurological conditions including stroke, dementia, etc. It is possible for radiologists to miss the lesions of patients, because of their heavy workloads.Therefore, for detecting the lesions of patients correctly and efficiently, radiologists would need to experience a number of training sessions. In addition, the number of images, which neuro-radiologists have to diagnose, has increased rapidly, because MRI [2] has shifted from two dimensional (2D) imaging to 3D imaging, and the determination as well as signal-to-noise ratio has become developed. Consequently,dueto their heavy workloads in the field of NeuroRadiologyneuro-radiologists have been demanding the new approach of “Computer-Aided Diagnosis (CAD)”.CAD has become one of the major research subjects in medical imaging and diagnostic radiology. The basic concept of CAD was proposed by The University of Chicago, in the mid- 980s, whose idea it was to provide a computer output as a “second opinion” to assist radiologists in interpreting images, so that the accuracy and consistency of radiological diagnosis could be improved, and also the image reading time could be reduced Since then, a number of researchers have developed computer aided diagnostic CAD schemes for detection and classification of various kinds of abnormalities such as micro calcifications and masses in mammograms, pulmonary nodules. |
| In recent years, various kinds of CAD methods have been developed in the euro radiology using MR images. Radiologists expect that CAD systems can improve their diagnostic abilities based on synergistic effects between the computer’s and radiologist’s high abilities by using the information analysis including the medical images. |
III. EXISTING SYSTEM
|
| Image processing is any form, of information processing, in which the input is an image. The existing method is based on the threshold and region growing. At the threshold based segmentation the image is considered as having only two values either black or white. But the bitmap image contains 0 to 255 gray scale values. So it ignores the tumor cells also. In [1]case of the region growing based segmentation it needs more user interaction for the selection of the seed. Seed is nothing but the center of the tumor cells; it may cause intensity inhomogeneity problems. And also it will not provide the acceptable result for all the images. |
| • The regional growing method ignored the spatial characteristics. |
| • Normally spatial characteristics are important for malignant tumor detection. |
| • In [4] thresholding based segmentation the image is considered as having only two values either black or white. This is the main problem of the current system, due to that proposed technique for brain tumor segmentation. |
IV. PROPOSED SYSTEM
|
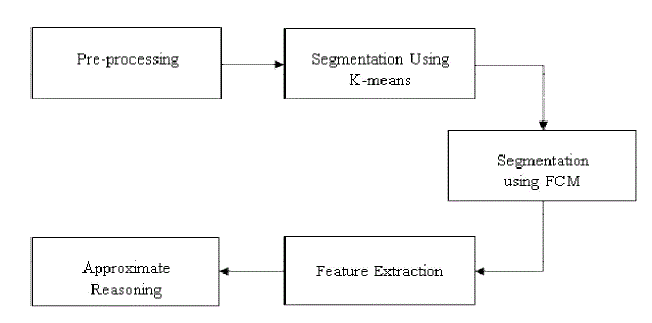
| The proposed system has mainly four modules namely Pre-processing, segmentation using k-means and fuzzy c-means, Feature extraction, and approximate reasoning.According to the need of the next level the pre-processing step converts the image. It performs filtering of noise and other artifacts in the image and sharpening the edges in the image. RGB to gray conversion and Reshaping also takes place here. It includes a median filter for noise removal.The feature extraction is extracting the cluster, which shows the predicted tumor at the FCM (Fuzzy C-means) output. The extracted cluster is given to the threshold process. It applies a binary mask over the entire image. In the approximate reasoning step the tumor area is calculated using the binarization method making the dark pixel darker and white brighter. In threshold coding, each transform coefficient is compared with a threshold and if its less than the threshold value, it is considered as zero or else one. In the approximate reasoning step the tumor area is calculated using the binarization method. That is the image having only two values either black or white (0 or 1). Here 256x256 JPEG image is a maximum image size. The binary image can be represented as a summation of total number of white and black pixels. |
| Pre-processing is done by filtering. Segmentation [1] is carried out by advanced K-means and Fuzzy C-means algorithm. The feature extraction is done by considering the threshold and finally, approximatingthe reasoning method to recognize the tumor shape and position in MRI image using edge detection method. The proposed method is combinations of two algorithms were established for segmentation. But they are not decent for all kinds of the MRI images. |
| • The proposed method is done by filtering. |
| • Noises are reduced. |
| • The proposed method uses k-means and fuzzy c-means algorithms which are very accurate to detect the tumor affected area. |
| • It shrinks the time for analysis. |
| A. Flow Diagram For Proposed Method |
| B. Preprocessing |
| Pre-processing step translate the image, it completes filtering of noise and other artifacts in the image and sharpening the edges in the image. The RGB to grey conversion and Reshaping also takes place here. It includes a median filter for noise deduction. The opportunities of arrival of noise in modern MRI scan [6] are very less. It may reach due to the thermal effect. The aim of this paper is to detect and segment the tumor cells, but for the complete stage it needs the process of noise removal. For better understanding the function of median filter we added the salt and pepper noise artificially and removing it using median filter. |
| C. K-means Clustering |
| A cluster is a collection of objects which are similar between them and are dissimilar to the objects belonging to other clusters. Clustering is an unsupervised learning method which deals with finding a structure in a collection of unlabelled data. A loose description of clustering could be the process of organizing objects into groups whose members are similar in some way. |
| K-means clustering is an algorithm to group objects based on attributes/features into k number of groups where k is a positive integer. The grouping (clustering) is done by minimizing the Euclidean distance between the data and the corresponding cluster centroid. Thus the function of k-means clustering is to cluster the data. |
| D. Fuzzy C-means Algorithm |
Fuzzy c-means (FCM) is a method of clustering [5] which allows one piece of data to belong to two or more clusters.The Fuzzy C-Means (FCM) clustering algorithm was first introduced by Dunn and later was extended by Bezdek. The algorithm is an iterative clustering method that produces an optimal c partition by minimizing the weighted within group sum of squared error objective function  |
| where X = {x1, x2, ãÃÆûãÃÆûãÃÆû, xn} ⊆Rp is the data set in the p-dimensional vector space, n is the number of data items c is the number of clusters with 2 ≤ c < n, uik is the degree of membership of xk in the ith cluster q is a weighting exponent on each fuzzy membership vi is the prototype of the centre of cluster id2 (xk, vi) is a distance measure between object xk and cluster centre vi. Theresult of the object function JFCM can be obtained via an iterative method, which is carry out as follows |
 |
 |
| E. Fuzzy C-Means Segmentation |
| The fuzzy logic is a way of processing the data by giving the partial membership value to each pixel in the image. The membership value of the fuzzy set is ranges from 0 to 1. Fuzzy clustering is basically a multi valued logic that allows intermediate values member of one fuzzy set can also be members of other fuzzy sets in the same image. There is no abrupt transition between full membership and non-membership. |
| The membership function defines the fuzziness of an image and also to define the information contained in the image. These are three main basic features involved in characterizing by membership function. They are supported Boundary. The core is a full member of the fuzzy set. The support is a non-membership value of the set and boundary is the intermediate or partial membership with value between 0 and 1. |
| 1) Mathematical Representation |
| Fuzzy c-means (FCM) is the clustering algorithm which allows one piece of data may be a member of more than one cluster. It is based on reducing the following function |
| Where, |
| m- any real number greater than 1, |
| Mij - degree of membership of X; in the cluster j, |
| xi - data measured in d-dimensional, |
| Rj - d-dimension center of the cluster, |
| The update of membership Mij and the cluster centers R are given by: |
 |
| F. Feature Extraction |
| The feature extraction is extracting the cluster, which shows the predicted tumor at the FCM (Fuzzy C-means) output. The extracted cluster is given to the threshold process. It applies a binary mask over the entire image. In the approximate reasoning step the tumor area [6] is calculated using the binarization method. It makes the dark pixel become darker and white become brighter. Each transform coefficient is compared with a threshold in threshold coding. If it is smaller than the threshold value, then it is taken as zero. If it is larger than the threshold, it will be taken as one. |
| The thresholding method is an adaptive method where only those coefficients whose magnitudes are above a threshold are retained within each block. Let us consider an image ‘f ‘that have the k gray level, an integer value of threshold T, which lies in the grayscale range of k. The thresholding process is a comparison were each pixel in 'f 'is compared to T. Based on which, binary decision is carried out. That defines the value of the particular pixel in an output binary image. |
 |
| G. Approximate Reasoning |
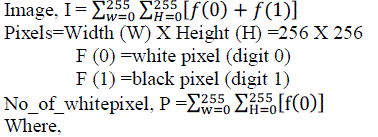
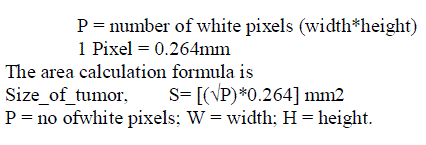
| In the approximate reasoning step the tumor area is calculated using the binarization method. That is the image having only two values either black or white (0 or 1). Here 256x256 JPEG image is a maximum image size. The binary image can be represented as a summation of total number of white and black pixels. |
 |
 |
V. CONCLUSION
|
| There are different types of tumors available. They may be mass in the brain or malignant over the brain. Suppose if it is a mass, then K- means algorithm is enough to extract it from the brain cells. If there is any noise present in the MR image it is removed before the K-means process. The noise free image is given as input to the k-means and tumors are extracted from the MRI image. The performance of brain tumor segmentation is evaluated based on K-means clustering. Dataset consists of Magnetic Resonance Imaging (MRI) size of 181X272. The MRI image dataset that we have utilized in image segmentation technique is taken from the publicly available sources. This image dataset consists of 40 brain MRI images in which 20 brain images with tumor and remaining brain images without tumor. The brain image dataset is divided into two sets. Training dataset and testing dataset. Thus, the pre-processing is done by filtering. Segmentation is done by advanced K-means algorithm and fuzzy c means algorithm. Feature extractions is done by threading and finally, approximate reasoning method to recognize the tumor shape and position in MRI image using edge detection method. This method scans the RGB or grayscale, converts the image into binary image by binarization technique and detects the edge of tumor pixels in the binary image. Also, it calculates the size of the tumor by calculating the number of white pixels (digit 0) in binary image. The stage of the tumor is based on the area of tumor. |
Figures at a glance
|
 |
| Figure 1 |
|
| |
References
|
- A.R.Kavitha, Dr.C.Chellamuthu, Ms.KavinRupa, âÃâ¬ÃŸAn Efficient Approach for Brain Tumour Detection Based on Modified Region Growing and Networkin MRI Images”,Information Forensics and Security, IEEE Transactions on, Vol.9 (2), May 2012.
- Wen-Liange, De-Hua Chen, Mii-Shen Yang, âÃâ¬ÃŸSuppressed fuzzy-soft learning vector quantization for MR Segmentation”, Elsevier Ltd, Vol 52, Issue 1,Pag: 33-43, May2011.
- R.B.Dubey, M.Hanmandlu, Sr.Member, ShantaramVasikarla, âÃâ¬ÃŸEvaluationof Three Methods for MRI Brain Tumor segmentation”, IEEE Digital ObjectIdentifier: 10.1109/ITNG.2011.92,2011.
- Shaheen Ahmed, Khan M.Iftekharuddin, âÃâ¬ÃŸEfficacy of Texture, Shape and Intensity Feature Fusion for Posterior Fossa Tumor Segmentation InMRI”,IEEE Vol (2), pag: 206-13, Mar 2011.
- David Rivest-Henault, Mohamed Cheriet,âÃâ¬ÃŸ Unsupervised MRI segmentation of brain tissues Using a local linear model and set”, Elsevier,Vol 29, Issue 2, pag.243-259, Mar2011.
- Vida Harati, RasoulKhayati, AbdolrezaFarzan, âÃâ¬ÃŸFully automated tumor segmentation based on animproved fuzzy connectedness Algorithm in BrainMR Images”, Elsevier Ltd,Vol 7, pag: 483-92, May 2011.
- Ali Gooya, George Biros Christos Davatzikos, âÃâ¬ÃŸAn EM Algorithm for BrainTumorImagesRegistration: A Tumor Growth Modling Based Approach”, IEEE,Vol 2, pag: 375-90, May 2010.
|
BIOGRAPHY
|
| ALAN JOSE received B.E degree in Computer Science and Engineering from Annamalai Institute Of Technology in May2012 and pursuing M.TECH degree in Computer Science and Engineering from Hindustan Institute Of Technology And Science. His Research interest is in Image Processing andNetwork Security. |
| S.RAVI is an Assistant Professor in the Department of Computer Science and Engineering in Hindustan Institute Of Technology And Science. He has 14 years of experience in teaching field. He finished hisPG from Anna University. His area of Interest is Data mining And Data Warehousing. |
| M.SAMBATH is an Assistant Professor in the Department of Computer Science and Engineering in Hindustan Institute Of Technology And Science. He has 12 years of experience in teaching field. He finished hisPG from Anna University in 2008 and UG in 2001 at VIT. His area of Interest is Image processing. |