Research & Reviews: Journal of Material Sciences
ISSN:2321-6212
ISSN:2321-6212
Belete Baye1*, Tamrat Tesfaye1,2
1Department of Textiles, Ethiopian Institute of Textile and Fashion Technology, Bahir Dar, Ethiopia
2Department of Chemical Engineering, University of KwaZulu-Natal, Durban, South Africa
Received: 02-Mar-2022, Manuscript No. JOMS-22-55785; Editor assigned: 04- Mar-2022, PreQC No. JOMS -22-55785 (PQ); Reviewed: 16-Mar -2022, QC No. JOMS -22-55785; Revised: 18-Mar -2022, Manuscript No. JOMS -22-55785 (R); Published: 25- Mar-2022, DOI: 10.4172/2321-6212.10.3.002.
Visit for more related articles at Research & Reviews: Journal of Material Sciences
Natural fibers are of the good substitute sources for swaing synthetic fibers and reinforcing polymer matrices because of their contributions in maintaining of ecology, low energy requirement for processing and sustainability. The aim of this study is to characterize new fiber from Cyperus Dichrostachus A. Rich (CDA) plant. The CDA plant is a perennial non woody grass found in Ethiopian high lands and river basins. The fiber from this plant has chemical composition of Cellulose (60.27%), hemicellulose (22.72%), lignin (16.59%) contents. It has a density of 1010 kg/m3 and good tenacity behaviour of 105.76 cN/Tex with low elongation of 4.88%. The thermal stability of Cyperus Dicrostachys A. Rich fiber (CDAF) was studied using TGA and DTG analysis and revealed that the cellulose degraded at a temperature of 377.1°C. Fourier transform-infrared spectroscopy analysis confirmed that CDAF is rich in cellulose content. Additionally, CDAF can play a vital role as new reinforcement material and best alternative in bio composite industries. This will give competitive advantages when evaluated with other natural fibers reveals that there are significant potential benefits in implementation of cleaner production in textile material production industries. Specifically, replacement of synthetic fiber source with renewable biomass will reduce the environmental impact of these fibers. The future study will entail on investigating the possible valorization route especially in paper board, composite reinforcement and bio composite alications.
Lignocellulosic fiber; Chemical composition renewable biomass; Cellulose; Fibers
It has been obvious that numerous natural plants have been grown in different provinces of the world with fluctuating atmospheric conditions, grown in agricultural domains and after their lifetime, end up in landfills[1,2],Some other plants have grown wild and spread around forest areas like CDA by their nature, some possess pharmaceutical properties, and others yield edible components[3].
Currently, perhaps, there have been many research works being put out recalling natural fibers in different alication areas. Most research works ended with plant fibers as reinforcement in polymer matrices, home furnishings, and construction technology. They utilized even in aarel manufacturing alications. Yet, it is still obligatory to search and characterize, and add values on their current alications, with different modification techniques. Now days, new natural fibers [4-11] for multidisciplinary alications in reinforcements [12,13], automotive engineering and packaging alications are utilized.
Starting from the 1980`s several natural fibers[14] including coir[15,16], sisal[17-20] pineale[21-24], jute[25-28], hemp[29,30], palm[31-33], banana[34-37], and other fibers have been characterized and employed for many alications just like reinforcement in polymer matrix of composites.
Ethiopia can nurture a diversity of naturally fiber-forming plants. One of the most common plant that is currently grown commercially and could be of interest for handcrafting, packaging and traditional equipment is Cyperus Dichrostachus A. Rich) plant (CDA)[38-41]. It is just a tough plant, traditionally used for the weaving of huts, mats, and baskets in Ethiopia and different countries in Africa [42,43]. It has a decorative nature used to weave baskets, sleeping and sitting mats, rolled twines, more traditionally cereal and crop baskets, food baskets, crop and powder filters, covering equipment for cooking devices and other home aaratus.
Yet, apart from traditional craftworks, there are no research works done on this plant regarding the characterization and modification of its intrinsic properties. Therefore, adaptation of this fiber into valuable goods was the motivation of this research work with technologies employed to transform into beneficial products with characterized physical, mechanical, and chemical properties of the fiber. Most of these distinctive features were determined throughout the progress of the plant and successive fiber drawing out or extraction stages. The paper investigated the physical, morphological, chemical, thermal, and mechanical properties of CDA fiber with detailed scientific justifications.
Because, Even though there are trends in using and utilizing of CDA plants for different alications in different literatures, no one has tried to extract and characterize this plant for fibrous alications especially for textile and composite manufacturing alications. Therefore, the aim of this research work was at studying and characterizing CDA plant fibers for different alications as reinforcement for composite manufacturing, basketry, carpet making and in textiles based on the inherent characteristics.
Materials
CDA plants: Well matured CDA grass fibers as shown in Figure 1 that have been used for this study were collected from Chiss Abay around the Blue Nile River, Bahir Dar, Ethiopia and extracted its stem for characterization.

Figure 1: Non woody CDA stems.
Methods
Extraction methods: The CDA fibers are extracted at optimum extraction process by considering four influencing factors of 1.7% NaOH, 30âÃâÃÆ temperature, 6:1 MLR and 90-minute extraction time. The experimental design was done with Response surface methodology by Central Composite Design (CCD) employing the multivariate aroach was used to design the experiment as well as to do the analysis of the results. Least Significant Difference (LSD) method was used for further evaluation of the effect of extraction methods that ranks the means and calculates the minimum value to be significantly different with each other at p ≤ 0.05. From the ANOVA tables, fit summary, signal-to-noise ratio value, Predicted R² value and diagnostic plots, the significance of the models were checked and finally, the optimized factors were determined and rework of extraction at the optimized extraction technique was done.
Characterization methods: In order to determine the suitability of using extracted CDA fiber as a renewable fiber source for the production of high-value materials, it was important to understand their physical and chemical properties. In this section methods of such comprehensive characterization are reported.
Physical properties: The characterizing of physical properties of the fiber was characterized well after the extraction process as described by the following sections.
Fiber density: The density of the CDA fiber was measured using a liquid pycnometer and the chemicals used were distilled water, paraffin and acetone. Five replicates were performed for each sample type and the density was calculated using equation (1) as per ASTM-D1577–01, 2005 standard (Arbelaiz et al., 2005)
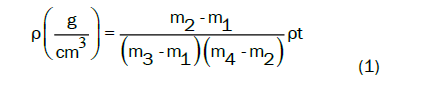
Where ρt=is the density of distilled water (g/cm3), m1=is the mass of empty pycnometer (g), m2=the mass ofpycnometer with fibers (g), m3=the mass of pycnometer with distilled water (g) and m4=the mass of pycnometer with fibers and distilled water (g)[44].
Optical microscopic analysis: The aspect ratio, shape of the fiber, and diameter of the fiber were measured using optical microscope. For fiber diameter analysis, thirty five distinct fiber samples have been considered; and from the microscopic images were taken along the longitudinal direction [45]. The diameter was measured by the microscope built with video analyzer and camera. After calculating the average value of diameter, the diameter of extracted CDAF was compared with various plant fibers.
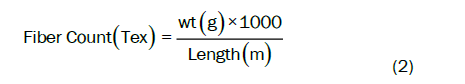
Linear density: The count of the extracted fibre was calculated in Tex units and measured by single-fiber weighing method through which the length of a single fiber was measured and the fiber was weighed as per the ASTM D 2257 standard. Then linear density (Tex) was estimated using equation (2) to compare the fineness of the extracted fiber with other plant fibers.
Diameter: The diameter of CDA fibers obtained from the single cells was studied using an optical Microscope, built in video analyser LEIKA to measure the thicknesses of the single fibers as per the ASTM D3171 (1990) standard. Statistical analysis was done to compare the fiber diameter between CDAF and other fibers [45].
Tensile test: The tensile test was carried out using FAVIMAT+FIBRE TEST machine as per the ASTM D 3822-07 standard. The test was performed with the fiber samples of gauge length value 20 mm on the normal room temperature environment with 65% relative humidity at a cross head speed of 20 mm/min. Twenty samples were tested and their average value has been noted as the nominal tensile strength value of the fiber[45].
Estimation of moisture regain and moisture content: Moisture regain of CDA fiber was measured according to the ASTM D 1776/D1776M-16 as shown in equation (3 and 4). The samples were kept in humidity chamber at 65% RH and room temperature for a set period of time and by oven drying the fibers at 105°C. The moisture regain was calculated as the ratio of the amount of water absorbed to the dry weight of the sample and the moisture content calculated as the ratio of the amount of moisture absorbed by the fiber to the original mass of the fiber before oven drying.
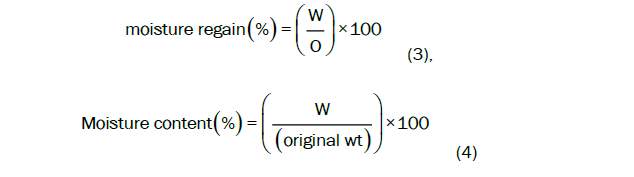
Where; W=Weight of water in the fibers (g); O=oven dry fiber weight (g)
Thermal property analysis: A thermo-gravimetric Analyzer, TGA 4000 Perkin Elmer machine was used to measure the degradation characteristics, the mass and transformation of CDAFs in nitrogen atmosphere with flow rate of 20 ml/min [44,46,47]. All the measurements were examined with aluminum crucible[48] for good coupling between the sample and the temperature measured by the thermocouple in a temperature range from 30°–700°C at a heating rate of 20âÃâÃÆ/min.
Analysis of chemical composition: Chemical analysis was performed to determine the contents of cellulose, hemicellulose lignin, wax, moisture, and ash of CDAFs by following conventional chemical analysis techniques as stated in Figure 2[49,50]. Chemical analysis of the extracted CDAF was performed by adapting TAI methods [51,52] .

Figure 2: Schematic representation of chemical analysis of CDA fiber.
Estimation of lignin content: The TAI T222 method [53] was used with pre-hydrolysis of the extracted sample with 72 wt. % sulfuric acid at room temperature for 2 hrs to determine the content of acid-insoluble lignin [51, 54,55]. Then the concentrated acid was diluted with distilled water, and the sample was hydrolyzed with dilute 3% acid at boiling temperature for 4 hrs. Thereafter, the acidic dispersion of lignin was filtered through filter paper having average pore size of 11 μm. The residue of lignin was washed on the filter with hot water up to neutral pH followed by drying at 105°C to constant weight. Accordingly the extracted CDAF sample 3 g was mixed with 150 mL of 72 % sulfuric acid in 500-ml flask and pre-hydrolyzed at room temperature for 2 hrs [55]. The concentrated acid was diluted with 3450 mL distilled water and the sample was hydrolyzed with dilute acid on a heating plate at boiling temperature for 4 hours using flask beakers. After cooling at room temperature for 30 min, the acidic dispersion of lignin settle overnight and the liquid phase becomes transparent.
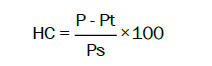
The sediment of lignin was washed with hot water and with distilled water to a neutral media, separating the liquid phase from lignin by sedimentation followed by filtration with a filter paper. The washed lignin was dried with aluminum sheet at 105°C to constant weight. The percentage of acid-insoluble lignin [56] in the extracted fiber sample was calculated by the equation [54,57]:

Where P is weight of dry acid-insoluble lignin with Aluminum sheet; Pt. is weight of empty aluminum sheet; and Ps is weight of extracted and dried CDAF sample.
Estimation of cellulose and hemicellulose content: The determination of cellulose and hemicellulose was based on the separation of holocellulose which contain both cellulose and hemicelluloses. First the extracted CDAF sample, 2 g, was placed into 200 ml flask, and then160 mL distilled water, 2.0 g sodium chlorite (NaClO2) and 4 mL glacial acetic acid were added into the flask. The flask was covered with Petri dish and put into a water bath with a temperature of 90°C and treated for 1 hr though magnetic stirring. Then to the flask an additional portion of 2.0 g sodium chlorite and 4 ml acetate buffer was added, and the treatment was continued again for an hour. After cooling at room temperature for 45 min, a dispersion of holocellulose was poured out into 500 mL beaker and settled overnight. The sediment of holocellulose was washed with hot water, and finally with distilled water up to a neutral pH, separating the liquid phase from holocellulose by sedimentation overnight. The washed holocellulose was dried in the Aluminium sheet at 105°C to constant weight. Then the percentage of holocellulose in the extracted CDAF was calculated by equation 6 [57]:
Where P is weight of dry holocellulose together with aluminium sheet; Pt. is weight of empty aluminium sheet; and Ps is weight of extracted and dried CDAF sample [53,54]. Then the content of cellulose was achieved from holocellulose hydrolyzed with dilute hydrochloric acid to remove hemicelluloses based on the TAI T201 wd-76 and TAI T 9, wd-75 standards (Effland, 1977; Macmillan et al., 1952; Sluiter, 2008; Reaffirmed, 2006; Loelovich, 2015; Pleitner et al., 2019).
The dried holocellulose sample was mixed with 180 mL of 2% HCl in 500-ml flask, and the sample was hydrolyzed with the dilute acid at boiling temperature for 2 h followed by cooling at room temperature for 30 min. then the acidic dispersion of cellulose was segmented overnight for 1 hr. The sediment of cellulose was washed with hot water, and finally with distilled water to a neutral pH, monitored by separating the liquid phase from cellulose by sedimentation and filtration with a filter paper. Then the cellulose was dried in aluminum sheet at 105°C to constant weight. The percentage of cellulose and hemicelluloses in the extracted CDAF was calculated as cellulose(C) and hemicellulose (H) in the extracted CDAF respectively in equation (7 and 8):
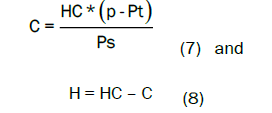
Where HC is percentage of holocellulose; P is weight of dry cellulose together with flask; Pt. is weight of empty flask; and Ps is weight of extracted and dried biomass sample.
Fourier Transform Infra-Red (FTIR) spectroscopy: FTIR Spectrometer, Spectrum (Perkin Elmer) was employed to identify the functional groups present in the CDA fibre [46,58]. The sample was compressed using a mechanical pressure pellet maker for 1 minute at 65 kg/cm2 pressure condition to form pellets of small sizes. The spectrum was recorded in the range of 4000 to 400 cm-1 with 32 scans per minute and with the resolution of 4 cm-1.
Results and Discussion
Physical properties
Diameter: The diameter of the fiber was found to 9.85 ± 7.16 µm (Table 1 and Figure 3). The fibers exhibited non-uniform diameter from end to end indicates that the non-uniformity of fiber girth thickness may affect the spin ability and flexibility of the fiber in end use alications
| Parameter | Results for the extracted fiber |
|---|---|
| Diameter (µm) | 9.85 ± 7.16 |
| Strength(cN/Tex) | 247 ± 87.68 |
| Moisture regain (%) | 12.83 ± 1.99 |
| Linear density(g/km)(tex) | 0.51 ± 0.244 |
| Fiber density (g/cm3) | 1.22 ± 0.52 |
| Elongation (%)(single test) | 7.75 ± 1.84 |
Table 1. Physical properties of CDAF

Figure 3: Fiber diameter under optical microscope.
Tensile strength: The bundle test results showed that the tensile strength of 140.55 CN and elongation 3.6% has greater resistance against tensile loading and exhibited higher tensile properties. The fiber has high number of OH-groups in the fiber that gives additional strength and elongation for the fiber. On the other hand the tensile strength of a single CDA fiber was found to be 105.76 ± 87.68 cN/Tex with 8.95 ± 2.64% of elongation for each individual test. As compared to the tensile strengths of other fibers like flax (88-1500 Mpa), Hemp (550-900 Mpa), jute (400-800 Mpa), kenaf (240-600 Mpa), and nettle (650-1594 Mpa), CDAF has better strength for varied alications.
Fiber density: The fiber density was found with 1010 kg/m3. Density measurement was given equal importance to the mechanical property study since it highlights the natural fibers from synthetic fibers. From this fact, we can understand that the fiber has lightweight for different home furnishing alications, composites and roof layering. The density of the new fiber was comparable with other natural fibers obtained from Bagasse (1200 kg/m3), Coir (1250 kg/m3), Jute (1300 kg/m3) [45], Cyperus pangorei (1102 kg/m3), and Bamboo 600-1100 kg/m3) [59,60]. When compared with other natural fibers; the density of the CDA fiber was less than that of Banana fiber (1350 kg/m3), pineale leaf fiber (1400 kg/m3), Kenaf fiber (1310 kg/m3), Cotton fiber (1600 kg/m3), sisal (1330 kg/m3), Flax (1400 kg/m3), and higher than Coconut (800 kg/m3), and palm fibers (920 kg/m3) [45,61,62] as shown in Table 2.
| Fiber | Tensile strength | Young's modulus (GPa) | Density (g/cm3) | Elongation at break % |
|---|---|---|---|---|
| Flax | 88-1500 | 60-80 | 1.4 | 1.2-1.6 |
| Hemp | 550-900 | 70 | 1.48 | 1.6 |
| Jute | 400-800 | 30-Oct | 1.46 | 1.8 |
| Ramie | 500 | 44 | 1.5 | 2 |
| Coir | 220 | 6 | 1.25 | 15-25 |
| Sisal | 600-700 | 38 | 1.33 | 3-Feb |
| Cotton | 400 | 12 | 1.51 | 10-Mar |
| Kenaf | 295 | - | 1.2 | 2.7-6.9 |
| Bagasse | 20-290 | 19.7-27 | 1.2 | 1.1 |
| Pine ale | 170-1672 | 82 | 1.5 | 3-Jan |
| Banana | 355 | 33.8 | 1.35 | 53 |
| Coconut | 131-175 | 13-Apr | 0.8 | 15-40 |
| Borassus | 65.2 | 4.918 | 47.2 | |
| Piassava | 134-142 | 1.07-4.59 | 6.4-21.9 | |
| Bamboo | 503 | 35.91 | 0.6-1.1 | 1.4 |
| Palm | 97-196 | 2.5-5.4 | 0.92 | 2-4.5 |
| Nettle | 650 | 38 | 1.7 | |
| Cyperus pangorei | 196 ± 56 | 11.6 ± 26 | 1.102 | 1.69 |
| CDAF | 951.84 ± 789 | 106.35 | 1.01 | 4.88 ± 2.64 |
Table 2. Comparison table of physical and tensile properties of CDAF with other natural fibers [45,46,60,63].
Longitudinal analysis of the fiber: The longitudinal interface of the fibre under a Microscope, built in video analyser LEIKA [58] showed that the fibre has some convolutions and twisted structures along its length with smooth, uniform and good aearance as illustrated in Figure 4. The convolutions outfit for comfortable and comparable characteristics of the fiber as in cotton.

Figure 4: Longitudinal view of the fiber.
Moisture regain: The moisture regain of CDAF was 12.40 ± 1.75% and the moisture content was 11.01 ± 1.38%. CDA fiber has a good and comparable moisture property like other natural fibres. The comparison of the physical properties and tensile properties of CDAF with other few natural fibers is presented in Table 2.
Thermo gravimetric analysis: It is obvious that natural fibers encompass cellulose, hemicellulose, and lignin, by which their amount contributes for the thermal stability of the fibers. Consequently, the degradation temperatures of these components of CDA fiber play a noteworthy role to assess the thermal stability of its constituents. Moreover, the thermal stability of the CDA fiber components was studied to estimate the oortunity of its alication as reinforcement in composite and other manufacturing sectors. The Thermo Gravimetric Analysis (TGA) and Derivative Thermo Gravimetrics (DTG) of CDA fiber is shown in Figure 5. The initial degradation of the fiber is noticed (at 82.2°C) between room temperature and 109°C; this was due to the dehydration of the fiber [64]. The succeeding foremost degradation evolved from the temperature region of 110-410.5°C in which a peak quite close to 167.6°C related to thermal depolymerisation of hemicelluloses, and some fraction of cellulose and lignin components[65] with 22.9% of mass loss. Hemicellulose started its decomposition easily, with the weight loss mainly haened at 220–330âÃâÃÆ [65]. A precise noticeable peak at 377.1°C revealed a major mass loss of about 66.3% due to the breakage of glycoside bonds of cellulose and alpha and beta alkyl ether linkages of lignin (Kommula et al., 2016) lead to the degradation of cellulose. Similar results were also observed at 331.1°C for Prosopis juliflora, 321°C for bamboo, 308.2°C for hemp, 298.2°C for jute and 309.2°C for Kenaf fibers[63].

Figure 5: Thermogravimetrics of HWECDA fibers TGA (a) and DTG vs TGA (b).
Figure 5 show that there is little difference only in % mass loss rate of the CDA fiber. This shows that part of the foreign matter and organic components have been removed by the alkali treatment and increase the percent loss and contribute for some amount of mass loss rate in the fiber.
Moreover, the differential thermo gravimetric (DTG) curve contributes a more complete determination of temperatures of the onset and termination of the peak about temperature of the maximum rate of combustion reaction of the fiber [66]. From the analysis of the DTG curve of CDA fiber, it has shown that after moisture removal from the sample, the primary decay peak was in the temperature range of 268.2-410.5°C (the maximum at 377.1. °C) that corresponds to the thermal destruction of cellulose components [67].
The second peak was positioned within the range of 410.5-607.5°C with the maximum at 486.9°C that follows the maximum rate of lignin thermal destruction [68,69]. Therefore, from the DTG curve it can be justified that the fiber has more amount of cellulose than hemi-cellulose and lignin components. The summary is shown in Table 3.
| Temperature/peaks | Stage of degradation | Degraded/decomposed Component | Reference |
|---|---|---|---|
| Between room temperature and 109°C | Initial degradation of the fiber (at 82.2°C) | Dehydration of moisture present in the fiber (11.2 %) | [70] |
| 110°-410°C | Thermal depolymerisation | Hemicelluloses, and some fraction of cellulose and lignin components | [65] |
| 220–330âÃâÃÆ | Decomposition | Loss (22.9%) of Hemicellulose | [65,71] |
| 377.1°C | Breakage of glycoside bonds of cellulose α and β aryl-alkyl-ether linkages of lignin | Degradation (57.1%) of cellulose | [70,72] |
Table 3. Summary of TGA result.
Analysis of chemical composition
The chemical composition of CDAF is presented in Table 4. CDAF has estimated cellulose content of 60.27 ± 9.3% which is higher than that of kenaf (53.14%), Bamboo (26-43%), Wheat straw (51%), Coconut tree leaf sheath (27%), Piassava (28.6%), and Kudzu (33%), Sea grass (57%. The CDAF has 22.72 ± 9.61% of hemicellulose, which is greater than Flax (18.6-20.6%), Ramie (13-16 %), Hemp (15– 22.4), Bamboo (30%), Wheat straw (15-31%), Coconut tree leaf sheath (14%), Piassava (25.8%), sisal(12%), Prosopis juliflora (16.14%), and less than Napier grass strands (31.27%) [45, 57, 61, 62].
The above Figure 6 shows that there is a significant difference in chemical composition of the CDA plant before extraction and the chemical composition of the extracted fiber. This shows that part of the lignin and hemicellulose components have been removed by the alkali treatment and increase the number of OH groups and contribute for the high amount of cellulose in the fiber.

Figure 6: Chemical composition of CDA plant before and after extraction of the fiber.
As shown in Table 4; CDAF contains optimum hemicellulose (22.72 ± 0.32%) and high lignin (16.59 ± 0.32%) contents. The optimum hemicellulose content has given good contribution for biodegradation, moisture absorption, and thermal decay of the fibre [73]. Higher ranges of lignin help to retain water within the fiber, which safeguards the fiber from biological attacks [61];
| Cellulose (%) | Hemicellulose (%) | Lignin % | Extractives (%) | Ash% | Moisture content % | |
|---|---|---|---|---|---|---|
| CDA plant | 48.12 | 27.36 | 21.53 | 3.05 | --- | 2.88 |
| CDA fiber | 60.27 ± 9.3 | 22.72 ± 9.61 | 16.59 ± 0.32 | 1.55 ± 0.003 | 1.3 | 11.01 ± 1.38 |
Table 4. Chemical composition of CDA before and after extraction.
Furthermore CDA fiber has 1.55±0.003% extractives of wax and pectic substances which comprises less portion of wax content that enhance easier composite production for the fact that the bond between the matrix and the fiber become higher for fabricating of the composite structures with this fiber. When compared with other natural fibers just like Flax (1.5-1%), Sisal (2%), Nettle (3.1–4.2%), Okra (3.9%) and Abaca fibers (3%) have comparably higher percentages of wax content than CDAF which has 1.55% of wax. The lesser percentage of wax enables chemical treatment, and it can also afford an improved cohesive bonding between the fiber and composite matrix [55].
The ash content (1.3%) of CDAF was found to be lower when compared to other natural fibers like Cyperus pangorei (3.56%), Prosopis juliflora (5.2%). The data showed that lighter composites can be prepared by using CDAF in polymer matrices. CDA fiber has similar properties in composition with Cyperus pangorei fibers of (68.5% cellulose, 17.88% lignin, 0.17% wax, 9.19% moisture content and 1102 kg/m3 density [64].
More importantly the chemical composition of the CDAF has compared with different plant fibers as shown in Table 5 and revealed that the fiber has comparable chemical composition in all aspects.
| Fiber | Cellulose (%) | Hemi Cellulose (%) | Lignin(%) | Wax(%) |
|---|---|---|---|---|
| Bamboo | 26-43 | 30 | 21-31 | ---- |
| Ramie | 76 | 15 | 1 - 8.0 | ---- |
| Flax | 71 | 18.6-20.6 | 2.2 | 1.5 |
| Kenaf | 72 | 20.3 | 9 | ---- |
| Jute | 61-71 | 14-20 | 13-Dec | 0.5 |
| Cotton | 82.7 | 5.7 | ---- | ---- |
| Hemp | 68 | 15 | 10 | 0.8 |
| Ramie | 68-76 | 13-16 | 0.6-0.7 | 0.3 |
| Abaca | 56-63 | 20-25 | 9-Jul | 3 |
| Sisal | 65 | 12 | 9.9 | 2 |
| Coir | 32-43 | 0.15-0.25 | 0-45 | ---- |
| Wheat Straw | 38-45 | 15-31 | 20-Dec | ---- |
| Rice husk | 35-45 | 19-25 | 20 | ---- |
| Rice straw | 41-57 | 33 | 19-Aug | Aug-38 |
| Henequen | 60 | 28 | 8 | 0.5 |
| Agave | 68.42 | 4.85 | 4.85 | 0.26 |
| Banana | 60–65 | 6–8 | 5–10 | ---- |
| Nettle | 53–86 | 4–10.3 | 3.5–9.4 | 3.1–4.2 |
| Prosopis juliflora | 61.65 | 16.14 | 17.11 | 0.61 |
| Cyperus pangorei | 68.5 | ---- | 17.88 | 0.17-1.7 |
| Napier grass | 47.12 | 31.27 | 20.63 | ---- |
| CDAF | 60.27 ± 9.3 | 22.72 ± 9.61 | 16.59 ± 0.3 | 1.55 |
Table 5. Comparison of chemical composition of CDAF [45, 60, 74, 75].
FTIR analysis: Fourier-transform infrared spectroscopy is utilized for characterizing lingo cellulosic fiber to identify chemical compounds in a wide range of capacities, by considering the infrared features and transmittance bands of their constituents [76]. The FT-IR spectrum of CDA fiber is presented in Figure 7 and the detailed is shown in Table 6.
| Peaks (cm-1) | Functional Group | Composition | References |
|---|---|---|---|
| 3751 | Strong O-H stretching | Cellulose and its structure | [77] |
| 3344 | |||
| 2906 | Vibration of methyl and methylene groups, C-H stretching vibration | Cellulose and hemicellulose molecules | [77] |
| 2504 | CH2 symmetrical stretching | Wax | [78] |
| 1923 | Carbonyl group | Hemicelluloses | [78, 79] |
| 1739 | C=O group stretching vibration of the ester group | Hemi-cellulose or carboxylic acid in lignin | [79, 80] |
| 1440 | CH2 deformation, | Lignin | [81] |
| 1337 | CH2 wagging, and | ||
| 1318 | CH3 bending, | ||
| 1241 | Stretching of C-O due to the vibration of the acetyl group | Lignin | [81] |
| 1164 | C-O-C groups asymmetric bridge stretching, | Hemicellulose and cellulose molecules | [81] |
| 1055 | C–O aromatic ring and skeletal vibration of C-O-C | Cellulose | [81] |
| 895 | βglycosidic linkages between the sugar units | Hemicellulose and cellulose molecules | [82] |
| 690 | C–H bond of aromatic hydrogen | Lignin compound | [82] |
| 523 | Out of plane bonding of OH | [82] |
Table 6. The functional group analysis result with FTIR.

Figure 7: FTIR spectral Analysis curve for extracted fibers. waterextracted CDAF%T
The spectral graphs create the functional group sketch of the fiber, a distinguishing molecular fingerprint that can screen out and scan samples for diverse components of the fiber, and detect functional groups, distinguish the covalent bond relationship figures. In general, from the FTIR result of CDAF, we can concluded that the fibre has very well-known chemical compounds the can be depicted from their functional groups. Its composition of the functional groups is comparable with other well-known natural cellulosic fibres.
Figure 7 shows that there is a significant difference only in % transmission of the CDA fiber prepared from the cold and hot extraction methods. This shows that part of the foreign matter and pectic components have been removed by the microbial action and increase the percent transmission in Cold Water Extraction Fiber (CWEF) and give for the high amount of transmission in the fiber.
We Now days, the need for recyclable, renewable and sustainable materials has brought about the amplified consumption of natural fibers for reinforcing polymers to outfit a wide variety of alications. This study was mainly focused on the extraction and characterization of the lignocellulosic fiber derived from Cyperus Dichrostachus A. Rich plant. On the progress of this study, the new natural lignocellulosic fiber was successfully demonstrated to be an alternative source for producing fiber for varied alications. The fiber was extracted warm water extraction techniques at different NaOH concentrations. The influence of alkali treatment with correlated factors and extraction techniques on the chemical composition, morphological, structural, thermal and tensile properties of the fiber was studied well.
The elimination of hemicellulose from the fiber strands on this fiber was proved by chemical analysis and FT-IR studies. The thermal stability of the fiber strands was found to be better-quality for warm water extracted fiber treated with NaOH.
In general, the physical properties, chemical composition, thermal degradation, and mechanical properties of CDAF were characterized and based on the results, the following conclusions were drawn:
• The results showed higher percentage of cellulose content (60.27 ± 9.3%), Lignin content (16.59 ± 0.32%), and insignificant presence of ash content (1.3%) and moisture content (11.02 ± 1.38%) which are the required properties for alications as a reinforcing material in composite manufacturing.
• The density of the CDAF (1.01 ± 0.53 g/cm3) is low compared to other natural fibers; this makes CDAF best alternative material in manufacturing of light weight polymer composite products.
• The CDAF indicates high cellulosic content when compared with other natural fibers, which is markedly evident for good tensile properties. The CDAF shows low extractive content (1.5%), make it best choice for good interfacial bonding between reinforcement and matrix in the composite manufacturing.
• The high tensile strength of CDAF and the lower density (1010 ± 534.62 kg/m3) make the fiber a good alternative for synthetic fibers and effective reinforcement for fabricating the thermosetting polymer composites and important constituent in making shock absorbing products, lightweight materials like, mats, pillows, cushions, doors, furniture etc.
• It can be concluded that the CDA fiber is versatile and have engineering potential that can be used as effective reinforcement for a wide variety of alications.
Future works will involve studies on the possible beneficiation route of the CDA fiber in textile industry and composite manufacturing. The possibility for paper and pulp production would be also analyzed.
Sponsorship and research laboratory services were delivered by Bahir Dar University of Ethiopian Institute of textile and Fashion Technology within Textile Chemistry Research and Innovation centre
[Google scholar] [EBSCO]
[Crossref][Google scholar] [Pubmed]
[Crossref][Google scholar][Pubmed][EBSCO]
[Crossref][Google scholar] [EBSCO]