Keywords
|
| computer vision, medical imaging, image processing, image classification, blood detection |
I. INTRODUCTION
|
| Color is the most important characteristic of bleeding observed in endoscopic videos and therefore it is the most commonly addressed feature in automatic detection systems [1]. Consequently, the problem of bleeding detection is often treated as a task of identifying color ranges typical for blood, but rare in normal, non-bleeding regions. Often more sophisticated properties of color values are introduced. Other features than color-related can be also employed for bleeding detection, including texture properties, contours and relations between separate image regions detected by means of segmentation. In the previous work, the author presented a conception of a thorough bleeding detection system [2], assuming utilization of a set of 10 features descriptors, considering color, contour, texture features as well as spatial dependencies between regions. The initial experiments showed, that even though non-color features were significant for accurate bleeding detection, the most important feature, which mostly contributed to correct decisions, was still the color feature. Therefore a reliable color model is necessary for any comprehensive bleeding detection system. In this paper a color descriptor designed in this direction is presented along with an analysis of endoscopic images color distributions. |
II. RELATED WORK
|
| Various approaches have already been proposed for endoscopic bleeding detection. In [1] Brzeski et al. reviewed 18 algorithms and categorized different types of considered features of bleeding. Most of the existing bleeding detection methods rely on the color features. At the same time, the algorithms are mostly designed for wireless capsule endoscopy images. Li and Meng proposed a method employing HSI color space, along with LBPriu2 and Chebyshev polynomials [3]. Lee and Yoon presented a method based on variations of RGB color space and saturation from HSV [4]. Pan et al., in turn, proposed a method based on original color difference measures in RGB space supplemented with a region growing segmentation method [5]. Recently, Figueiredo et al. presented a method for bleeding detection based on CIELab color space [6]. Abouelenien et al. utilized in their method HSV histograms, dominant colors and a co-occurrence matrix [7]. Finally, Ghosh et. al proposed a method based on statistical features of a transformed RGB color space [8]. |
III. THE PROPOSED METHOD
|
| The design of the presented method was conducted on exactly the same image set as in [2]. The set was acquired with the assistance of physicians from a medical university and consisted of 74 bleeding images and 51 non-bleeding images. Each of the images has been extracted from a different endoscopic examination. Collecting only a single image from one examination significantly decreases the number of images, but is required for the correctness of the analysis. Therefore, the collected images are assumed to be a representative set of bleeding and non-bleeding images. For conducting the experiments, the data set was split into two subsets: a training set, consisting of 36 bleeding images and 25 non-bleeding images, and a test set, with 38 and 26 images, respectively. |
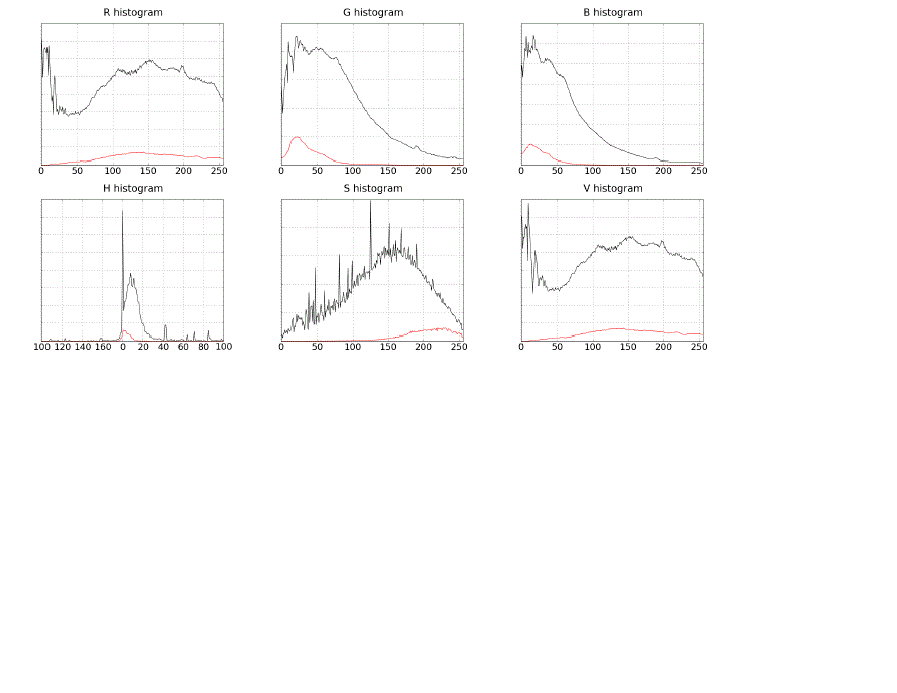
| The experiments were initiated by computing the histograms for separated color channels of the endoscopic images. Except extracting the original red, green and blue channels, the images were also converted into HSV color space, which enabled extracting hue, saturation and value planes. For each of the considered planes, two histograms were computed over all images in the training set – one histogram for the pixels in blood regions, and the second for all pixels. Black pixels from the border surrounding the actual endoscopic view were ignored. The results can be seen in figure 1. The expected result would be to observe color values typical only for bleeding regions, which would show in histograms as the blood plot getting close to the overall plot for most of its values. However, as can be seen in the charts, this does not hold. The histograms clearly indicate, that the single channel values of bleeding pixels overlap with the rest of pixels in almost all ranges of values. This indicates, that distinguishing between blood and normal pixels on the basis of any of the planes alone is actually impossible, even for HSV planes. Appropriate combinations of values in particular need to be therefore employed in order to achieve satisfactory discrimination results. |
| Therefore the proposed method is designed to utilize all of the pixel data for the bleeding detection task. The method uses the RGB space, in which the investigated endoscopic images were originally delivered. The main idea of the algorithm is to count how often each possible pixel value {r, g, b} appeares in blood regions, and how often it appeares in normal regions. The training of the algorithm can be outlined in the following steps: |
| 1) Initilize a lookup table of possible {r, g, b} pixel values |
| a) each pixel value is initiated with blood pixel counter = 0 |
| b) each pixel value is initiated with normal pixel counter = 0 |
| 2) For each pixel with value {r, g, b} in each image in the training set: |
| a) if blood pixel, increase blood counter in the lookup table at {r, g, b} |
| b) if normal pixel, increase normal counter in the lookup table at {r, g, b} |
| 3) For each entry in in the lookup table compute blood probability, defined as blood counter divided by a sum of blood and normal counters |
| Then, the analysis of a new, unknown endoscopic image is conducted as follows: |
| 1) Prepare an empty mask for detected blood pixels |
| 2) For each (x, y) pixel of the analysed image |
| a) get pixels blood probability from the lookup table |
| b) put the probability in (x, y) position of the mask, scaled by the maximum pixel value (255) |
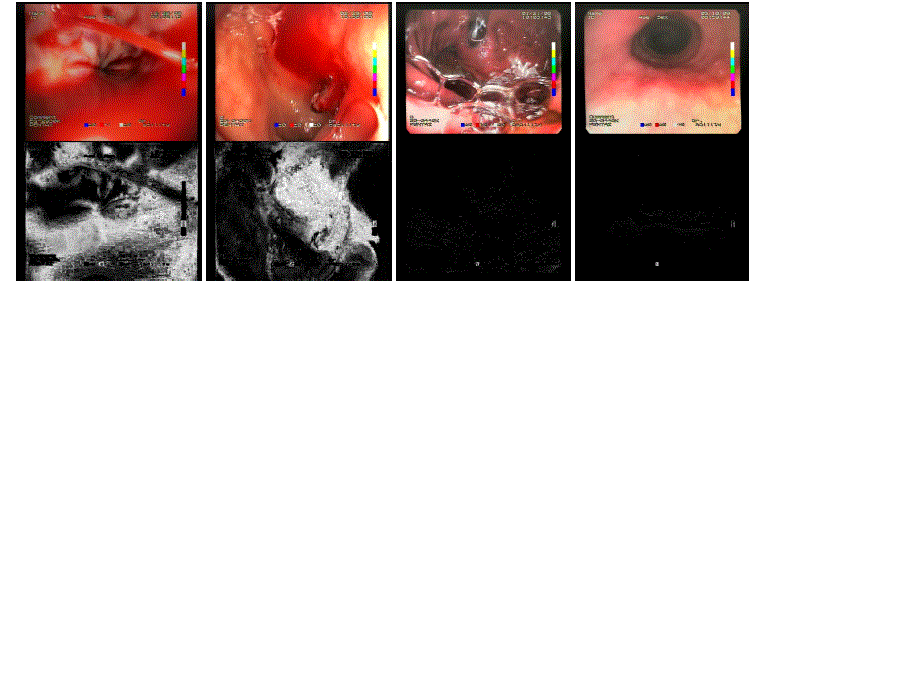
| The above procedure results in a probability map, where each pixel in the image reflects the chance of denoting a blood pixel. The areas of high probability of being blood have white color. The lower the probability, the darker the color in the mask, eventually reaching black for pixel values with blood probability equal to zero. Figure 2 presents the mask acquired for chosen images from the test set. |
| The final step is to make a decision, whether bleeding is present in the image basing on the probability mask. It is achieved by simple tresholding of the mask with an appropriate value and counting the pixels that remain non-zero. If more than 1% of image pixels are above the threshold value, the image is considered a bleeding case. In order to address two degrees of blood color ranges proposed in [2], two thresholding values are defined, actually resulting in two different descriptors. They can be referred to as "exact blood color" descriptor and "close blood color descriptor". The threshold values for the descriptors were set to 100 and 50, respectively, with the maximum mask pixel value of 255. The results acquired on the training and test sets were presented in tables I and II. The columns in the tables denote the following measures: |
| B(Fi = 1) fraction of bleeding images with the feature present (descriptor returning true value) |
| N(Fi = 1) fraction of normal images with the feature present |
| TB number of bleeding images with the feature present |
| FN number of bleeding images with the feature absent |
| TN number of non-bleeding images with the feature absent |
| FB number of non-bleeding images with the feature present |
IV. DISCUSSION
|
| The efficiency achieved by the presented color feature descriptors for endoscopic bleeding are definitely satisfactory. The "exact blood color" descriptor turned to be utterly exclusive for the bleeding images, meaning that it did not return true value for any non-bleeding image. At the same time, as much as 70 out of 74 total bleeding images was detected by the descriptor. In turn, the "close blood color" descriptor managed to cover all but one bleeding cases, including only six of the non-bleeding images. Therefore both descriptors fulfilled the expectations stated in the previous experiment [2]. Both addressed features were reflected in the expected degree. In most metrics, the achieved results were even higher than required, especially considering normal images. Only in the case of "exact blood color" feature, the efficiency on bleeding images was slightly lower. This indicates that the thresholding parameters possibly should have been set to higher values. As a consequence, the normal images performance would probably drop by some amount. It is also notable how well the blood probability mask performed. Their accuracy turned out too be quite high, which is demonstrated in the 4 sample images. The accuracy also remained stable on the rest of images. This property can be further employed for precisely marking the location of bleeding in the analyzed image. In summary, the method is to significantly contribute to the expected efficiency of the constructed bleeding detection system, providing the anticipated discrimination power. |
V. CONCLUSIONS
|
| The motivation of this work was to design a simple but effective method of discriminating blood pixels from normal ones. Two descriptors for this purpose were presented, which achieved efficiency results slightly higher than were assumed by the theoretical considerations. Further efforts may lead to extending the descriptor to an adaptive version for an additional efficiency gain, especially when considering new images from other endoscopic devices, which might introduce additional color variance. |
Tables at a glance
|
 |
 |
| Table 1 |
Table 2 |
|
| |
Figures at a glance
|
 |
 |
| Figure 1 |
Figure 2 |
|
| |
References
|
- Adam Brzeski, Adam Blokus and Jan Cychnerski ’An overview of image analysis techniques in endoscopic bleeding detection’. International Journal of Innovative Research in Computer and Communication Engineering, Vol. 1, No. 6, pp. 1350-7, 2013.
- Adam Brzeski, ’Visual Features for Endoscopic Bleeding Detection’. British Journal of Applied Science & Technology, Vol. 4, No. 27 pp. 3902-3914, 2014.
- B. Li and M. H. Meng, ’Computer-aided detection of bleeding regions for capsule endoscopy images’. IEEE Transactions on Biomedical Engineering, Vol. 56, No. 4, pp. 1032-9, 2009.
- Yong-Gyu Lee and Gilwon Yoon, ’Bleeding detection algorithm for capsule endoscopy’.World Academy of Science Engineering and Technology 81, pp. 672-677, 2011.
- Guobing Pan, Fang Xu and Jiaoliao Chen, ’A novel algorithm for color similarity measurement and the application for bleeding detection in WCE’. International Journal of Image, Graphics and Signal Processing, Vol. 3, No. 5, pp. 1-7, 2011.
- I. N. Figueiredo, S. Kumar, C. Leal and P. N. Figueiredo, ’Computer-assisted bleeding detection in wireless capsule endoscopy images’. Computer Methods in Biomechanics and Biomedical Engineering: Imaging & Visualization, Vol. 1, No. 4, pp. 198-210, 2013.
- Mohamed Abouelenien, Xiaohui Yuan, BalathasanGiritharan, Jianguo Liu and Shoujiang Tang, ’Cluster-based sampling and ensemble for bleeding detection in capsule endoscopy videos’. American Journal of Science and Engineering, Vol. 1, No. 1, pp. 1-9, 2013.
- T. Ghosh, S. K. Bashar, M. S. Alam, K. Wahid and S. A. Fattah, ’A statistical feature based novel method to detect bleeding in wireless capsule endoscopy images’. Informatics, 2014 International Conference on Electronics & Vision (ICIEV), Vol. 1, No. 4, pp. 1-4, 2014.
|