Keywords
|
| Image quality assessment (IQA),full reference method, Original image, Distorted image PSNR, SNR, MSSIM, Matlab. |
I.INTRODUCTION
|
| In this technological era of imaging and multimedia technologies, visual information, recorded by images has become the main source for knowledge acquisition. In the process of visual information acquisition, processing, transmission, and storage, some artifacts or noise maybe introduced to images which degrade the visual quality. The rapid growth in the research of IQA is motivated by the area of applications below: |
| • IQA can be used to benchmark image and video processing system and algorithm, such as compression, restoration, denoising and deblurring techniques. |
| • IQA can be used to monitor image quality in the quality control systems. |
| • IQA can be embedded into image and video processing system to optimize the algorithm and parameter settings. |
II. ASSESSMENT TECHNIQUES
|
| The evaluation of quality may be divided into two classes, subjective and objective methods. In the subjective method, human judges the quality by themselves and in the objective method the mathematical metrics are used. The objective IQA can be classified into full-reference, reduced-reference and no-reference IQA based on the availability of the reference image. |
| Full reference method: |
| In this method QA algorithm have access to a 'perfect version' of the image or video against which it can compare a 'distorted version'. The 'perfect version' generally comes from a high-quality acquisition device, before it is distorted by, say, compression artifacts and transmission errors. However, the reference image or video generally requires much more resources than the distorted version, and hence FR QA is generally only used as a tool for designing image and video processing algorithms for in-lab testing, and cannot be deployed as an application. To evaluate the quality of a distorted image, FR metrics, which have access to both whole original and reconstructed information, provide the most precise evaluation results compared with NR and RR. |
III. DESIGNING FORMULAS
|
| Simple statistics error metrics and Human Visual System(HVS) feature based metrics defined as : |
| A) Simple statistics error metrics: |
| i) MSE: It stands for the mean squared difference between the original image and distorted image. MSE (mean square error) is the Euclidian distance between the original and the degraded images. The mathematical definition for MSE [1] is: |
 |
| In Equation ,aijmeans the pixel value at |
| Position (i, j) in the original image and bij means the pixel value at the same position in the corresponding distorted image. |
| ii) PSNR: PSNR is a classical index defined as the ratio between the maximum possible power of a signal and the power of corrupting noise that affects the fidelity of its representation [2]. It is given by: |
 |
| Where 255 is the maximal possible value the image pixels when pixels are represented using 8 bits per sample. There are also some other metrics like: Average Difference (AD), Maximum Difference (MD),Mean Absolute Error (MAE) ,Peak Mean Square Error (PMSE) |
| B) Human Visual System (HVS) feature based metric: |
| SSIM: The structural similarity index is a method for measuring the similarity between two images [3]. |
 |
| Where μx is average of x, μy is average of y, σx, σy are standard deviation between the original and processed images pixels, respectively.C1, C2 are positive constant chosen empirically to avoid the instability of measure. The mean of SSIM is known as mean structural similarity index metric (MSSIM) and it is given as: |
 |
IV. METHODOLOGY USED
|
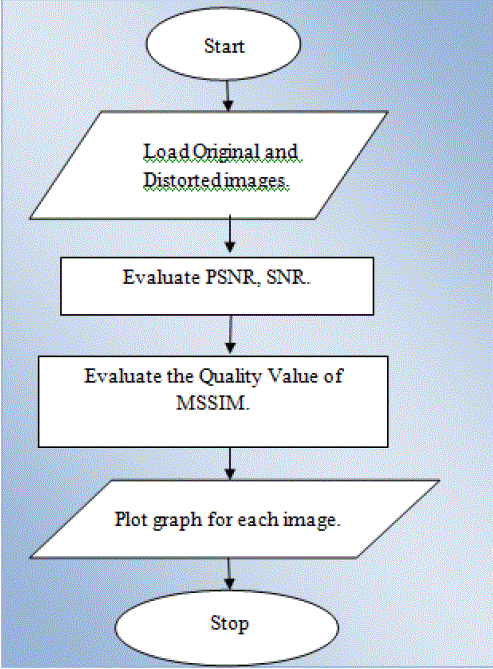
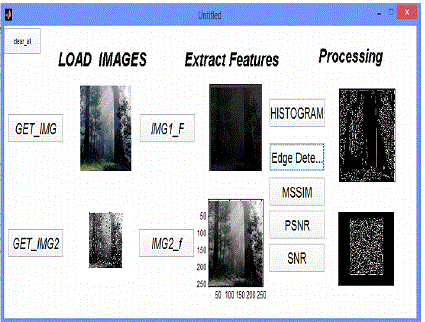
| Image quality assessment consists in modeling the metric between an original (ideal) image and a distorted version of it. The goal is to evaluate and compare the performance of image processing algorithms. For Quality Analysis of Images, step by step operations performed as shown in flow chart. |
V. SIMULATION AND ANALYSIS
|
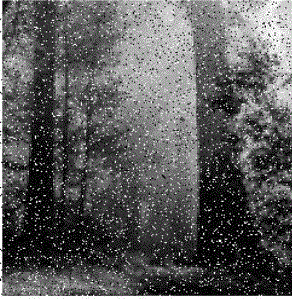
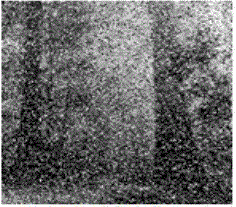
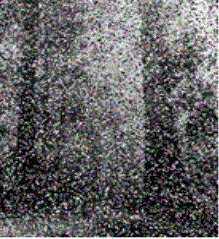
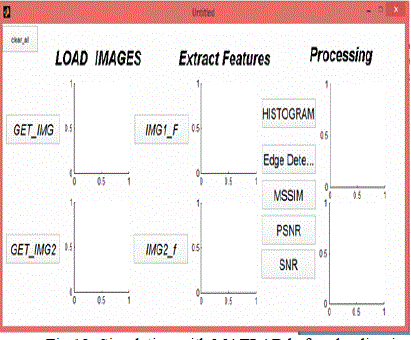
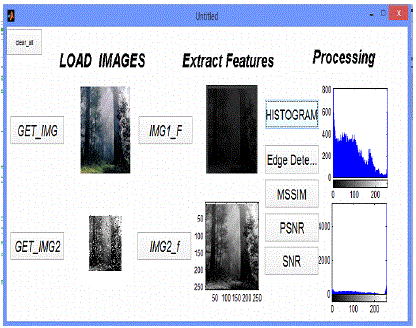
| In this section, we compare the performance of MSSIM with the statistical methods that are PSNR, SNR. The specific contents of the type of noise we have used is salt & pepper noise. The algorithms were implemented on MATLAB Software. Each Simulation was run on an Intel core i3-330M processor at 2.13 GHz. |
VI. CONCLUSION AND FUTURE SCOPE
|
| A. Conclusion |
| In the field of image processing, image quality assessment is a fundamental and challenging problem with many interests in a variety of applications, such as dynamic monitoring and adjusting image quality, optimizing algorithms and parameter settings of image processing systems, and benchmarking image processing system and algorithms. Earlier techniques were based on mathematical metrics like PSNR, MSE but they do not correlate well with subjective perception values. MSSIM is a human visual system based metric which uses the luminance, structural and contrast information present in the given image as like in HVS model. These validation results show the robustness, feasibility of the MSSIM and it can perform better than PSNR and SNR. |
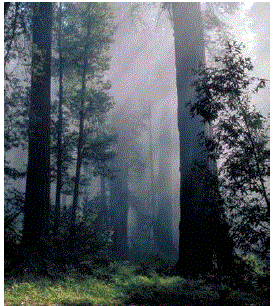
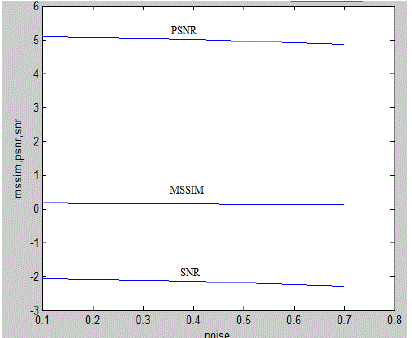
| Plot for redwood image in fig 10 is drawn according to the table1 this shows the variation of the various assessing parameters with respect to noise density variation. The plot clearly shows that curve for MSSIM is almost a straight line parallel to the axis which is used to show the noise density variations. And the variation of this (MSSIM) parameter with respect to noise density is greater than the other two parameters i.e. SNR and PSNR. So the image quality can be calculated more precisely by HVS based metric. |
| B. Future Scope |
| Although this HVS based metric has good consistency with subjective perception values, there are still some issues to be investigated in the future. For example, we can investigate the new image representation method to reduce the number of feature parameters needed for IQA metrics. Also we can introduce the methods which can estimate the quality of the image without any reference. |
Tables at a glance
|
 |
| Table 1 |
|
| |
Figures at a glance
|
 |
 |
 |
 |
 |
| Figure 1 |
Figure 2 |
Figure 3 |
Figure 4 |
Figure 5 |
| |
 |
 |
 |
 |
 |
| Figure 6 |
Figure 7 |
Figure 8 |
Figure 9 |
Figure 10 |
| |
 |
 |
 |
 |
| Figure 11 |
Figure 12 |
Figure 13 |
Figure 14 |
|
| |
References
|
- Vikrant Bhateja, AseemKalsi ,Aastha Srivastava,” Reduced Reference IQA based on Strucatural Dissimilarity” International Conference on signaland Integrated Networks(SPIN) ,2014
- KeGu,GuangtaoZhai,XiaokangYang,Wenjun Zhang, and Min Liu, ”Subjective and Obective Quality Assessment For images with Contrast Change978-1-4799-2341-0\13\$31.00@2013 IEEE
- YinghuaShen,ChaohuiLu,Hui Ren ,”Obejctive Quality Assessment of JPEG Distorted Stereoscopic image”2nd International Conference onComputer Science and Network Technology(2012).
- Min Zhang, XuanqinMou, Lei Zhang, “ Non-Shift Edge Based Ratio (NSER): An Image Quality Assessment Metric Based on Early VisionFeatures”, IEEE Signal Processing Letters, Vol. 18, No. 5, pp. 315-18 ,May June 2011
- Dan Lv, Du-Yan Bi, Yuan Wang, “ Image Quality Assessment Using DCT and Structural Similarity”, IEEE conference on wireless communicationnetworking and mobile computing, pp.1-4, 2010.
- Gonzalez , R.C.,Woods, R.E., and Eddins, S.L “Digital Image Processing Using Matlab”, Gatesmark Publishing ,Knoxville,TN,2nd edition,2009
- Yaohua Yi, Xiaoqing Yu, Leiguang Wang , Zhigao Yang, “ Image Quality Assessment Based on Structural Distortion and Image Definition” International Conference on Computer Science and Software Engineering,pp.253-56,2008.
- Engelke U., Zepernick H.J., “Perceptual-based Quality Metrics for Image andVideo Services:” 3rdEuroNGI conference on next generationinternet networks, pp.190-97, 2007
- SheikhH.R.,SabirM.F., BovikA.C., “A statisticalevaluation of recent full reference image quality assessmentalgorithms”, IEEE Trans. IP, vol. 15,pp. 3440-3451, 2006.
- WangZ.,Bovik A. C.,SimoncelliE. P., “Structural Approaches to Image Quality Assessment,” Handbook of Image and Video Processing, 2nded,New York, USA: Academic Press, 2005, pp. 1-33
- CadikM.,Slavik P., “Evaluation of two principal approaches to objective image quality assessment”, 8th International Conference on InformationVisualisation, IEEE Computer Society Press, pp. 513-551, 2004.
- M. Carnec, P. Le Callet and D. Barba, “An image quality assessment method based on perception of structural information,” 2003 InternationalConference on Image Processing, Barcelona, Spain, September 14-17, 2003.
- Avcibas I., Sankur B., Sayood K., “Statistical evaluationof image quality measures”, Journal of Electronic Imaging,vol. 11, no. 2, pp. 206-223, 2002.
|
BIOGRAPHY
|
| Anu Taya is an M.Tech student (CSE) in Doon Valley Institute of Engg. & Tech.(Karnal). Her research area is image processing (Comparative analysis of image quality assessment using HVS model) with MATLAB. She has done her B.Tech degree from Galaxy Inst. of Tech. & Mgt., Bhaini Kalan (Karnal). |
| Komal is an M.Tech student (CSE) in Doon Valley Institute of Engg. & Tech. Her research area is image processing (Biometric) with MATLAB. She has done her B.Tech degree from Galaxy Inst. of Tech. & Mgt., Bhaini Kalan (Karnal). |
| Shipra Khurana is an Assistant Professor in DVIET, Karnal. She has done her M.Tech in CSE from DVIET, Karnal. |
| Amit Kumar Mehla is an Assistant Professor in Galaxy Inst. of Tech. & Mgt., Karnal. He has done his M.Tech in ECE from U.I.E.T (KUK), Kurukshetra.He has 3 year teaching experience & published about 6 National & International research papers. His research area is wireless based antenna. |