International Journal of Advanced Research in Electrical, Electronics and Instrumentation Engineering
ISSN ONLINE(2278-8875) PRINT (2320-3765)
ISSN ONLINE(2278-8875) PRINT (2320-3765)
V.Balaji1, Dr. L.Rajaji2,
|
| Related article at Pubmed, Scholar Google |
Visit for more related articles at International Journal of Advanced Research in Electrical, Electronics and Instrumentation Engineering
The analysis study has been done for a First Order Delay Time (FODT) model controlled by Proportional Integral Derivative (PID) and Model Predictive Control (MPC) controller using Laboratory Virtual Instrument Engineering Workbench (LabVIEW) software. This paper illustrates how practically MPC to use and give an overview of the MPC implementation in LabVIEW. The simulation results obtained are compared between the PID and MPC controller. The Performance Comparison demonstrates a good correlation PID and MPC controller.
Keywords |
||||||||||||||
| MPC Controller, PID Controller, Tuning methods, Lab VIEW, FODT. | ||||||||||||||
INTRODUCTION |
||||||||||||||
| The Process control theory is evolving and new types of controller methods are being introduced.PID controllers are commonly used due to its simplicity and effectiveness. In most of the industries PID controllers are used. Still there is no generally accepted design method for this controller. In 1970’s MPC controller has been introduced as a way of controlling a wide range of processes .In the following section performance analysis has been done for first order delay time model controlled by using PID and MPC controller using Lab view. Since PID controllers and their tuning methods are known for decades. So they will not be presented here in detail. Since MPC controllers are new they will be presented in the following section. | ||||||||||||||
| Lab VIEW Stands for Laboratory Virtual Instrument Engineering Workbench. The Lab view environment consists of two programming layers a front panel and a block diagram. The front panel is built with controls and indicators, which are the interactive input and output terminals of the VI respectively. LabVIEW has many built in functions such as I/O data communication, state charts, Mathematics, Signal Processing, System Identification and Estimation. Control Design Simulation Module. Using above mentioned functions of LabVIEW MPC Model was simulated. | ||||||||||||||
MODEL PREDICTIVE CONTROL (MPC) |
||||||||||||||
| Model Predictive Control relay on dynamic models of the process most often linear empirical models obtained by system identification. Model Predictive control refers to a class of computer control algorithms that utilize an explicit process model to predict the future response of a plant.MPC controller contains three basic functional blocks as shown in figure 1. The optimizer finds the optimal control input u*(t) which when applied to the plant gives the minimum value of the cost J.Of course, this optimization must be done in the presence of the constraints and the cost function. The State estimator is used to predict unmeasured states ^x(t) form the plant. | ||||||||||||||
| Model Predictive Control optimizes the output of a plant over a finite horizon in an iterative manner as shown in Figure 2. Suppose the step size of the controller is T. At time step k the current plant state is sampled and the optimizer computes a cost minimizing control strategy u*(t) for finite time steps in future k = t + 0T; t + 1T; :::; t + pT where p is the number of look ahead prediction horizon steps. In practical circumstance, the whole optimal control sequence cannot be applied to the process. This is because of inaccurate process model and added disturbances in the process which can cause error between the predicted output and the actual process output. A mathematical model is used only for prediction and state calculation, prediction errors could accumulate. | ||||||||||||||
| The first step of the control strategy is applied to the plant and the plant state is measured again to be used as the initial state for the next time step. This feedback of the measurement information to the optimizer adds robustness to the control. The plant state is sampled again and the whole process is repeated again with the newly acquired states. The prediction time window [t + 0T; t + 1T; :::; t + pT ] shifts forward at every time step (reason why MPC is also Known as Receding Horizon Control Other names like Rolling-Horizon Planning, Dynamic Matrix Control (DMC and Generalized Predictive Control (GPC) have also been used for MPC. | ||||||||||||||
SIMULATION |
||||||||||||||
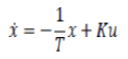
| In this section we will consider a model using Lab VIEW. Consider a first order system given below. | ||||||||||||||
 |
||||||||||||||
| Where T is the time constant for the system, K is the pump gain . set T = 8s and K = 4 Substitute the values in the above equation we get | ||||||||||||||
 |
||||||||||||||
| The figure 3 shows the front panel diagram with a waveform of the above model using the Lab VIEW software From the above figure it clearly illustrates that how the MPC reaches the set point In the next section we will see the performance of analysis of MPC controller for a First order Delay Time Model and its waveform (Refer figure 4 )using Lab view software. | ||||||||||||||
First Order Delay Time Model |
||||||||||||||
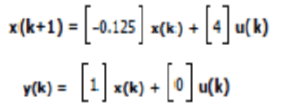
| We consider the FODT system X = - 1/T + Ku (t- ) set the values as T = 8 ,K = 4 and = 4 Where is time delay.The MPC algorithm requires that the model is a linear state-space model, but the time delay causes problems. A solution could be to transform the differential equation we have to a transfer function. Then we can use built-in functions in Lab VIEW to convert it to a linear state-space model. Applying the Laplace transform to the above expression we get | ||||||||||||||
 |
||||||||||||||
| The figure 5 shows the MPC tuning parameters used for the above model. The above figure clearly demonstrates after the MPC parameters how it reaches the target. The figure 5 shows the transfer function of FODT model and its wave form and it also shows how it reaches its set point with a delay time 4s . = 4 | ||||||||||||||
| From the waveforms of figures 6and 7 clearly illustrates the difference between MPC and PID Controller. We can observe from figure 6 that how fast the MPC reaches is set-point. Whereas in case of PID controller moves far of the set point.(Refer fig 7). MPC tries to bring the process as a possible to constraints without violating them .In mean while PID controller is far from the constraints. The difference between the MPC and PID controllers occurs due to the following reasons. | ||||||||||||||
| ïÃâ÷ PID controller handles only a single input and a single output (SISO systems). | ||||||||||||||
| ïÃâ÷ MPC controller is a more advanced method of process control used for MIMO systems (Multiple Inputs, multiple Outputs). | ||||||||||||||
| ïÃâ÷ In PID controller, there is no knowledge of constraints. | ||||||||||||||
| ïÃâ÷ The primary advantage of MPC is its ability to deal with the constraints. | ||||||||||||||
| ïÃâ÷ PID controller does not have the ability to deal with the constraints | ||||||||||||||
| ïÃâ÷ PID controller does not require a model of process | ||||||||||||||
| ïÃâ÷ MPC controller requires the model of a process. | ||||||||||||||
CONCLUSION |
||||||||||||||
| This paper presents results obtained in the set of simulations for FODT processes .when controlled with PID controller and MPC controller. The analysis clearly demonstrates that set-point in traditional control is far from constraint whereas in MPC set-point is closer to constraint .In this paper it was proved that MPC tries to bring the process as close as possible to constraints without violating them. These simulation results are useful to do the required modifications in control system industry for optimal control. | ||||||||||||||
Figures at a glance |
||||||||||||||
|
||||||||||||||
References |
||||||||||||||
|


