Research & Reviews: Journal of Material Sciences
ISSN:2321-6212
ISSN:2321-6212
J.J.Pr´ıas-Barraga’n1*, L.M. Mej´ıa-Mendoza2, M.Velasco3, J.D Perea2, A. Aspuru-Guzik2, C.Acosta Minoli3
1Department of Physical Sciences, Quindio's University, Quindío, Colombia
2Department of Chemistry, University of Toronto, Toronto, Canada
3Department of Mathematical Sciences, Quindio's University, Quindío, Colombia
Received: 01-Mar-2023, Manuscript No. JOMS-23-90461; Editor assigned: 03-Mar-2023, PreQC No. JOMS-23-90461 (PQ); Reviewed: 17-Mar-2023, QC No. JOMS-23-90461; Revised: 24-Mar-2023, Manuscript No. JOMS-23-90461 (R); Published: 31-Mar-2023, DOI: 10.4172/2321-6212.11.2.001.
Citation: Barragan JJP, et al. Comparisons between Experimental and Computational Simulation of HR-TEM Images in Graphene Oxide. RRJ Mater Sci. 2023;11:001.
Copyright: © 2023 Barragan JJP, et al. This is an open-access article distributed under the terms of the Creative Commons Attribution License, which permits unrestricted use, distribution, and reproduction in any medium, provided the original author and source are credited.
Visit for more related articles at Research & Reviews: Journal of Material Sciences
Graphene Oxide (GO) has been extensively employed in a wide range of applications, from flexible electronics to energy storage. However, an attempt to relate experimental and computational simulations of HR-TEM images has not been explored from an atomistic approach. This work conducted comparisons between experimental and computational simulations of HRTEM images in GO, using molecular dynamics simulations and a many-body potential. We designed a heating-quenching procedure in a thermodynamic region to study a sample of 7,479 atomic arrangements produced at different densities, quench rates, and using graphene unit cells as precursor structures. The HR-TEM experiments were carried out at 5 nm scale. All simulated samples were numerically characterized through the calculation of the free volumes, surface areas, radial distribution functions, and structure factors. We found particularly useful how the reactive potential energy could disorder the GO structure. It was possible to identify the atomistic pattern formations of hydroxyl and epoxy bridges in GO. The experimental and simulated electron diffraction patterns exhibited polycrystalline structures with interactions of first and second neighbours, and a 64.68% coincidence between standard deviations/mean relations obtained from histogram analysis. These results suggest that our calculus, based on reactive potential, is compatible with available experimental data and potential applications of high-performance GO materials in electronics. In such case, our calculus is a reliable choice to produce GO structures with low computational cost
Graphene oxide; HR-TEM images; Defects; Energy storage; Molecular dynamics
Recent progress in graphene and Graphene Oxide (GO) [1–4] synthesis methods have facilitated research of GO, as an excellent candidate material to develop advanced electronics of sensors and devices; also, of great interest in technological applications [4–14].The physicochemical properties of GO can be modified by tuning the oxide composition [15]. The transport properties of GO can be influenced by the multilayered configuration [16] and presence of defects [17]. All these effects can be exploited in different fields [18] and applications from batteries [19–22], energy storage [23–25], electronics [26–33], catalysis [34], metal sorption [35], hydrogen storage [36], as well as to obtain Graphene Oxide monolayers [37–44], films, fibers, and membranes [45]. Graphene Oxide-based materials can be obtained experimentally through traditional methods, such as Brodies [38], Hummers [39], or Tang Lau [40], and modifications of these methods. However, these methods require strong oxides (Brodie and Hummer methods) or glucose (Tang Lau method) and are time consuming (96 h). These methods are excellent for basic research. However, the double-thermal decomposition method in a pyrolysis system has proven to be a low-cost alternative and eco-friendly technique to synthesize stable Graphene Oxide multilayers, using bamboo waste products as source material at higher temperatures from 573 K to 973 K; very different compared to traditional methods, as reported [41–44]. Higher temperatures promote elimination of organic compounds and oxygen functional groups, inducing formation of hydroxyl and epoxy bridges as multifunctional groups, leading to improvement in the crystal structure and positively impacting on the thermal, electrical, and magnetic transport [41–50]. Increasing temperature from 573 K to 973 K leads to reduced oxygen content, from 13.0% to 5.3%, and an increment around two orders of magnitude of the electrical conductivity, as evidenced by preliminary electrical measurements performed on single nanoplatelets, as reported [41], which could be important for advanced electronics of sensors and devices [41–46].
It is known that HR-TEM is a powerful technique for morphology and structural analysis in graphene-based materials; for these reasons, it has been employed in different focus works, like identification of ordered graphene lattices and intern sheet spacing [51], graphene-based catalysis [52], graphene as sample support in TEM experiments [53, 54], identification of polycrystalline structure in rGO and GO [54], and identification of atomic structure in rGO and GO [55, 56]. Many articles have very well discussed the microscopy of Graphene Oxide; nevertheless, the origin of the polycrystalline behaviour is unknown and as a studied of first time, it is proposed here the formations of patterns of hydroxyl and epoxy bridges in GO may be to dominate the physics and chemistry of GO.
Also, basic studies of HR-TEM images in GO have been reported [41] along with their atomistic description; however, description of atomistic large-scale configuration in GO by employing a reactive potential and calculating HR-TEM images, to relate experimental and computational simulations of HR-TEM images, is currently considered an open research field. To our knowledge, this kind of study has yet to be explored from an atomistic approach. Herein, this work presents results and discussions about the comparisons between experimental and calculated HR-TEM images in GO, which suggest possible pattern formations of parallel lines and circles induced mainly by the presence of the hydroxyl and epoxy bridges.
Sample preparation
The GO samples were obtained by using the Double-Thermal Decomposition (DTD) method in a pyrolysis system under a controlled nitrogen atmosphere using bamboo-Guadua angustifolia Kunth, as source material. In a first pyrolysis step or thermal decomposition of commercial bamboo biomass waste, the pyroligneous acid was obtained at 973 K during 1 hour and collected in a decanting funnel glass. A second pyrolysis step used the pyroligneous acid as a source material to obtain GO nanoplatelet samples at different carbonization temperatures (TCA= 673 K, 773 K, 873 K, and 973 K) during 1 h. Powders of GO nanoplatelets were obtained by mechanical grinding and subsequent sonication, filtering, and selection procedures, employing the Langmuir-Blodgett method. For more details on the synthesis method, please refer to [41–43]. The authors confirm that all methods in experimental research and field studies on plants, as a waste product of the commercial bamboo-Guadua angustifolia Kunth, were performed in accordance with the relevant regulations.
Characterization method
The GO samples were morphologically and structurally characterized by Transmission Electron Microscopy (TEM) and high-resolution (HR)-TEM images, obtained by using the Tecnai F20 Super Twin TMP on a FEI microscope operating at 80 kV and equipped with a Cs image corrector and a Gatan Tridiem spectrometer; for more details, see [41–43]. The contrast of a TEM image can easily change. Therefore, it is dangerous to discuss details based on the intensity of the grey scale of a TEM images. In fact, the Figure 1a actually looks brighter in the upper right as a whole. Thus, the experimental HR-TEM images were compared by the local zones method as shown in Figures 1a and 1b, with numbers of 1 to 10.

Figure 1a: HR-TEM micrographs of GOs experimental image taken at 5 nm scale with 5.3% oxide coverage and 10 boundary defects (with average sizes of 1.9 nm, approximately) remarked in blue circles with yellow color [42]).

Figure 1b: A simulated image that corresponds to 5 nm scale with 4.8% of oxide coverage and blue circles that represent possible boundary defects with patterns of circles and lines; associated, here, with possible presence of epoxy and hydroxyl bridges patterns.

Figure 1c: Histograms of HR-TEM micrographs presented in a; the intensity of the grey scale was associated with the presence of vacancies, defects, C=C atoms, C-OH groups, and C-O-C groups.
Computational strategies
Generation of a statistically representative ensemble of atomistic HR-TEM images of GO, systematically, requires the computation of hundreds of numerical simulations at a reasonable time. It is a critical aspect to enhance a balance between the details of the simulation model and the physical meaning of the results. In recent work, Mejía-Mendoza, et al. [57]. Simulated a set of nanoporous structures by employing a thermal schedule with Tersoff potential [58], reactive potentials–such as AIREBO [59] and ReaxFF [60]. They further relaxed nanoporous structures by using DFT techniques and compared their results with experimental data, demonstrating the capability of modelling graphene-based materials with melt-quench methods in a wide range of densities with 6,500 carbon atoms. It was concluded that the atomic arrangements and quench rate play an important role in simulation-box size effects and some of the results obtained are compatible with experiments.
Herein, this work presents a Molecular Dynamics (MD) simulation of the Graphene Oxide (GO) structure, using a reactive potential [60] implemented in LAMMPS [61], to elucidate the pattern formation of parallel lines and circles possibly induced by hydroxyl and epoxy bridges. First, we created orthogonal periodic cells of oxidized graphene based on the Lerf-Klinowski model [62], with hydroxyl and epoxy functional groups with different compositions, measured by the C/O ratio, ranging from 1.8% to 4.8% and presented here at 4.8% (Figure 1b), this value agree with experimental value of 5.3%, measured by XPS spectroscopy technique. These GO structures were balanced in an MD simulation at room temperature, employing the CHO reaxFF during 62 ps using NVE-MD and Berendsen thermostat. Then, an NVT production time was performed during 62 ps using the Nose-Hoover thermostat at 300 K. The resulting GO structures were analyzed by simulating the HR-TEM images (SIMTEM) [63] and correlating with experimental HR-TEM images (EXTEM).
Experimental and computational simulations of HR-TEM images in GO
Figure 1a shows the experimental HR-TEM micrograph in GO sample, pre-pared at the highest carbonization temperature (TCA) of 973 K, with 5.3% of oxides coverage estimated experimentally via XPS [42] and taken at 5 nm scale. It is very well known that HT-TEM images content information about the last GO layer in GO nanoplatelets (with thicknesses below 100 nm). It was observed that the GO surface exhibits boundary defect sizes around 1.9 nm as a diameter (circles in blue and yellow), previously determined from Raman spectra analysis [41,42], these values were estimate employing relations between ID and IG, without consider the broad of D and G bands, as very well known. Figure 1b shows the simulated HR-TEM micrograph that represents a GO sample. In Figures 1a and 1b, the blue circles were denoted with 10 examples of boundary defects numbered from 1 to10 and highlighted in blue-yellow colors, which represent the patterns formed by circles and lines in the GO structure, both possibly attributed to epoxy and hydroxyl bridges, respectively, as previously reported [42] and discussed ahead. Also, experimental and simulated GO structure HR-TEM micrographs revealed random defect density distribution in all micrographs. As reported before [41,42], defect density was determined by employing Raman spectral analysis results in GO samples (Figures 1a-1i). It was estimated that GO samples with 5.3% oxide coverage exhibit a value of 6.0 10−4cm−2, as defect density [41,42].

Figure 1d: Histograms of HR-TEM micrographs presented in b; the intensity of the grey scale was associated with the presence of vacancies, defects, C=C atoms, C-OH groups, and C-O-C groups.

Figure 1e: Correspond to lines patterns (denoted in blue) of experimental and simulated HR-TEM micrographs, respectively, and associated here with the presence of hydroxyl and epoxy bridges in the GO samples, respectively.

Figure 1f: Correspond to circles patterns (denoted in blue) of experimental and simulated HR-TEM micrographs, respectively, and associated here with the presence of hydroxyl and epoxy bridges in the GO samples, respectively.

Figure 1g: Raman spectra in GO samples showing the respective deconvolution bands peaks, as expected in vibrational characteristic of pyrolytic Graphene Oxide.
Note:  Experimental data,
  Fit ID peak,
  Fit IG peak,
  Fit ID’ peak,
  Fit I2D peak,
  Fit ID+G peak,
  Fit I2D’ peak,
  Cumulative Fit Peak.

Figure 1h: High resolution XPS spectra’s in GO samples at 5.3% of oxides concentration revealing the hydroxyl and epoxy presences in C1s. (taken with the permission of reference [42]).
Note:  Experimental data,
  C sp2,
  C sp3,
  C-OH groups,
  C=O groups,
  C-OOH,
  Background,
  Envelope.

Figure 1i: High resolution XPS spectra’s in GO samples at 5.3% of oxides concentration revealing the hydroxyl and epoxy presences in O1s. (taken with the permission of reference [42]).
Note:  Experimental data,
  C-O-C groups,
  C-OH groups,
  H2O,
H2O,  Background,
  Envelope.
Figures 1c and 1d show the histograms of images presented in Figures 1a and 1b, respectively; both histograms were observed in the greys scale the possible presences of vacancies and defects, carbon atoms (more relevant peak), hydroxyl groups and epoxy groups. Then, the hydroxyl and epoxy groups presence, form the patterns, like the hydroxyl and epoxy bridges. These patterns can be observed in Figures 1e and 1f, as blue lines and circles, respectively. By comparing standard deviations and mean values in both images, it was determined that simulated HR-TEM micrographs agree with the experimental HR-TEM micrographs by 64.68%, approximately, which is a good value considering the great atomistic arrangement of 7,479 atoms involved here in the simulated HR-TEM image, as presented in Figure 1b.
Typical GO vibrational characteristic was corroborated by Raman spectra analysis, as presented in Figure 1g. The experimental presence of hydroxyl and epoxy functional groups in GO nanoplatelet sample were identificated by using XPS spectroscopy as presented in Figures 1h and 1i, as expected and reported [41–43]. The theoretical molecular identification of hydroxyl and epoxy functional groups were carried out by employing the molecular configuration of GO presented in Figure 2a.
Patterns of hydroxyl and epoxy bridges in graphene oxide
Observations of experimental and simulated formations of patterns in a zoom of HR-TEM micrographs are presented in Figure 2b. In these Figures, the LAMMPS molecular configurations of GO were presented, revealing the presence of the hydroxyl and epoxy bridges patterns, indicated with blue lines and circles, respectively. These proposed that the presence of hydroxyl bridges can be attributed to the attraction between hydrogen atoms that produce out-plane of carbon atom and parallel line patterns of C-OH, as bridges. In contrast, epoxy bridge presence was possibly originated by the repulsion between oxygen atoms in C-O-C functional groups, which produces out-plane of carbon atom and circle patterns mainly by C-O-C functional groups, as bridges. Also, Figures 2a-2d show that theoretical HR-TEM zoom-images (10 ×) agree with experimental HR-TEM zoom-images (10 ×), and the respective comparison suggests possible hydroxyl and epoxy bridge formations and presence in the GO nanoplatelet sample. In addition, Figure 2a show the formation of4 and 5 line patterns associated with hydroxyl bridges per boundary defect; and the formation of 2 and 3 circle patterns attributed to epoxy bridges by boundary defect (Figures 2a-2d).

Figure 2a: Zoom (10 ×) in the experimental HR-TEM micrographs of GO with simulatem, molecular configurations showing patterns of lines associated with the presence of hydroxyl bridges [62].

Figure 2b: Zoom (10 ×) in the simulated HR-TEM micrographs of GO with simulatem, molecular configurations showing patterns of lines associated with the presence of hydroxyl bridges [62].

Figure 2c: Zoom (10 ×) in the experimental HR-TEM micrographs of GO with simulatem, circles related to the epoxy bridge presence [62].

Figure 2d: Zoom (10 ×) in the simulated HR-TEM micrographs of GO with simulatem, circles related to the epoxy bridge presence [62].
Electron diffraction patterns in graphene oxide structures
Figures 3a and 3b and its inset present the HR-TEM images and electron diffraction patterns in experimental and theoretical GO structures. Note that the presence of diffuse rings is possibly attributed to polycrystalline material, as expected [41, 42]. Figures 3c and 3d shows calculations of the experimental and theoretical 3D electron diffraction patterns in the GO nanoplatelet, determined from HR-TEM image analysis presented in Figures 3a and 3b. Blue rings correspond to the maximum intensity of the electron diffraction. Figure 3d exhibits a center hole, characteristic of material with hyper uniformity, while Figure 3c does not present the center hole; this behaviour suggests that the experimental GO sample exhibits polycrystalline structure without hyper uniformity or the GO sample corresponds to solid material, as expected [64]. Figure 3e presents a 3D comparison between experimental and theoretical GO HR-TEM images, calculated from analysis of Figures 3a and 3b; respectively. It was found that the theoretical HR-TEM image proposed here agrees with experiment red-plate zones, associated with the maximum coincidence between both HR-TEM images, as described by the red-plate zones, and the green peaks denote zones with the maximum difference between both HR-TEM images (Figures 3a-3e). Also, the red-plate zones suggest areas in the theoretical HR-TEM image that agree with the experimental HR-TEM images and demonstrate that it is possible, in these zones, to compare molecular configurations, as presented and discussed here in Figure 2a.

Figure 3a: Experimental HR-TEM images in GOs and their insets show the respective electron diffraction patterns.

Figure 3b: Theoretical HR-TEM images in GOs and their insets show the respective electron diffraction patterns.

Figure 3c: Correspond to calculations of the experimental 3D electron diffraction patterns in the GO nanoplatelet of Figure 3a insets.

Figure 3d: Correspond to calculations of the theoretical 3D electron diffraction patterns in the GO nanoplatelet of Figure 3b insets.

Figure 3e: Shows the 3D comparison between experimental and theoretical HR-TEM images in GOs of Figures 3a and 3b, respectively; the red-plate zones were associated with the maximum coincidence between both HR-TEM images.
Figures 4a and 4b presents the histograms of the experimental and theoretical electron diffraction images, corresponding to the insets of Figures 3a and 3b. It was found that both histograms agree and exhibit similar characteristic peaks associated with the same pixel composition, as expected, and this coincidence suggests that the GO-simulated structure propose here could describe well the experimental structure of GO samples at the large atomic scale. Here, it describes approximately the experimental electron diffraction image. Also, this result indicated that the atomistic large-scale GO structures could be used for fundamental studies of physical properties in GO of Figures 4a and 4b.

Figure 4a: Histograms of experimental electron diffraction images that correspond to insets of Figure 3a.

Figure 4b: Histograms of theoretical electron diffraction images that correspond to insets of Figures 3b.
To study the contributions of the first and second neighbours in the Brillouin zone of the simulated GO structure, Figure 5a presents the graphics of the theoretical radial distribution functions. The pair correlation function takes into account the average position of the atoms within a material. A ternary composition, is defined as [65]:

here,  are the total number of atoms from i-specie and gij(r) are the partial pair correlation functions between the atomic species i and j. To compute the atoms within the first and second coordination shells, instead of the pair correlation function, we used the Radial Distribution Function (RDF), which is related with the expression (1) and defined as [65] .
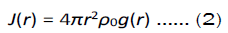
where r is measured in angstroms and ρ0 is the number density. A descriptor that can be integrated out from the RDF, the coordination number, is defined as the integral of the RDF concerning distance. If the calculus is performed within the first coordination shell, then the value of the integral can be interpreted as the average number of atoms within the first coordination shell. Moreover, we can perform this analysis to the partial RDFs, say Jij(r), where this calculus will mean the average number of j-atoms surrounding an i-atom, as similar to expression (2).
Table 1 presents the coordination numbers calculated from the simulation results. These results suggest the possibility of finding the hydroxyl and epoxy groups for every two carbon atoms. Also, this calculation reveals that, on average, each carbon atom is surrounded by three other carbon atoms; the first coordination shell is closely related to the graphite one, as expected.
| Bond | Coordination number |
|---|---|
| C-C | 2.95 |
| C-O | 0.49 |
| O-O | 0.16 |
| O-H | 0.38 |
Table 1. Coordination numbers calculated from the GO simulated structures.
Figure 5a shows the result of the RDFs total and partial in the GO structure of Figure 1b. As described, peaks were observed at 0.95, 1.45˚ A associated with the first coordination shell and at 2.50˚A related to the second coordination shell, corresponding to interactions of the first and second neighbours, respectively. These peaks revealed that first and second neighbours are influenced by the presence of C-C, O-O, H-H, C-O, O-H and C-H bonds.
How-ever, Figure 5b presents the relevance in these interactions of O-H and C-O bonds. The study found that O-H bonds are presented in the first neighbour interactions and C-O bonds are presented in the first and second neighbour interactions, this is because O-H bonds pull-up the C atoms out-plane of the graphene greater than C-O bonds. As expected and affecting in greater proportion the C-C distance; namely, the presence of O-H bonds decreases the C-C distance, affecting the first-neighbour interactions and therefore, the electrical conduction of electrons. This result agrees with previous experimental observations in GO nanoplatelets [41]. In Figure 5b, the peak at 0.95° A, associated with O-H bonds, suggests that O-H bonds could dominate the electrical properties in GO structures at low oxide coverages due to having the mini-mum distance interaction of 0.95° A between first neighbors, as expected and reported [41]. Previous experimental findings from reference [4] and processing article [66] support the simulation findings here; therefore, the hydroxyl and epoxy bridges are responsible for the GO polycrystalline structure observed here (Figures 5a and 5b).

Figure 5a: Radial distribution functions. Total and partial C-C, O-O, H-H, C-O, O-H, and C-H.
Note:  Total,
  Partial C-C,
  Partial O-O,
  Partial H-H,
  Partial C-O,
  Partial O-H,
  Partial C-H.

Figure 5b: Radial distribution functions. Partial C-O and O-H.
Note:  Partial C-O,
  Partial O-H.
In summary, we provided experimental evidence and produced an ensemble of 7,479 atomic arrangements of GO structure, which describe the pattern formations of hydroxyl and epoxy bridges in GOs. On one side, measurements of HR-TEM images and their electron diffraction has shown that GOs exhibit polycrystalline structure, like a solid material of graphene decorated with patterns of parallel lines and circles formed at atomic scale by the presence of hydroxyl and epoxy bridges, respectively. Moreover, MD calculations on equivalent GO atomic structures revealed the same pattern formations of parallel lines and circles in theoretical HR-TEM images, which agree with the GO molecular configuration and are related with the presence of hydroxyl land epoxy bridges in graphene, respectively. Hence, these results suggest that, experimentally, HR-TEM images could be formed at a large atomic-scale mainly by graphene decorated with hydroxyl and epoxy bridges. These could pull carbon atoms out of the graphene plane locally and produce boundary defects and its clusters to produce topological defects, as a possible mechanism responsible for polycrystalline structure in GO dominated mainly by carbon out-of-plane defects. This effect is a possible mechanism responsible for the polycrystalline structure observed experimentally in GOs. Theoretical and experimental results of the HR-TEM images and its polycrystalline structure induced by the adsorption of -OH and -O-atoms on graphene systems also suggest that GO nanoplatelets could play an important role in the development of low-cost graphene and oxidized graphene-based technologies.
JJP, CA, JDP, and MM initiated the project. JJP carried out the materials synthesis, microstructural characterization, and HR-TEM measurements. JJP and MM proposed the GO structures simulated here and employed MD to optimize the geometry and the energy. MM and JDP conducted MD calculations to corroborate measurements by JPP. In addition, JJP and MM discussed the characterization results and the manuscript. Furthermore, JJP, MM, MV, JDP, AG, and CA wrote the manuscript with input from JJP and MM.
The authors declare no competing financial interests.
The datasets used and/or analysed during the current study available from the corresponding author on reasonable request.
This work was funded in part by Universidad del Quindío and MinCiencias project SGR BPIN: 2020000100600 internal code 1112.