
Research & Reviews: Journal of Material Sciences
 Menu
MenuISSN:2321-6212
ISSN:2321-6212
Kuo Yang1, Miaomiao Wang1,2, Mingxing Guo1*, Hu Wang2, Yongda Mo2, Fang Liu2, Yunpeng Wang2, Huafen Lou2
1 State Key Laboratory for Advanced Metals and Materials, University of Science and Technology Beijing, Beijing, China
2 Chinalco Research Institute of Science and Technology Co., Ltd, Beijing, China
Received: 07-Dec-2024, Manuscript No. JOMS-24-154411; Editor assigned: 11-Dec-2024, Pre QC No. JOMS-24-154411 (PQ); Reviewed: 25-Dec-2024, QC No. JOMS-24-154411; Revised: 09-Mar-2026, Manuscript No. JOMS-24-154411 (R); Published: 16-Mar-2026, DOI: 10.4172/2321-6212.14.1.001
Citation: Yang K, et al. Coupling Effects of Grain Structure, Precipitates and Solid Solubility on the Hot Deformation Behaviors of Cu-3.18 wt% Ti Alloy. RRJ Mater Sci. 2026;14:001.
Copyright: © 2026 Yang K, et al. This is an open-access article distributed under the terms of the Creative Commons Attribution License, which permits unrestricted use, distribution and reproduction in any medium, provided the original author and source are credited.
Visit for more related articles at Research & Reviews: Journal of Material Sciences
The poor hot workability of Cu-Ti alloys severely restricts the further improvements of properties and applications. In this work, the coupling effects of grain structure, precipitates and solid solubility on the hot deformation behaviors of Cu-3.18 wt% Ti alloy were deeply studied. Our results show that based on the obtained constitutive equation and thermal activation energies, the corresponding hot workability maps of alloy can be established and used to guide the designation of hot working process. The complex interactions that occur between dislocation and precipitates lead to the differences in Dynamic Recrystallization (DRX) and precipitation for the changed strain rates and temperatures. The deformability can be improved by coupling control of DRX and dynamic precipitation. The mechanisms of hot deformation and microstructure evolution, including grain structure, precipitates, and solid solubility of Ti in the matrix during the hot deformation, have been proposed. Our results provide fundamental insight into the dynamic recrystallization, precipitation and coordinated deformation of Cu-Ti alloys with poor deformability, as a function of hot strain.
Cu-Ti alloys; Grain structure; Precipitation; Solid solubility; Deformation mechanism
Cu-Ti alloys with superior stress relaxation resistance and ultra-high strength are widely used in the field of current-carrying components [1]. However, the poor plasticity and hot workability of Cu-Ti alloys severely restrict the further enhancements of properties and applications. For example, Liao et al. directly adopted solid solution+aging treatment on as-cast Cu-Ti alloy due to its poor hot workability and the microhardness and conductivity only reached 261 HV and 20.4% IACS, respectively. The reasons for these are as follows, during solid solution+aging treatment, the thermal effect is the sole driving force for precipitate nucleation and inadequate and slow precipitation behavior ultimately limits the synergistic improvement of strength and conductivity. However, if deformation can be introduced before aging treatment, the coupled action of thermal effect and strain can provide the higher driving force for precipitate nucleation and the strength and conductivity can be also further enhanced greatly. Thus, the poor hot workability of Cu-Ti alloys hinders the enhancements of their mechanical and electrical properties and then limiting their wider applications.
Dynamic Recrystallization (DRX) significantly influences the deformation behaviors of metallic materials. Consequently, many researchers have focused on enhancing the workability of the metallic materials by controlling DRX. Wang et al. also prepared a CrCoNi alloy with different grain-distributions through controlling annealing process and the alloy demonstrated an impressive uniform elongation of 20% and a remarkable strength of 1200 MPa. Li et al. developed a Cu-4.5 wt% Al alloy with a gradient structure by controlling DRX behaviors. Compared to traditional homogeneous coarse grains samples, the formation of gradient structures of the alloy achieved higher yield strength and good uniform elongation. Therefore, effectively controlling the DRX behaviors of alloys can be better used to synergistically improve strength and ductility [2].
Dynamic precipitation also significantly influences deformation behaviors. Numerous studies have reported the impact of dynamic precipitation processes on deformation behaviors and the corresponding deformation mechanisms have also been widely reported. For example, Xu et al. developed a Cu-Ti-Fe alloy by Electric Current Pulse (ECP) aging treatment, many nanoscale metastable phases rapidly precipitated during the ECP aging treatment, then, the solid solubility of the matrix rapidly decreased, thereby hindering the formation of discontinuous phases in subsequent aging treatment. Ultimately, the ECP treatment significantly enhances the mechanical properties of the alloy. The duplex microstructure has recently been employed to break the strength-ductility trade-off dilemma. For example, Yang et al. developed a novel Cu-Fe-C alloy by adding C element and further enhanced the coordinated deformability of the alloy by inducing the martensite transformation. Consequently, according to the above background, if the DRX behaviors and precipitation processes can be effectively controlled and utilized, the coordinated deformability of the Cu-Ti alloys should be further improved greatly. Accordingly, in order to reveal the related high deformability mechanisms of Cu-Ti alloys during the thermal deformation, it is imperative to systematically study the DRX and precipitation behaviors at first [3].
As mentioned above, it is essential to explore the hot-deformation behaviors of Cu-Ti alloys to lay the foundation for further improving the properties of the alloys. Thus, in this study, constitutive equations and processing maps have been also established to predict the hot deformation behaviors. And the optimized ranges of temperature and strain rate have been finally confirmed via hot rolling experiments. More importantly, the coupling effects of grain structure, precipitates and solid solubility on the hot deformation behaviors of Cu-3.18 wt% Ti alloy are systematically discussed. Ultimately, the deformation mechanisms have been also revealed in this paper.
Experimental
The Cu-3.18 wt% Ti alloy was produced using a vacuum medium-frequency induction furnace. Then, the as-cast alloy was homogenized at 800â?? for 12 h. Hot compression tests were performed in a Gleeble-3500 thermomechanical simulator unit. After 70% deformation, the deformed specimens were subjected to water quenching treatment. And Figure 1 displays a detailed flowchart of experiment.
Deformed regions of the samples were used for microstructural observation. For the preparation and characterization methods of Optical Metallography (OM), Scan Electron Microscopy (SEM) and Transmission Electron Microscope (TEM) for the samples. Particularly, Electron Back-Scattered Diffraction (EBSD) samples were conducted in a SEM with an C-nano EBSD detector [4].
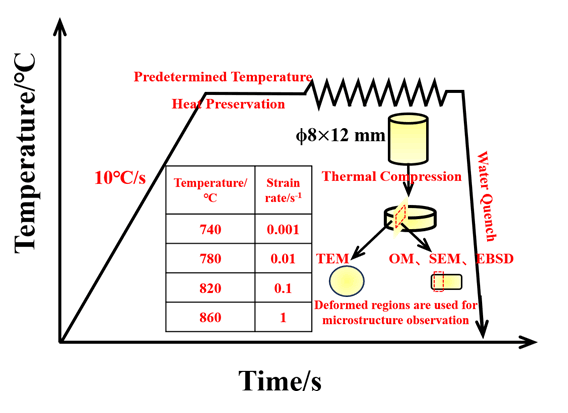
Figure 1. The flowchart of experiment for the Cu-3.18 wt% Ti alloy.
Microstructural evolution before hot deformation
Figure 2(a) displays a SEM image of as-cast alloy and an enlarged image of the corresponding position is shown in Figure 2(c). The as-cast alloy exhibits microstructures with different contrasts. To analyze the composition of the as-cast microstructure, the EDS analysis of microstructures with different contrasts are illustrated in Figure 2(b, d, f), respectively. The atomic ration of Cu and Ti in the black microstructure (point A) is closed to 4:1, indicating that the microstructure may be β-Cu4Ti phase. The gray microstructure (point B) is the α-Cu matrix containing a certain Ti content, while the white microstructure (point C) is a pure Cu phase (Ti content is much lower than that of the α-Cu matrix). Figure 3 displays the XRD results of as-cast alloy. The XRD pattern shows diffraction peaks for the (105) and (115) peaks of the β-Cu4Ti phase, suggesting that the β-Cu4Ti phase is the primary phase. Consequently, the as-cast microstructure is composed of β-Cu4Ti phase, pure Cu phase and α-Cu matrix. In addition, the distribution characteristics of as-cast microstructure can be summarized as follows: Based to the phase diagram of Cu-Ti alloys, when the Ti content is 3.18wt%, the as-cast microstructure is composed of β-Cu4Ti phase and α-Cu matrix at room temperature. Nevertheless, the low cooling rate during solidification and high Ti concentration at grain boundaries directly lead to the segregation of the β-Cu4Ti phase and α-Cu at grain boundaries. Therefore, the Ti content of the final segregated microstructure is much lower than that of the α-Cu matrix due to the formation of β-Cu4Ti phase, ultimately leading to the formation of pure Cu phase. Figure 2(e) displays a SEM image of homogenization-treated alloy, the segregation has been basically eliminated. However, a small amount of pure Cu phase still can be found in the homogenization- treated alloy, which should provide a positive impact on enhancing the hot deformability [5].
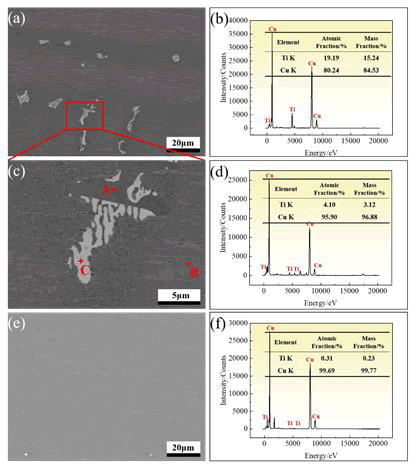
Figure 2. Microstructural evolution before hot deformation of the alloy, (a, c) SEM image of as- cast alloy, (b) EDS results of point A in (c), (d) EDS results of point B in (c), (f) EDS results of point C in (c), (e) SEM image of homogenization-treated alloy.
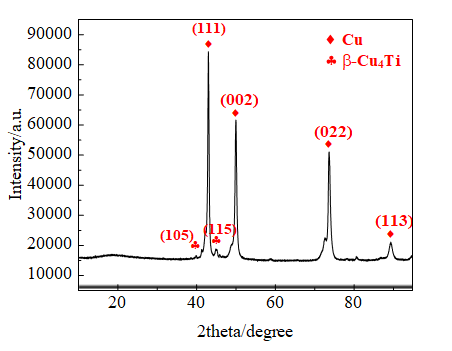
Figure 3. XRD results of as-cast alloy.
Hot compression behaviors
Figure 4 displays the morphology of samples after hot compression. The samples hot compressed at the temperature of 860â?? with strain rates exceeding 0.01 s-1 has been completely broken. And only the sample compressed at 740â?? with strain rates of 0.001 and 0.01 s-1, no crack can be found. Figure 5 displays the true stress-strain curves under different conditions. The stress decreases with the increases of the hot compression temperature and the decrease of strain rate. And the stress increases rapidly and reach a peak at the early stage of hot compression. Then the flow stress decreases until the steady stage. Therefore, the flow behaviors can be regarded as the competition between the work hardening and dynamic softening [6].
Figure 6 display the peak stress curves of the alloy under different conditions. The peak stress is 82.5 MPa under the condition of 740â??, 0.001 s-1, as the strain rate increases to 1 s-1, the value increases to 214.1 MPa. Furthermore, the peak stress is 20.1 MPa under the condition of 860â??, 0.001 s-1, while it is also increases to 61.6 MPa under the condition of 860â??, 1 s-1. Both the increase of the strain rate and the decrease of the temperature can hinder dislocation annihilation, ultimately leading to the hardening behavior of the alloy. Accordingly, the flow stress is changed greatly with the changes of hot compression conditions. Additionally, the microstructure evolution, including the evolutions of grain structure, precipitates and solid solubility should be also changed greatly with the changes of hot compression conditions. And the corresponding results will be provided and discussed in detail [7].
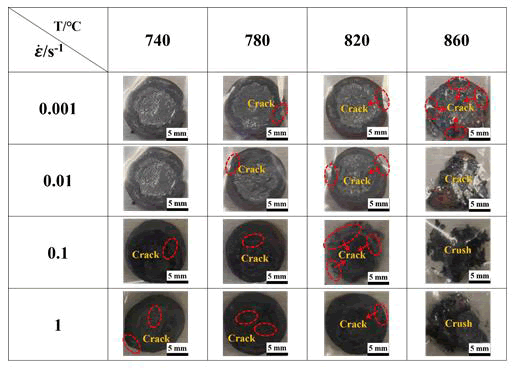
Figure 4. Morphology of the samples hot deformed under different conditions.
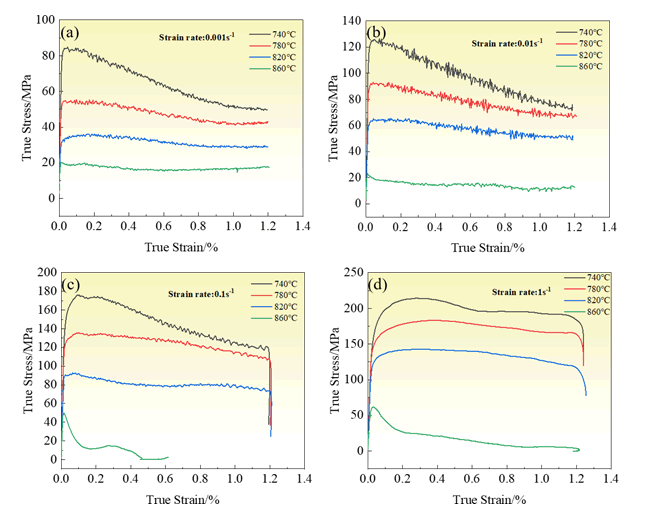
Figure 5. True stress-strain curves of the alloy hot deformed under different conditions, (a) 0.001 s-1, (b) 0.01 s-1, (c) 0.1 s-1, (d) 1 s-1.
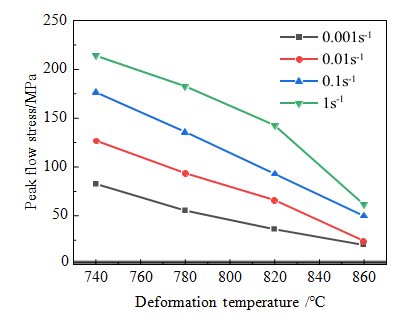
Figure 6. Peak flow stress curves of the alloy hot deformed under different conditions.
Establishment of constitutive models
To further reveal the relationship between the stress and hot compression conditions and better predict the hot deformation behaviors, constitutive equations should be established based on the flow behaviors of Cu-3.18 wt% Ti alloy. Three theoretical models were used to establish the constitutive equation as shown in below:
where A, A1, A2 are structural factors (s-1), �� is the stress (MPa), ��Ã? is the strain rate (s-1), n and n1 are the stress exponents, β is a constant, �� is the stress-level parameter (��=β/n1) (MPa-1), Q is the thermal activation energy (kJ/mol), T is the temperature (K), R is the gas molar constant (8.314 J/(molâ??k)). The relationship between the stress and hot compression conditions can be descripted by Zener-Hollomon (Z):
The maximum load could be predicted using the constitutive equations. Additionally, due to the fragmentation of the samples hot compressed at the temperature of 860â?? with strain rates above 0.01 s-1, the peak stress-strain data at 740â??, 780â?? and 820â?? were selected to establish the constitutive equations. For Eq. (1-3) and the corresponding equations can be expressed as follows:
Therefore, Figure 7(a) and (b) shows the ������Ã? − ������ and ������Ã? − �� relation curves for the Cu-3.18 wt% Ti alloy at the peak stress, respectively. Then both n1 and β can be obtained, respectively and the average values were taken. Therefore, n1=5.4, β=0.06 Mpa-1 and α=β/n1=0.0105 MPa-1. The relationship between Q, temperature and strain rate can be expressed as the following equation:
Then, the ������Ã? − ����[������â??(����)] and ����[������â??(����)] − 1000/�� relation curves are illustrated in Figure 8(a) and (b), respectively, and both the S and n can also be obtained, respectively. The average values of slopes were taken. Therefore, S=12.37, n=4.19. As a result, the final Q was calculated as 430.9 kJ/mol for the Cu-3.18 wt% Ti alloy at the peak stress. Additionally, compared to Cu-2.2 Ti-0.1 Zr (wt.%) (Q=325.67 kJ/mol) and Cu-2.2 Ti-0.1 Zr-0.5 Mg (wt.%) (Q=344.03 kJ/mol) alloys, the Cu-3.18 wt% Ti alloy tend to be more difficult to deform at higher temperature. Consequently, as the Ti content increases, it gets harder to deform the material. Furthermore, according to Eq. (4), the following equation can be obtained:
Accordingly, the Z value can be calculated by the Q value under conditions (Table 1). Ultimately, the ������- ����[������â??(����)] relation curve is illustrated in Figure 9 and a good fit between the stress and the Z can be confirmed by the high value of regression coefficient (0.995). Then, both the A and n value can be obtained from the slopes of the fitting curve, respectively. Therefore, A=1.74 × 10¹⁹ s-1, n=4.184. It can be found that the n value here is close to the n value (n=4.19) calculated via Eq. (8), with an error of only 0.14% [8].
As mentioned above, the final constitutive equation for the Cu-3.18 wt% Ti alloy at the peak stress is as follows:
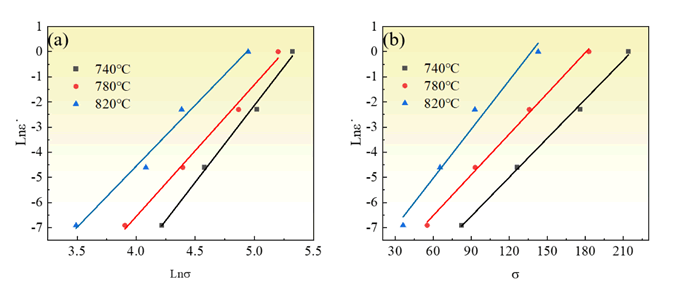
Figure 7. The corresponding fitted curves of the alloy hot compressed under different conditions,
(a) ������Ã? − ������, (b) ������Ã? − ��.
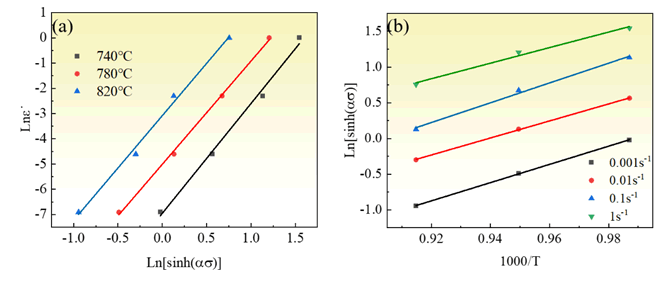
Figure 8. The corresponding fitted curves of the alloy hot compressed under different conditions,
(a) ������Ã? − ����[sinh(����)], (b) ����[sinh(����)] − 1000/��
|
Z/s-1 |
740°C |
780°C |
820°C |
|
0.001 |
1.647 × 10¹⁹ |
2.359 × 10¹⁸ |
3.897 × 10¹⁷ |
|
0.01 |
1.647 × 10²⁰ |
2.359 × 10¹⁹ |
3.897 × 10¹⁸ |
|
0.1 |
1.647 × 10²¹ |
2.359 × 10²⁰ |
3.897 × 10¹⁹ |
|
1 |
1.647 × 10²² |
2.359 × 10²¹ |
3.897 × 10²⁰ |
Table 1. The Z values of the alloy hot compressed under different conditions.
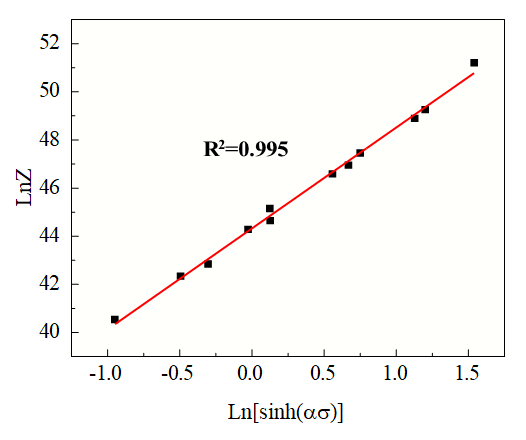
Figure 9. The fitted relationship curve between ������ and ����[������â??(����)] for the hot compressed Cu-3.18 wt% Ti alloy.
Establishment of processing maps
For the hot deformation of metallic alloys with poor deformability, it is crucial to obtain the appropriate thermomechanical processing parameters. Considering the fact that the establishment of hot processing map has been believed an effective method to determine the appropriate thermomechanical processing parameters. Prasad et al. also once proposed a method for establishing processing map. The total power (P) is decomposed into the dissipative content (G) and dissipative co-content (J). The relationship is as follows:
The relationship between G and J can be established by the strain rate sensitivity parameter (m), as expressed in Eq. (12).
For ideal linear power dissipater, m=1, Jmax=��Ã? â??��/2. However, for a non-linear power dissipater, the capability of power dissipater can be expressed by the efficiency of power dissipatin η):
The instability criterion is as follows:
The relationship between the ������ and ������� can be expressed by the follwing equation:
Where a, b, c, d are constants related to the material. The fitting curves between the ������ and ������� under the different conditions are shown in Figure 10. According to the Eq. (15) and Eq. (12), the m value can be obtained as follows:
Therefore, the values of �� + 1�2��/(�� + 1) and ln [��/(�� + 1)] can be also obtained according to the Eq.(16). According to Eq. (14), the ��(��� ) can be also exrssed as follows:
Finally, the values of b, c, d can be obtained by fitting relationship curves between ln [��/(�� + 1)] and ������� under different strain conditions (Figure 11). As mentioned above, the power dissipation maps of the alloy under different conditions can be established based on the obtained efficiency of power dissipation (��) (Figure 12). The regions with the higher �� values can be often selected as the areas for optimizing metallic materials processing parameter during hot deformation process. However, sometimes these regions are also not necessarily safe processing areas. Therefore, it is imperative to combine the instability parameters (��(��� )) to further determine the appropriate thermomechanical processing rangs [9].
According to Eq. (17), the instability maps can be expressed by plotting the instability values in the strain rate and temperature range (Figure 13). And the region where the “��(��Ã? )” is negative can be believed as the instability region. The processing maps can be further obtained by merging both maps of instability and efficiency. Ultimately, Figure 14 shows the processing maps of Cu-3.18 wt% Ti alloy under the different strains (ε=0.2, 0.5, 0.8, 1.1) and the grey shaded regions are the domains where the Cu-3.18 wt% Ti alloy flow is microstructurally unstable. At the true strain of 0.2, the two different regions of 740-780â??, 0.001-0.018 s-1, 815-820â??, 0.223-1 s-1 belong to the deformation stability domains. As the true strain is increased to 0.5, the stability region is shifted to 740-820â??, 0.001-0.011 s-1. And if the true strain is further increased to 0.8, the stability range is shifted to 740-778â??, 0.001-0.018 s-1, 810-820â??, 0.223-1 s-1. And further increasing true strain to 1.1, the deformation stability regions mainly distribute in the domains of 740-770â??, 0.001-0.024 s-1, 808- 820â??, 0.165-1 s-1. Accordingly, the appropriate thermomechanical processing condition of the alloy should be distributed in the domains of 740-770â??, 0.001-0.011 s-1.
Additionally, based on the appropriate thermomechanical processing condition obtained from the processing maps, we conducted hot rolling experiments on the Cu-3.18 wt% Ti alloy under different conditions to check whether the obtained processing maps are reasonable. Therefore, Figure 15 shows the stereoscopic microscopic morphology of the hot-rolled samples prepared by the different conditions. Under the conditions of 780â?? and 820â??, many cracks can be observed in hot rolled samples regardless of the strain rate. However, smooth surfaces only appear on the sample hot rolled at 740â??,0.001 s-1 and 740â??, 0.01 s-1, which is consistent with the above results obtained from the processing maps. Thus, the establishment of processing maps can directly provide suitable hot deformation conditions due to the higher accuracy of the results.
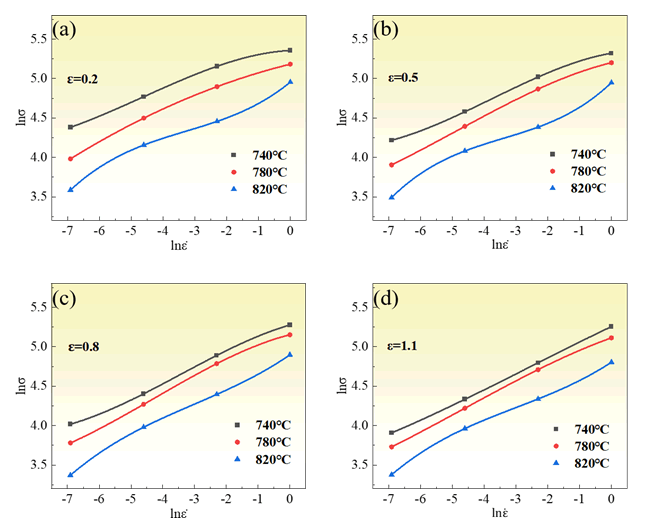
Figure 10. The fitted curves between ������ and ������� , (a) ���=0.2; (b) ���=0.5; (c) ���=0.8; (d) ���=1.1.
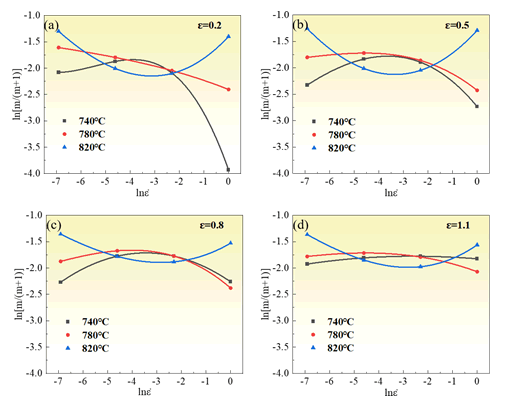
Figure 11. The fitted curves between ln [��/(�� + 1)] and ������Ã? , (a) ε=0.2; (b) ε=0.5; (c) ε=0.8; (d) ε=1.1.
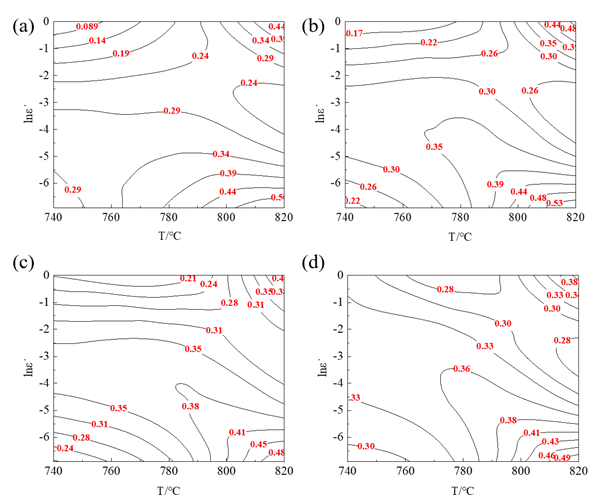
Figure 12. Power dissipation patterns of the samples compressed with the different strains, (a) ε=0.2; (b) ε=0.5; (c) ε=0.8; (d) ε=1.1.
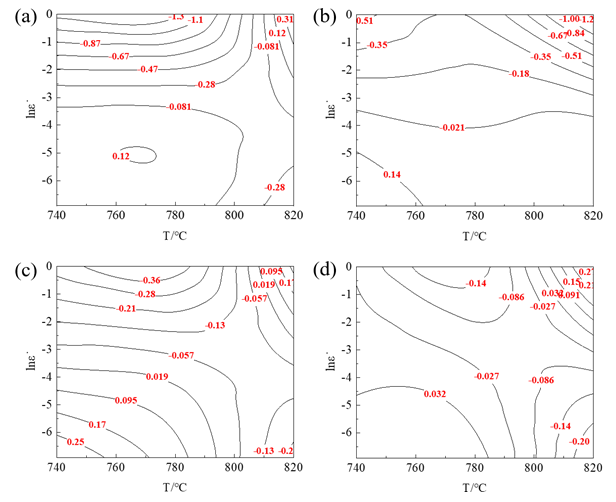
Figure 13. Instability maps of the samples compressed with the different strains, (a) ε=0.2; (b) ε=0.5; (c) ε=0.8; (d) ε=1.1.
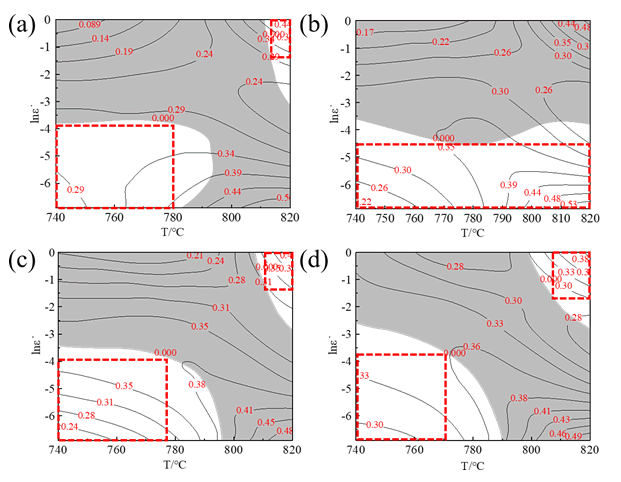
Figure 14. Processing maps of the Cu-3.18 wt% Ti alloys compressed with the different strains, (a) ε=0.2; (b) ε=0.5; (c) ε=0.8; (d) ε=1.1.
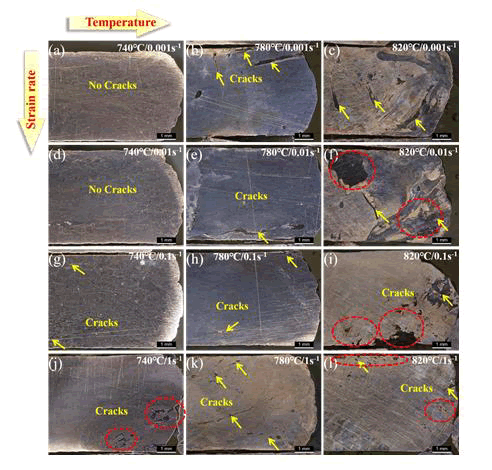
Figure 15. Stereoscopic microscopic morphology of the hot-rolled samples under various conditions, (a) 740â??, 0.001 s-1; (b) 780â??, 0.001 s-1; (c) 820â??, 0.001 s-1; (d) 740â??, 0.01 s-1;(e) 780â??, 0.01 s-1; (f) 820â??, 0.01 s-1; (g) 740â??, 0.1 s-1; (h) 780â??, 0.1 s-1; (i) 820â??, 0.1 s-1; (j) 740â??, 1 s-1; (k) 780â??, 1 s-1; (l) 820â??, 1 s-1.
Microstructural evolution during hot deformation
The flow behaviors of the alloy during hot compression process are closely related with the microstructural evolution and the evolutions of grain structure, precipitates and solid solubility should be also changed greatly with the changes of hot compression temperatures and strain rates. Figure 16 shows the OM images of samples hot compressed at different conditions. Both the dynamic recrystallization grains and deformation microstructure can be observed in the samples hot compressed at 740â??. With the increase of the strain rate, the deformation microstructure exhibits the fiber distribution characteristics and the deformation microstructure gradually becomes the main microstructure characteristics, especially for the case of strain rate 1 s-1. As the hot compression temperature is increased to 780â?? and 820â??, DRX has been occurred in the entire alloy matrix. To further explore the evolution of grain structure, Figure 17 displays the EBSD results. In the Inverse Pole Figure (IPF) maps, various colors represent different grain orientations. Additionally, the orientation difference within the grains is used to distinguish recrystallized grains, sub-structure and deformation structure. The sub-structure is commonly considered to be an evolved deformation microstructure, that is, the reorganization of a random network of dislocations. In the Recrystallization Fraction (RF) maps, the blue area represents recrystallized microstructure, while the yellow and red areas represent substructures and deformed microstructure, respectively. It is worth nothing that the statistical data for the average misorientation angles and dynamic recrystallization fraction of the alloy under the hot compression conditions of 820â??, 0.001 s-1 and 820â??, 1 s-1, are provided in the supplementary materials, Figure 17 only shows images with the same magnification. Under the hot compression condition of 740â??, 0.001 s-1, the volume fraction of deformed microstructure and substructure is 25.59% and 48.29%, respectively, while the value of dynamically recrystallized grains is 26.12%, as a result, the substructure is the main microstructure characteristics, as shown in Figure 17(q). With the increase of strain rate, the volume fraction of deformed microstructure is increased from 25.59% to 46.33% and the volume fraction of dynamically recrystallized grains and substructure is decreased to 15.09% and 38.58%, respectively and the deformed microstructure is the main microstructure characteristics for this temperature deformation (740â??). Additionally, fine-equiaxed grains have been formed and distributed along the original grain boundaries of alloys hot compressed at the temperature of 740â??, indicating the formation of DRX grains even the low deformation temperature used. As the hot compression temperature increases to 820â??, the volume fraction of deformation microstructure and substructure is decreased rapidly, while the volume fraction of dynamically recrystallized grains is significantly increased. Under the hot compression condition of 820â??, 0.001 s-1, the volume fraction of DRX grains is increased to 72.92%, while the deformed microstructure and substructure is decreased to 4.16% and 22.92%, respectively. As the strain state increases to 1 s-1, the volume fraction of deformed microstructure and substructure is increased to 6.88% and 35.83%, respectively. On the contrary, the volume fraction of DRX grains is decreased to 57.29% (Figure 17q). The misorientation angle of GB in the samples under the different hot compression conditions is shown in Figure 17. At 0.001 s-1, with the increase of the temperature, the average size of DRX grains is increased from 4.45 μm to 20.67 μm. Similarly, at 1 s-1, with the increase of the temperature, the average size of DRX grains is increased from 3.05 μm to 14.19 μm. While for the cases deformed at the temperature of 740°C, with the increase of the strain rate, the average size of DRX grains is decreased from 4.45 μm to 3.05 μm. Similarly, for the cases deformed at the temperature of 820°C, with the increase of the strain rate, the average size of DRX grains is decreased from 20.67 μm to 14.19 μm.
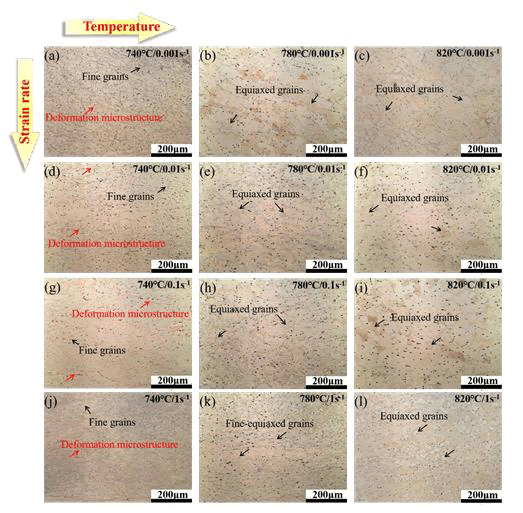
Figure 16. OM images of samples hot compressed under the different conditions, (a) 740â??, 0.001 s-1; (b) 780â??, 0.001 s-1; (c) 820â??, 0.001 s-1; (d) 740â??, 0.01 s-1; (e) 780â??, 0.01 s-1; (f) 820â??, 0.01 s-1; (g) 740â??, 0.1 s-1; (h) 780â??, 0.1 s-1; (i) 820â??, 0.1 s-1; (j) 740â??, 1 s-1; (k) 780â??, 1 s-1; (l) 820â??, 1 s-1.
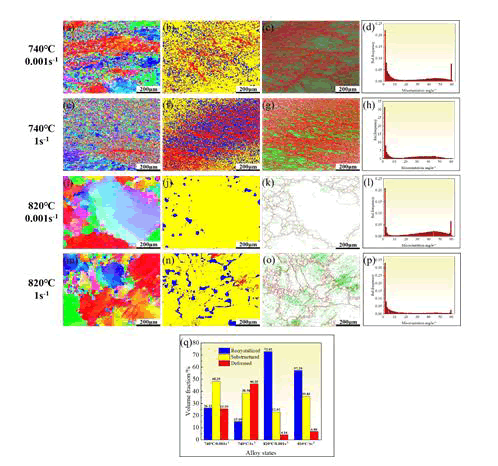
Figure 17. EBSD characterization of samples hot compressed under different conditions, (a)-(d) 740â??, 0.001 s-1; (e)-(h) 740â??, 1 s-1; (i)-(l) 820â??, 0.001 s-1; (m)-(p) 820â??, 1 s-1; (q) Fraction of different types of microstructures.
The precipitation and distribution of phase and solid solubility also have crucial effects on the hot deformation behaviors. Therefore, Figure 18 show the SEM-BSE images of samples hot compressed at the temperatures of 740â?? with the strain rates of 0.001 s-1 and 1 s-1. It can be seen that many lamellar phases appear in the samples hot compressed at 740â?? with the strain rates of 0.001 s-1 (Figure 18(a, c, e)). Moreover, the white pure Cu phase and DRX grains can also be found in the samples. EDS analysis on the point A was done, (Figure 18(e) and (g)). The atomic ratio of Cu/Ti is close to 4:1, suggesting that the lamellar phase is the β-Cu4 Ti phase. Furthermore, the lamellar β-Cu4 Ti phase can coordinate deform with the Cu matrix. Thus, no cracks can be observed in the sample hot compressed under this condition of 740â??, 0.001 s-1 (Figure 15). As the strain rate increases to 1 s-1, the SEM-BSE images of samples are illustrated in Figure 18(b, d, f). In addition to the white pure Cu phases and dynamically recrystallized fine grains, spherical precipitates can also be observed in SEM-BSE image (Figure 18(f)). To determine the composition of spherical precipitates observed in SEM-BSE image, the EDS analysis of point B of Figure 18(f) is illustrated in Figure 18(h). The atomic ratio of Cu/Ti is close to 4:1, suggesting that the lamellar phase is also be the β-Cu4 Ti phase. As the hot compression temperature increases to 820â??, in addition to the white pure Cu phases and dynamically recrystallized grains, basically no precipitates can be found in the SEM-BSE image of the samples hot compressed at the temperature of 820°C (Figure 19). The hot compression temperature is close to the solution temperature of the Cu-3.18 wt% Ti alloy, thus, the coarse phases have been fully dissolved into the matrix. Additionally, the evolution characteristics of grain structure can also be clearly presented through SEM-BSE images, which is consistent with the above explanation as shown in Figure 17.
To further determine the composition and distribution of phases, solid solubility and distribution characteristics of dislocations under different hot compression conditions, a detailed TEM characterization of the hot compressed samples was done. Figure 20 show the TEM images of specimen hot compressed with the condition of 740â??, 0.001 s-1. There are many rod-shaped phases in the matrix (Figure 20(a)) and the SAED pattern and EDS analysis of rod-shaped phases are illustrated in Figure 20(b) and Figure 20(e), respectively. As a result, these rod-shaped phases were confirmed to be β-Cu4 Ti phase, which also further confirms that the stable β-Cu4 Ti phase have been formed in the samples after hot compression at 740°C, 0.001 s-1, and the lamellar phases observed in Figure 18(e) should be the same as this phase. And a small number of dislocation lines can also be found in the matrix (Figure 20(c)). Additionally, in addition to the micrometer-sized lamellar phases, we still have no idea whether nano-scale precipitates exist in the matrix or not. Thus, Figure 20(d) shows the HRTEM image around the lamellar β-Cu4 Ti phase and corresponding FFT image, with only Cu matrix spots appearing in the FFT image, indicating that no nano-precipitate has been formed around the lamellar β-Cu4 Ti phase. Furthermore, the solid solubility has been also changed greatly with the formation of precipitates. Figure 20(f) shows the EDS analysis of the Cu matrix, the solid solubility of Ti in the matrix is only 0.68 wt% under the condition of 740â??, 0.001 s-1. Considering the fact that Ti atoms exist in a solid solution form as substitutional atoms within the Cu matrix, the Cu matrix around the lamellar β-Cu4 Ti phase has been purified due to the formation of lamellar β-Cu4 Ti phases, which makes dislocations slip easier in these regions and finally enhancing the coordinated deformability of the Cu-3.18 wt% Ti alloy under this condition.
Figure 21 display TEM images of specimens hot compressed under the condition of 740â??, 1 s-1. The hot deformation time is decreased with the increase of strain rate, which leads to dislocation entanglement more easily and a rapidly increase in the density of dislocations, thus, resulting in the formation of a lots of dislocation cells. Additionally, with the increase of strain rate, no lamellar phases can be found and only spherical precipitates with an average size of 300 nm appear in the Cu matrix under the condition of 740â??, 1 s-1. Figure 21(b) displays the SAED image of spherical precipitates and the corresponding EDS analysis on the spherical precipitates is also shown in Figure 21(e). The spherical phases are still β-Cu4 Ti phases. Accordingly, with the increase of strain rate, β-Cu4 Ti phases are still the main precipitates. In order to further characterize the domains around the spherical β-Cu4 Ti phase, the HRTEM image around the spherical β-Cu4 Ti phase and corresponding FFT image are illustrated in Figure 21(d). No spots of nano-precipitates can be observed in the FFT image, indicating that no nano-precipitate has been formed around the spherical β-Cu4 Ti phases. Figure 21(f) shows the EDS analysis of the Cu matrix, the solid solubility of Ti in the matrix has been increased to 1.53 wt% under the condition of 740â??, 1 s-1, which is corresponding to the fact of no nano precipitates observed in the alloy matrix. Therefore, the increase in strain rate directly results in the occurrence of dislocation entanglement and formation of many dislocation cells. And the increased solid solubility of Ti in the matrix also leads to severe lattice distortion, which further hinders the movement of dislocations, ultimately decreasing the coordinated deformability of the Cu-3.18 wt% Ti alloy under this condition. As mentioned above, in addition to the significant effect of DRX structure, the precipitation and distribution of phase, and solid solubility also have a crucial impact on the deformation behaviors of the alloys. Especially for deformation at lower temperature and lower strain rate, where the DRX behavior is not obvious, the formation of lamellar β-Cu4 Ti phases can purify the matrix and enhance the ability of dislocations to slip around them, ultimately enhancing the hot deformability of the Cu-3.18 wt% Ti alloy. Based on these, it can be seen that effectively controlling and utilizing lamellar β-Cu4 Ti phases is beneficial for enhancing the coordinated deformability of the alloy.
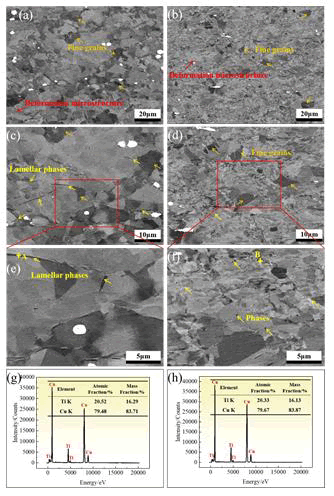
Figure 18. SEM-BSE images and EDS analysis of samples hot compressed under different conditions, (a, c, e) SEM-BSE images of specimens hot compressed at 740°C, 0.001 s-1; (b, d, f) SEM-BSE images of specimens hot compressed at 740°C, 1 s-1; (g) EDS analysis of point A in (e); (h) EDS analysis of point A in (f).
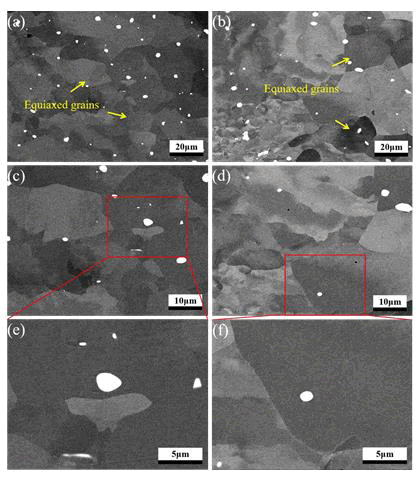
Figure 19. SEM-BSE images of samples hot compressed under different conditions, (a, c, e) 820°C, 0.001 s-1; (b, d, f) 820°C, 1 s-1.
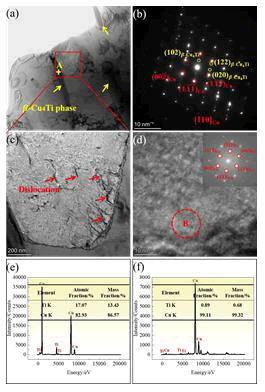
Figure 20. TEM micrographs of specimens hot compressed at 740â??, 0.001 s-1, (a, c) BF images; SAED pattern of (a); (d) HRTEM image around the β-Cu4 Ti phase and corresponding FFT image; (e) EDS analysis of point A (phase) in (a); (f) EDS analysis of point B (matrix) in (d).
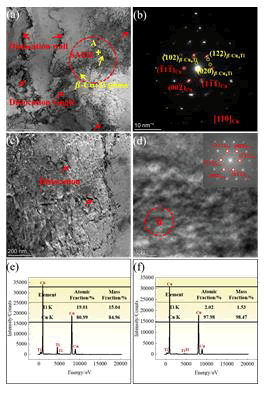
Figure 21. TEM micrographs of specimens hot compressed at 740â??, 1 s-1 (a, c) BF images; (b) SAED pattern of (a); (d) HRTEM image around the β-Cu4 Ti phase and corresponding FFT image; EDS analysis of point A (phase) in (a); (f) EDS analysis of point B (matrix) in (d).
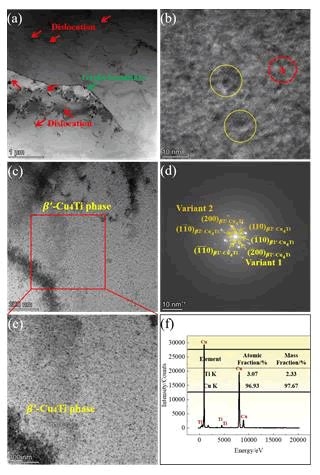
Figure 22 displays the TEM images of samples hot compressed at 820°C, 0.001 s-1. As the temperature is increased to 820°C, the recovery and DRX of the samples have occurred with the increase of temperature. And many dislocation lines are still distributed at the matrix and grain boundaries (Figure 22(a)). Additionally, compared to the deformation conditions of 740°C, no micrometer-sized lamellar and spherical phases can be observed under the condition of 820°C, 0.001 s-1 (Figure 22(a)). However, many nano-precipitates with an average size of 5 nm can be found in the samples hot compressed at 820°C, 0.001 s-1 (Figure 22(c, e)). To further determine the structure and composition of these nano-precipitates, the HRTEM image and corresponding FFT image of nano-precipitates are illustrated in Figure 22(b) and (d), respectively. Two variants of nano-precipitates can be also observed. And based on the indexing results, it can be found that both variants of nano-precipitates are the β'-Cu4 Ti phase. Figure 22(f) displays the EDS analysis of the Cu matrix, the solid solubility of Ti in the matrix has increased to 2.33 wt% under the condition of 820°C, 0.001 s-1. Ultimately, the formation of lots of nano-precipitates and the increase in solid solubility of Ti in the matrix hinder the movement of dislocations, ultimately decreasing the coordinated deformability.
Figure 23 show the TEM images of samples hot compressed at 820°C, 1 s-1. As the strain rate increases to 1 s-1, although DRX has been also induced in the matrix (Figure 17), lots of dislocation lines still can be found in the matrix, especially at the grain boundaries (Figure 22(a, c, e)). However, no nano-sized phases can be observed under the condition of 820°C, 1 s-1 and the corresponding SAED pattern also confirms this view (Figure 23(b)). Figure 23 shows the HRTEM image and corresponding FFT image of alloy compressed under the condition of 820°C, 1 s-1, no spots of nano-precipitates can be found in the FFT image. This indicates that when the strain rate is high, although many dislocation lines can be formed and provide stored energy and nucleation sites for the nano-precipitates, these nano-precipitates do not have sufficient time to rapidly nucleate and grow due to the higher strain rate. Additionally, Figure 23(f) shows the EDS analysis of the Cu matrix, the highest solid solubility (3.1 wt%) of Ti in the matrix can be obtained under the condition of 820°C, 1 s-1. Ultimately, the high-density dislocations and high solid solubility directly lead to the poor hot workability of the Cu-3.18 wt% Ti alloy.
Figure 22. TEM micrographs of specimens hot compressed at 820â??, 0.001 s-1, (a, c, e) BF images; (b) HRTEM image; (d) Corresponding FFT image of (b); (f) EDS analysis of point A (matrix) in (b).
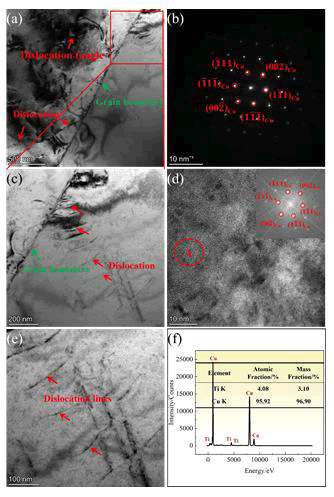
Figure 23. TEM micrographs of specimens hot compressed at 820â??, 1 s-1, (a, c, e) BF images; (b) SAED pattern of (e); (d) HRTEM image and corresponding FFT image; (f) EDS analysis of point A (matrix) in (d).
Evolution mechanism of grain structure
As mentioned above, the evolution of grain structure is changed significantly with the changes of hot compression temperatures and strain rates. According to the OM, SEM and EBSD results, the DRX grains and deformation microstructure can be found simultaneously at the samples hot compressed at 740°C. And the fine-equiaxed grains have been formed at the temperature of 740°C. Therefore, according to the experimental results, the DRX can occur in the hot compressed samples under all hot deformation conditions. More importantly, dislocations play a crucial role in the DRX process. Under the hot compression condition of 740°C and 0.001 s-1, many dislocation lines are distributed in the matrix and grain boundaries, which promotes the formation of DRX. With the increase of the strain rate, the deformation microstructure exhibits a fiber distribution characteristic, and the deformation microstructure becomes the main microstructure characteristics under this low temperature deformation. Additionally, the hot deformation time is decreased with the increase of strain rate, which also leads to insufficient time for the glide of dislocations in the alloy, and lots of dislocation lines distributed in the matrix and entangled with each other to form dislocation cells (Figure 20).
As the temperature is increased to 820°C with a strain rate of 0.001 s-1, DRX has been occurred in the entire alloy matrix. Certainly, the average size of DRX grains decreases with the increase of strain rate (Figure 17), which is attributed to the short deformation time during the high strain rate hot compression. Moreover, many nano-precipitates with an average size of 5 nm can be found in the samples hot compressed at 820°C, 0.001 s-1 (Figure 22(c, e)). And the formation of nano-precipitates can restrict the movement of dislocation, leading to the further increase of number density of dislocations. With the increase of the strain rate, although lots of DRX grains can be formed, (Figure 17), many dislocation lines still can be found in the alloy matrix, especially at the grain boundaries due to the increased strain rate (Figure 23). Accordingly, both the strain rate and temperature give a significant effect on the DRX behaviors of Cu-3.18 wt% Ti alloy. To better control the DRX grains in the alloy, it is imperative to systematically analyze the related mechanisms. It is well known that a high-temperature deformation process normally leads to dynamic softening, which is achieved through various routes such as Continuous DRX (CDRX), discontinuous DRX (DDRX). CDRX mechanism is a single-step dynamic softening method, the tangled dislocations can be further rearranged and annihilated to form dislocation cells and these dislocation cells gradually transform into sub-grains with lower grain boundary misorientation. Accordingly, it can be found that the DRX that occurred with the higher strain rate, such as 1 s-1 follows the CDRX mechanism due to lots of sub-grains or dislocations cells can be found in the alloy matrix.
Compared with CDRX, it has been found that DDRX normally takes two steps, firstly stress accumulates to peak value and secondly, the formation of strain-free grains with high angle boundaries and these grains grow by absorbing strain through boundary bulging. To further reveal the DRX mechanisms of the Cu-3.18 wt% Ti alloy during the hot deformation, TEM results can be also used to analyze them. Based on them, many dislocations are distributed at the grain boundaries and the regions with high number density of dislocations have been formed through migration of dislocation during the lower strain rate hot deformation (Figure 22). The regions with high number density of dislocation can promote the local migration of the grain boundaries. Finally, DRX grains can be formed around the high angle grain boundaries at first. Therefore, with the decrease of strain rate from 1 s-1 to 0.001 s-1, the DRX mechanism of Cu-3.18 wt% Ti alloy should be changed from the CDRX mechanism to the DDRX mechanism.
Evolution mechanism of precipitates and solid solubility of Ti in the matrix
In addition to the effect of DRX, the precipitation and distribution of phase and solid solubility of Ti in the matrix also play a crucial role in the hot deformation process of the alloy. Thus, it is necessary to explore the evolution mechanism of precipitates and solid solubility of Ti in the matrix. Many studies have reported the precipitation behaviors of Cu-Ti alloys during isothermal aging treatment. Based on them, the maximum strength contribution is achieved as the appearance of the coherent and metastable β'-Cu4 Ti phase. The metastable β'-Cu4 Ti phase can be transformed into the lamellar β-Cu4 Ti phase after long time over-aging treatment. However, several mechanisms have been reported for the genesis of the β-Cu4 Ti cellular colonies. And the “pucker” mechanism of β-Cu4 Ti phases can be considered as nucleation method of β-Cu4 Ti phases at grain boundaries. Additionally, Fonda and Shiftlet et al. have characterized the interfaces of the β-Cu4 Ti cellular colonies. At the higher temperature, a classic Widmanstatten morphology can be formed. Moreover, Ecob et al. have also reported the Widmanstatten plates in the vicinity of the grain boundaries can improve the formation of β-Cu4 Ti cellular colonies. Nevertheless, if deformation is used to the alloy, the nucleation characteristics of the β-Cu4 Ti phases should be different from those formed at high temperature aging. Moreover, the solid solubility of Ti in the Cu matrix should be also changed greatly with the precipitation of phases, which further has an important impact on the hot deformation process of the Cu-Ti alloys. Most importantly, to our best knowledge, the dynamic precipitation mechanism of the β-Cu4 Ti phases during the hot deformation has not yet been systematically studied. Therefore, according to the experimental results, the schematic diagram of evolution mechanism of precipitates and the solid solubility of Ti in the matrix under different conditions has been drawn, (Figure 24). Under the condition of 740°C and 0.001 s-1, due to the presence of a small number of dislocation lines distributed in the matrix and around grain boundaries, β-Cu4 Ti phases could preferentially nucleates within the matrix and at grain boundaries, (Figure 24(a)). Then, in the subsequent hot deformation processes (such as, 35% deformation), some more dislocations could be further formed and the nucleation of β-Cu4 Ti phases can be also greatly improved due to the effect of dislocations, and these already nucleated β-Cu4Ti phases have sufficient time and driving forces to rapidly grow and distribute along the deformation direction. Moreover, the solid solubility of Ti in the matrix gradually decreases with the precipitation of phases, (Figure 24(a)). After hot deformation, the lots of lamellar β-Cu4 Ti phases can be formed, Ultimately, the Ti concentration of the Cu matrix around the lamellar β-Cu4 Ti phase is greatly decreased due to the consumption of forming lamellar β-Cu4 Ti phases, which directly makes dislocations easier to slip in these regions, and finally enhancing the coordinated deformability of the alloy. Therefore, under the condition of 740°C, 0.001 s-1, the alloy can be easily deformed, as shown in the processing maps (Figure 14). Finally, lots of dislocation lines can be formed and distributed around the lamellar β-Cu4 Ti phases, as shown in Figure 20(a) and Figure 24(a).
In comparison, if the strain rate is increased to 1 s-1, the number density of dislocations can be rapidly increased, dislocations can be entangled to form dislocation cells. Moreover, β-Cu4 Ti phases can be also rapidly nucleated within the matrix and at grain boundaries. And then, in the subsequent hot deformation processes (such as, 35% deformation), although lots of dislocation cells and lines can be also found in the matrix, these already nucleated β-Cu4 Ti phases do not have sufficient time to rapidly grow. After 70% hot deformation, some more dislocation cells could be further formed, and the lower grow rate of β-Cu4 Ti phases directly results in the smaller average size of these phases due to the higher strain rate (Figure 21). Additionally, the solid solubility of Ti in the matrix has been increased due to insufficient precipitation of phases, which further hinders the movement of dislocation during hot deformation. A detailed schematic diagram of the dynamic precipitation mechanism of the alloy hot compressed under the condition of 740°C, 1 s-1, is shown in Figure 24(b).
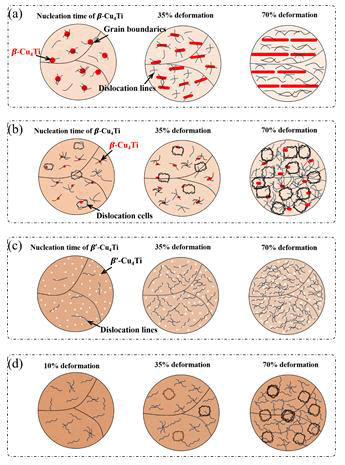
Figure 24. Evolution mechanism diagram of precipitates and the solid solubility of Ti in the Cu matrix of the Cu-3.18 wt% Ti alloy hot compressed under different conditions, (a) 740â??/0.001 s-1; (b) 740â??/1 s-1; (c) 820â??/0.001 s-1; (d) 820â??/1.
As the temperature is further increased to 820°C, both the evolution of precipitates and solid solubility of Ti in the matrix are changed greatly with the change of strain rate. Under the condition of 820°C, 0.001 s-1, many nano-precipitates can be found in the matrix due to the lower strain rate. With the increase of deformation (such as, 35% deformation), these nano-precipitates can further restrict the movement of dislocation. Moreover, these dislocations within the matrix and around grain boundaries can also provide nucleation sites for the nano-precipitates and then these nano- sized β'-Cu4 Ti phases could preferentially nucleates within the matrix and at grain boundaries, directly leading to a significant increase in the number density of nano-precipitates. Ultimately, after 70% hot deformation, many dislocation lines and nano-precipitates can be both formed in the matrix, (Figure 22(a, c, e), and Figure 24(c)). Furthermore, the solid solubility of Ti in the matrix is around 2.33 wt% for the compression, thus, it can be seen that compared to the hot compression condition of 740°C and 0.001 s-1, the Ti concentration of the Cu matrix hot compressed under the condition of 820°C, 0.001 s-1 is much higher, which is mainly resulted from the different precipitation behaviors (forming lamellar β-Cu4 Ti phase at 740°C, while forming nano precipitates at 820°C). In comparison, if the strain rate is increased to 1 s-1, the number density of dislocations can be rapidly increased with the increase of hot deformation and after hot deformation 70%, the produced dislocations can be tangled with each other to form dislocation cells (Figure 23(a) and Figure 24(d)). However, according to the SEM and TEM results, although many dislocation lines can be formed and provide nucleation sites for the nano-phases, these nano-precipitates do not have sufficient time to rapidly nucleate and grow due to the higher strain rate. Additionally, due to the absence of lamellar β-Cu4 Ti phase or nano-sized precipitates, the solid solubility of Ti in the matrix is around 3.1 wt%, which directly reduce the coordinated deformability of Cu-Ti alloy.
Deformation mechanism
Considering the fact that the poor hot workability severely restricts their wide applications. Therefore, it is imperative to reveal the related deformability mechanism to further greatly enhance the coordinated deformability of Cu-Ti alloys. According to the obtained processing maps, the appropriate thermomechanical processing conditions of the Cu-3.18 wt% Ti alloy are mainly distributed in the domains of 740-770°C, 0.001-0.011 s-1. The excellent hot workability of the alloy is mainly attributed to the synergistic effects of suitable DRX and dynamic precipitation. And a detailed model diagram of deformation mechanisms can be seen in the Figure 25. From it, it can be found that for the condition of 740°C, 0.001 s-1, the hot deformability can be improved after the formation of the lamellar β-Cu4 Ti phases even the occurrence of dynamic recrystallization with higher difficulty at this lower temperature as shown in Figures 16 and 17. The appearance of lamellar β-Cu4 Ti phases can greatly improve the coordinated deformability of the Ti alloys due to the dislocations easily slipping in the micro-areas of lower Ti concentration around lamellar β-Cu4 Ti phases. Besides the effect of precipitates formed during the hot compression, the formed DRX grains also give a great influence on the hot deformability. For example, some fine-equiaxed grains can be formed and distributed along the initial grain boundaries of alloys during the hot compression under the condition of 740°c and 0.001 s-1, as shown in Figures 16 and 17, which also gives a positive impact on the enhancement of hot deformability and the mechanism should be mainly attributed to the hetero-deformation induced hardening. Ultimately, with the help of occurrence of DRX and formation of lamellar β-Cu4 Ti phases, the Cu-3.18 wt% Ti alloy exhibits the excellent hot deformability under the condition of 740°C, 0.001 s-1 (Figures 14 and 15). In comparison, if the strain rate is increased to 1 s-1, no lamellar β-Cu4 Ti phases can be formed and only spherical β-Cu4 Ti phases appear in the matrix and these precipitates do not have sufficient time to rapidly grow. Thus, the solid solubility of Ti in Cu matrix is significantly increased. Ultimately, an increase in strain rate directly results in the occurrence of dislocation entanglement and formation of many dislocation cells. And the increase in solid solubility of Ti in the matrix leads to severe lattice distortion, which further restricts the movement of dislocations, ultimately decreasing the coordinated deformability of the Cu-3.18 wt% Ti alloy. Additionally, with the increase of strain rate, the volume fraction of dynamically recrystallized grains is rapidly decreased, while the value of deformed microstructure and substructure are significantly increased. Therefore, under the condition of 740°C, 1 s-1, the deformed microstructure and substructure are the main microstructure characteristics (Figure 17). Ultimately, these two factors directly result in the poor coordinated deformability of the alloy, and the appearance of micro-cracks after hot deformation under the condition of 740°C and 1 s-1, (Figure 15(j)). Consequently, effectively controlling and utilizing lamellar β-Cu4 Ti phases is beneficial to enhance the coordinated deformability of the alloy hot deformation at the lower temperature, such as around 740°C.
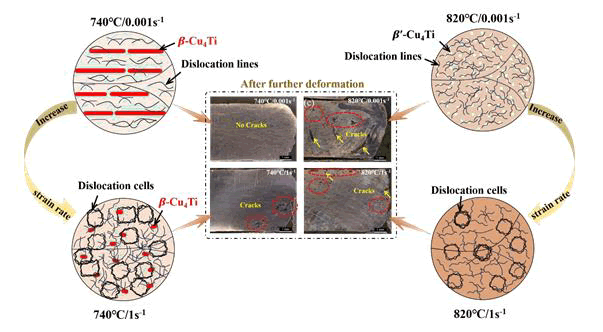
Figure 25. Model diagram of deformability mechanism of the alloy under different deformation conditions.
As the temperature is further increased to 820°C with a strain rate 0.001 s-1, many nano-precipitates can be found in the matrix due to the longer deformation time. With the increase of deformation, these formed nano-precipitates can further restrict the movement of dislocation during hot deformation process, leading to the formation of dislocation lines. Moreover, these dislocations within the matrix and grain boundaries can also provide stored energy for precipitation of nano-phases and much more nano-precipitates can be preferentially nucleated within the matrix and at grain boundaries, leading to a significant increase in the number density of nano-precipitates. Ultimately, serious dislocation pileup will inevitably lead to formation of microcracks even the occurrence of DRX and decrease in the hot deformability of the alloy (Figure 15), which is consistent with the predicted results of workability maps in Figure 14. In comparison, if the strain rate is increased to 1 s-1, no precipitates can be formed in the matrix and the alloy matrix becomes a solid solution with very high concentration of Ti. The solid solubility of Ti in the matrix has been further increased to 3.1 wt%, which further leads to an increase of number density of dislocations. Additionally, the size of DRX grains is smaller and many dislocations can be generated rapidly, which can be entangled to form dislocation cells during the hot deformation. Finally, lots of dislocation cells result in the reduced hot deformability of the alloy, (Figures 14 and 25). It is worth noting that, according to the stability regimes (Figure 14), only as the ε is increased to 1.1, a smaller stability regime can be seen for the hot compression condition of 820°C, 1 s-1. Therefore, without the appearance of lamellar β-Cu4 Ti phases, even though dynamic recrystallization has been occurred, the hot deformability of the alloy is still poor. Accordingly, the hot deformability of the alloy can only be effectively enhanced by coupling control of DRX and dynamic precipitation.
• Both peak stress and strain hardening rate are increased with the decrease of temperature or increase of strain rate; the hot deformation constitutive equation related to the strain rate, peak stress and temperature is established as follows: ��Ã? =��44.3 â?? [sinh(0.0105��]]4.192 â?? exp (− 430900). 8.314��
• The processing maps of the Cu-3.18 wt% Ti alloy were obtained by merging efficiency maps and instability maps; the appropriate thermomechanical processing condition of the Cu-3.18 wt% Ti alloy is distributed in the domains of 740-770â??, 0.001-0.011 s-1, the optimized hot deformation condition is well verified through hot-rolling experiments.
• The evolution mechanism of grain structure of the Cu-3.18 wt% Ti alloy during the hot deformation has been put forward in this work; with the decrease of strain rate from 1 s-1 to 0.001 s-1, the DRX mechanism of the alloy should be changed from the CDRX mechanism to the DDRX mechanism.
• The evolution mechanism of precipitates and solid solubility of Ti in the matrix of the Cu-3.18 wt% Ti alloy under different hot deformation conditions has been put forward based on the detailed microstructure characterization.
• The deformability mechanism of the Cu-3.18 wt% Ti alloy during the hot-deformation has been established in this work, in which the hot deformability of the alloy can only be effectively improved by coupled control of DRX and dynamic precipitation.
The authors declare that they have no known competing financial interests or personal relationships that could have appeared to influence the work reported in this paper.
This work was supported by the National Natural Science Foundation of China (Nos. 52371016, 51871029, 51571023 and 51301016) and the Beijing Natural Science Foundation (No. 2172038).