Keywords
|
| Fuzzy Logic System, Marginal Cost, Private Power vendors, Historical prices, Load demand , time series model. |
INTRODUCTION
|
| In economic terms, electricity (both power and energy) is a commodity capable of being procured, sold and traded. An electricity market is a system for effecting acquisition, through bids to buy; sales, through offers to sell; and short-term trades, generally in the form of financial or agreement swaps. Bids and offers use supply and demand principles to set the price. Long-term trades are commitment similar to power purchase agreements and generally considered private bilateral transactions between counterparties. Wholesale transactions (bids and offers) in electricity are typically cleared and settled by the market operator or a special-purpose independent entity charged exclusively with that function. Market operators do not clear contracts but often require knowledge of the exchange in order to maintain generation and load balance. The products within an electric market generally consist of two types: power and energy. |
| Two highly accurate yet efficient price forecasting tools based on time series analysis: dynamic regression and transfer function models were discussed. In conclusion Price predictions obtained for the Spanish and Californian electricity markets are accurate enough to be used by producers and consumers to prepare their corresponding bidding strategies [1]. |
| This paper analyzes the feasibility of direct current for the supply of offices and commercial facilities. This is done by analyzing a case study, i.e. the supply to the Department of Electric Power Engineering, Chalmers University of Technology, and Gothenburg, Sweden. Voltage drop calculations have been carried out for different voltage levels. A backup system for reliable power supply is designed based on commercially available batteries. Finally, an economic evaluation of AC versus DC is performed and protection of the proposed system is briefly addressed [2]. |
| This paper proposes an ac-linked hybrid wind/photovoltaic (PV)/fuel cell (FC) alternative energy system for stand-alone applications. Wind and PV are the primary power sources of the system, and an FC–electrolyzer combination is used as a backup and a long-term storage system. An overall power management strategy is designed for the proposed system to manage power flows among the different energy sources and the storage unit in the system. A simulation model for the hybrid energy system has been developed using MATLAB/Simulink. The system performance under different scenarios has been verified by carrying out simulation studies using a practical load demand profile and real weather data [3]. In a restructured power system with hybrid market structure, production companies and customers trade electricity and reserve either through a centralized power pool or by bilateral contracts based on their price and reliability offers and requirements. This results in deadlock in price and reliability management of such power systems. This method proposes predicted prices for the bilateral customers in a hybrid power market. In these techniques, a price predictor model is developed and a predicted price values are obtained for the market participants. The main objective of power system restructuring and deregulation is to introduce competition in the power industry and provide more choices to market participants in the way they trade electricity and ancillary services. |
| Electricity pricing is not a major problem in a conventional power system due to similar price regulation and vertically integrated system structure. Electricity pricing has become an important issue in a restructured system due to different customer locations and choices on price and reliability. A lot of research has been done to evaluate electricity prices. Prices in a deregulated power system are also under the great uncertainty due to the random nature of system failures and demand. Inadequate generation and transmission congestions caused by random failures may result in the extreme price volatility or “price spikes”[11]. Also, the stable operation of both AC and DC grids [8] under variable supply and load conditions when the hybrid grid operates in grid tied and islanding mode is maintained coordination control schemes. |
SYSTEM MODEL
|
A. TIME SERIES ANALYSIS
|
| The information recovery process in time series analysis uses historical observations to derive estimates of current and future values of the dependent variable. In particular, the constant variance condition for homoskedastic does not hold in heteroskedastic condition. Our research has found that the generalized heteroskedastic error specification is strongly supported by the daily electricity price data applied in this work. This specification significantly improves both goodness of fit and out-of-sample predictive ability to estimate energy price movement. |
| The general form proposed to model the (price, demand) transfer function [1] is |
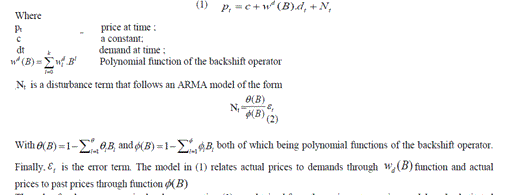 |
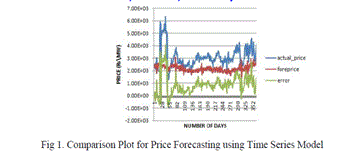
| The value for the parameters in the above equation (1) are obtained from the various steps using matlab and substituted in the equation. The prediction performance is analyzed using MAPE. The comparison plot for actual price value, predicted price value and error value is shown in the figure no.1 |
B. PRICE PREDICTOR SYSTEM
|
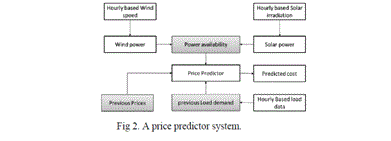
| A price predictor system is proposed to realize the formulated day-ahead electricity price forecasting and monitoring system. This system integrates Fuzzy Inference System and market power measures as shown in Figure 2. |
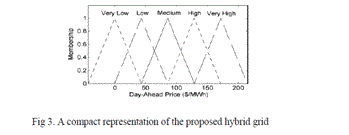
| In the proposed method, the price predicted system consists of three subsystems; Power availability, Previous prices (i.e., Historical Prices) and Previous load demands i.e., Zonal Area Loads. Intelligent systems are featured by adaptability and machine learning capability. In the literature, they are applied to power markets for bidding optimization, load forecasting, risk management, and price forecasting. An FIS performs input-output mapping based on fuzzy logic. Fuzzy logic evaluates the intermediate states between discrete crisp states and is able to handle the concept of partial truth instead of absolute truth. Fuzzy membership functions compose of fuzzy sets of input and output variables. Figure 3 shows an example of fuzzy membership functions of day-ahead prices. |
| FIS allows users to visualize the heuristic knowledge while at the same time providing adequate numerical performance. A common framework called the fuzzy rule base is constructed to combine both numerical and linguistic information. The numerical information is sampled from measurements, and the linguistic information interprets the numerical information. Besides numerical information, e.g., historical prices and load demands, FIS is able to include such linguistic factors as temporal indexes of week day and hour. |
| FIS provides a transparent linguistic rule base instead of a black box. The rules may be modified manually to include expert knowledge. The rule base provides FIS the advantage of interpretability and transparency. FIS also provides flexibility in choosing predefined membership functions. In FIS, the inputs and outputs are referred to as antecedents and consequents, respectively. The rule base can be visualized as an array with rows of rules and columns of variables. Each generated rule is filled with membership function values of variables.Table 1. provides an example of linguistic rule base in a simplified FIS price forecasting. |
| The FIS algorithm can be modified for higher accuracy and efficiency. Finally, the more the membership functions are predefined, the finer each rule is. However, some finer rules may not be generated due to insufficient training data. Therefore, the selection of numbers of membership functions is a trade-off between refining and sparseness. Although the proposed method is heuristic, its process is systematic. |
| The correlations between potential input variables and the output variable are calculated. Then input variables and their membership functions are initially set. These parameters are experimentally tuned by adding and/or dropping variables and changing the number and shape of membership functions. The criterion of fine tuning is the reduction of forecasting errors. As a result, different input variables and membership functions may be selected for different data sets. |
| Marginal Cost Price for the past year has been taken and it is scheduled for every 3 hours. The output from the fuzzy logic is given to the scope and the predicted cost is obtained. By this method, we can easily attain the predicted cost of the power which has been used for the future reference. It is useful to estimate and compare the market prices with the predicted price. Market participants can able to fix the tomorrowâÃâ¬ÃŸs price based on the values attained by the fuzzy logic system. |
C. MODELLING OF FUZZY INFERENCE SYSTEM
|
| A fuzzy inference system (FIS) is a system that uses fuzzy set theory to map inputs (features in the case of fuzzy classification) to outputs (classes in the case of fuzzy classification) [11]. FIS uses a collection of fuzzy membership actions and rules, instead of Boolean logic, to reason about data. The rules in FIS (sometimes may be called as fuzzy expert system) are fuzzy production rules of the form: |
| if p then q, where p and q are fuzzy statements. |
| For example, in a fuzzy rule if x is low and y is high then z is medium. Here x is low; y is high; z is medium are fuzzy statements; x and y are input variables; z is an output variable, low, high, and medium are fuzzy sets. The antecedent describes to what degree the rule applies, while the conclusion designates a fuzzy function to each of one or more output variables. Most tools for functioning with fuzzy expert systems allow more than one closure per rule. The set of rules in a fuzzy expert system is known as knowledge base. In the process of fuzzification, enrolment functions defined on input variables are applied to their actual values so that the degree of truth for each rule premise can be determined. Fuzzy statements in the antecedent are resolved to a degree of membership between 0 and 1. If there is only one part to the precedent, then this is the degree of support for the rule. If there are multiple parts to the precedent, apply fuzzy logic operators and resolve the antecedent to a single number between 0 and 1. Fuzzy inference systems have been successfully applied in fields such as automatic control, data classification, decision inquiry, expert systems, and computer vision. Because of its multi-punitive nature, the fuzzy inference system is known by a number of names, such as fuzzy-rule-based structure, fuzzy expert system, etc.., |
| Fuzzifier will converts the crisp input to a linguistic variable using the membership functions stored in the fuzzy knowledge base. Using If-Then type fuzzy rules, Inference will convert the fuzzy input to the fuzzy output. Defuzzifier will converts the fuzzy output of the inference engine to crisp using membership functions analogous to the ones used by the fuzzifier. |
| The rule base and the database are jointly referred to as the knowledge base.A rule base containing a number of fuzzy IF–THEN rules and a database which defines the membership functions of the fuzzy sets used in the fuzzy rules [11]. |
D. MODELING OF INPUT SIGNALS: ZONAL AREA LOAD
|
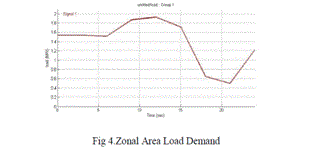
| The Zonal Area Load demand has been taken from the various industries in india . ThecompanyâÃâ¬ÃŸs one day consumption has been taken for every 15 minutes in a day. Then the obtained data is averaged in 3 hours interval for one day. This is to minimize the number of rules framed in the Fuzzy Inference System. These data are given as a one input for the Fuzzy Inference System. The data can be converted into appropriate signals by using the Signal Builder in the Matlab. Figure 4 shows the Zonal Area Load signal that has been given to the Fuzzy Inference System. |
E. AVAILABILITY OF WIND AND SOLAR
|
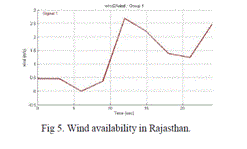
| The Market price will also varies by the availability of the sources with the supplier and zonal area load demand with the consumer. The availability of the wind and solar will varied from place to place and time to time. So, the previously available data of wind availability and solar availability were taken from the different sources. The availability of wind in area1 has been taken from the website[6]. The wind speed data is available for every 15 minutes in the website[6]. The data were collected and it has been averaged for every 3 hours interval. This is to minimize the number of rules framed in the Fuzzy Inference System. The averaged data were modeled [3] using signal builder in Simulink, Matlab. Based on this signal the Fuzzy Linguistic Rules will be framed. |
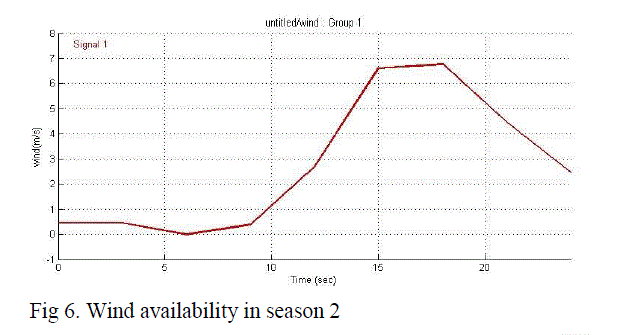
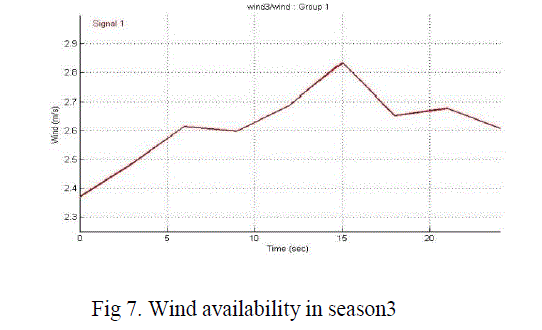
| Figure 5 shows the availability of wind obtained by the website[6]. The average value of wind for every 3 hours in a day was modeled in the Figure 7 But the wind availability canâÃâ¬ÃŸt be predicted. So, the wind availability has varied to different values. Hence, the proposed method will work for different input values. Figure 6 & Figure 7 shows the different values of wind availability as a signal. |
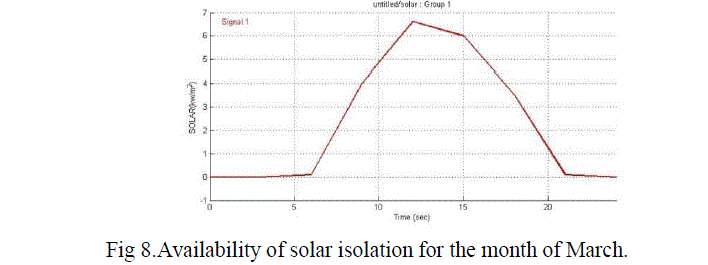
| The availability of solar isolation in area1 has been taken from the website [4]. The solar isolation peak value for every month was given in the website[4]. Fig8 shows the availability of solar isolation for the month of March. The peak value for the month of March is taken as 6.64 kwh/m2. |
F.HISTORICAL PRICES
|
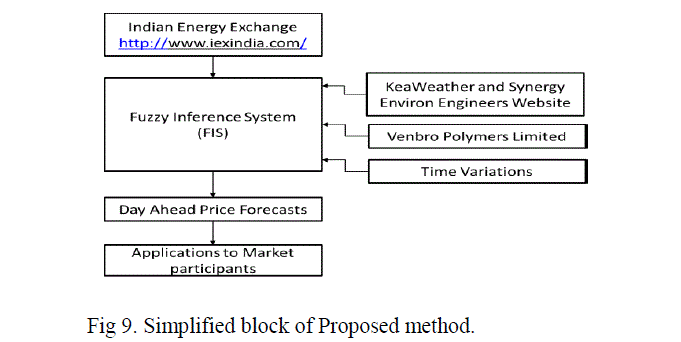
| The FIS must have an output values which are based on the historical prices. The previous historical price values were taken from the website [5] .By this data, output membership functions was created and the Fuzzy Linguistic Rules were framed. Figure 9 shows the simplified block of the proposed method. |
SIMULATION RESULTS
|
| The simulation outputs for the price predictor system under various sources and load demand conditions are discussed in this section. |
A.PRICE PREDICTOR
|
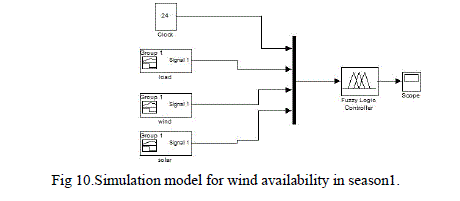
| The simulation model for the price predictor is shown below. The simulation model for wind availability season1 is shown in Figure 10. |
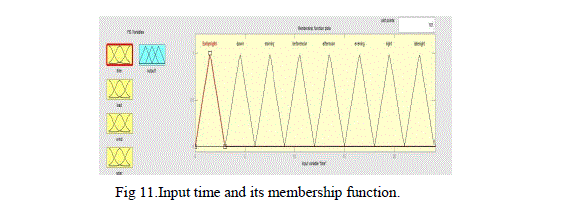
| The zonal area load demand, availability of solar and wind is given as a signal to the mux. The clock signal is added to the demux, because the proposed method will produce the output for 24 hours in a day. So, the clock will generate a time period of 24 hours. Based on the time values, the three inputs were compared and added by the mux. In the Fuzzy Logic Controller, 8 triangular membership functions were created for every four inputs and these membership function will decide the range of the input values. The input time has been divided into 8 membership function. This is shown in Figure 11. |
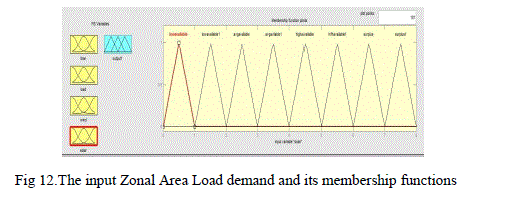
| Similarly, the input Zonal Area Load demand is divided into 8 membership functions according to data taken from the various industries. Their peak load demand value decides the maximum range of values for the membership function. Here, 2 MW is taken as a maximum range of value for the membership function. Figure 12 shows the input Zonal Area Load demand and its membership functions. Here, there are eight triangular membership functions are used for the load demand input. |
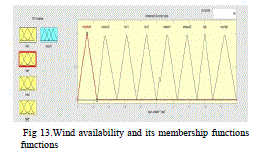
| Figure 13 shows the input wind speed in area1 and its membership functions. Based on the data taken from the website[6], the maximum range of values for the membership function is 8 km/hr and it is divided into 8 triangular membership functions. |
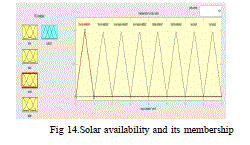
| Figure 14 shows the availability of solar in area1 for the month of March. These data is taken from the Website[4]. The maximum range of value is taken as 8 kwh/m2 and it has been divided into 8 triangular membership functions. |
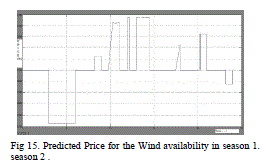
| The predicted price can also be varied by the availability of sources. So, the proposed method have to work in different wind availability data or solar availability data. The values of wind availability is taken as three different set of values. One is taken from the website[6] and remaining two set of values has been changed according to the previous wind availability data. Hence, there are three set of predicted price is taken from the price predictor as a waveform. Then, these values are compared with the previous values. |
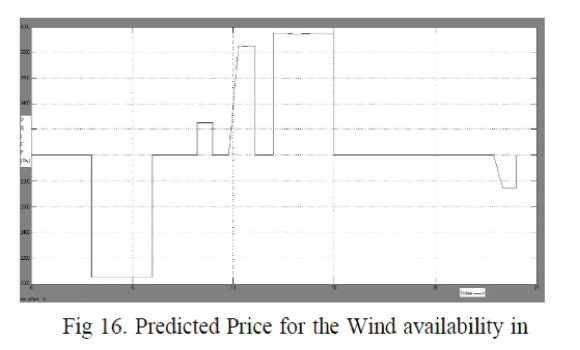
| Figure 15 shows the Predicted price for the wind availability data season1. Here, the predicted price is obtained for a 24 hours in a day as rupees. This data has been used to fix the marginal cost price for the market participants in the power market. So, the future values can be predicted by using the price predictor system. Similarly, the Figure 16 shows the predicted price for the wind availability data season 2 |
| Comparing the Figure 15 and Figure 16 the predicted price has been varied based on the different wind availability data. So, the proposed method can work in different set of source availability. |
| The different predicted price values are listed in Table 2. according to the time. Hence, 24 hours in a day can be divided into 3 hours and the predicted values are shown for every 3 hours interval. Comparison for predicted price and previous price values are shown in the Table 3. Because of using the Fuzzy Logic Controller, the predicted price will not be an decimal value and it is an approximate value as compared with the previous value. |
B.Performance Analysis
|
| As for the measure of forecasting accuracy, the most widely used index is the Mean Absolute Percentage Error (MAPE). However, when used in its present form for electricity price forecasting, MAPE could create errors because of the perceived behavior of electricity price For instance, the price of electricity can rise to tens of or even hundreds of times its normal value during some periods, or drop to zero and even to negative values in other periods. Accordingly, MAPE could reach the extreme values in those cases. To determine the error, the Mean Absolute Percentage Error (MAPE) are used. |
 |
| From the above obtained MAPE results for Price Forecasting it is observed that the percentage of Error for the Predicted Price is comparatively less in Fuzzy Model for our collected data |
CONCLUSION
|
| The proposed method shows that Marginal Cost Price for the past year has been taken and it is scheduled for every 3 hours. The output from the fuzzy logic is given to the scope and the predicted cost is obtained as a signal. By this method, we can easily attain the predicted cost of the power which has been used for the future reference. It is useful to estimate and compare the market prices with the predicted price. Market participants can able to fix the tomorrowâÃâ¬ÃŸs price based on the values attained by the fuzzy logic system. |
| Fuzzy Inference System provides transparency and interpretability. As a result, this forecasting system has the advantages of accuracy and explicit reasoning. Neighboring load demands and day-ahead transmission constraints are included in the inputs to improve the forecasting accuracy because of their significant correlations with day-ahead LMPs. Besides their applications to market participants, day-ahead price forecasts are also useful to market operatorsâÃâ¬ÃŸ forecasting of market power indices. From the above obtained MAPE results for price forecasting it is observed that the percentage of error for the predicted price is comparatively less in Fuzzy model for collected northern data Our future work will focus on how to improve short-term electricity price forecasting. Improvements can be achieved by involving more significantly correlated information in the inputs, generating volatility information in the output, and extending the applications to other market power measures. In future work, the load demands and sources of various regions will be taken and the predicted price will be calculated. |
Tables at a glance
|
 |
 |
 |
 |
| Table 1 |
Table 2 |
Table 3 |
Table 4 |
|
| |
Figures at a glance
|
 |
 |
 |
 |
| Figure 1 |
Figure 2 |
Figure 3 |
Figure 4 |
|
 |
 |
 |
 |
| Figure 5 |
Figure 6 |
Figure 7 |
Figure 8 |
|
 |
 |
 |
 |
| Figure 9 |
Figure 10 |
Figure 11 |
Figure 12 |
|
 |
 |
 |
 |
| Figure 13 |
Figure 14 |
Figure 15 |
Figure 16 |
|
| |
References
|
- Nogales F. J., Contreras J., Conejo A. J., & Esp´Ãâñnola, “Forecasting next-day electricity prices by time series models”, IEEE Trans on Power Syst.Vol 17, no. 2, pp. 342–348, R.,(2002 May).
- AmbraSannino, Giovanna Postiglione, and Math H. J. Bollen , “Feasibility of a DC Network for Commercial Facilities”,IEEE Transactions on industry applications, VOL. 39, NO. 5, pp. 1499 – 1507, (2003).
- Caisheng Wang, M. Hashem Nehrir “Power Management of a Stand-Alone Wind/Photovoltaic/Fuel Cell Energy System”, IEEE Transactions on energy conversion, vol. 23, no. 3, pp. 957 – 967, (2008).
- Website (http://www.synergyenviron.com/).
- Website (http://www.iexindia.com/).
- Website(http://www.accuweather.com/).
- G.W. Dekker, J. Frunt, W.W. de Boer “Case Studies and Results of the E-Price Approach in Power Systems”, 10 th International Conference on the European Energy Market (EEM), vol. 22, no. 3, pp. 1620 – 1627, (2013).
- Gerald Thomas Heydt, Badrul H. Chowdhury “Pricing and Control in the Next Generation Power Distribution System”, IEEE Transactions On Smart Grid, Vol. 3, No. 2, pp. 2 – 10, (2012).
- Guang Li, Chen-Ching Liu “Day-Ahead Electricity Price Forecasting in a Grid Environment”, IEEE Transactions on power systems, vol. 22, no. 1, pp. 1315 – 1327, (2007).
- Kuang Yin and Luo Gang “Model of Forecasting System Marginal Price for Power Market in South western China”, IEEE Int. Conf. Power and Energy Engineering Conference., Mar. 2009, pp. 290–294, (2009).
- Yi Ding and Peng Wang „Reliability and Price Risk Assessment of a Restructured Power System with Hybrid Market StructureâÃâ¬ÃŸ, IEEE Trans. Power System, vol. 21, no. 1, pp. 2475–2483(2006).
|

