Research & Reviews: Journal of Engineering and Technology
ISSN: 2319-9873
ISSN: 2319-9873
Donya Sheikhi*
Department of Railway Engineering, Iran University of Science and Technology, Tehran, Iran
*Corresponding Author:
Received: 15-Sep-2023, Manuscript No. JET-23-113871; Editor assigned: 19-Sep-2023, PreQC No. JET-23-113871 (PQ); Reviewed: 03-Oct-2023, QC No. JET-23-113871; Revised: 04-Feb-2025, Manuscript No. JET-23-113871 (R); Published: 11-Feb-2025, DOI: 10.4172/2319-9873.14.1.002
Citation: Sheikhi D. Design and Development of Object Controllers Risk Assessment Tool. RRJ Eng Technol. 2025;14:002.
Copyright: © 2025 Sheikhi D. This is an open-access article distributed under the terms of the Creative Commons Attribution License, which permits unrestricted use, distribution and reproduction in any medium, provided the original author and source are credited.
Visit for more related articles at Research & Reviews: Journal of Engineering and Technology
Railway signaling systems as safety-critical systems, must be developed according to some specified safety principles denoted in CENELEC standards to obtain the desired level of safety and reliability. The Interlocking system functions as the 'brain' of railway signaling, authorizing trains to travel along designated safe routes under specific conditions, ensuring no risk of collision. Object Controllers (OCs), functioning as interlocking subsystems, are responsible for controlling and managing field elements such as signals, points, track circuits, and other critical controllable objects. OC boards are composed of hardware and software subsystems that should be designed by relevant railway safety standards such as EN50129 and EN50126. This paper focused on a test platform developed to accelerate the design and development life cycle process of OCs. In this tool, by importing system architecture, identification and assessment of risks using the FMEA method are processed. Finally, the reliability of the subsystems and the whole system is calculated.
Railway signalling; Object controllers; Risk assessment; Failure rate; Reliability
While the number of collisions in railway transport networks is low compared to roadways, the potential for injury, loss of human life, and damage to railway rolling stock and infrastructure can be catastrophic. This highlights the paramount importance of safety in train movements.
A track circuit is the electrical trackside element that detects the absence of a train on a track section. This data is the basic information for setting a conflict-free route in overlap and flank protection areas for the signaling system. An electric current runs through a power supply at one end of a section, rails, and a relay at the other end. When a train enters the section, the relay drops out due to the lower resistance of the train axles than the relay, which informs the signaling system that there is a train (Figure 1).

Figure 1. A track circuit element with its subsystems.
The first track circuit based on DC technology was invented in the 19th century. With the development of advanced technologies, the next generations of track circuits (e.g., AC, pulse, and AF track circuits) were developed, but the basic principle for train detection has remained the same [1]. Each track circuit is controlled by equipment known as the Object Controller (OC), which both controls and monitors its related wayside elements, transmitting this data to the interlocking system. Each OC contains common components that can be categorized into at least 14 blocks, which should be designed according to safety standards due to their safety-critical nature. These sub-section blocks include the processing part, linear/switching power supplies, data transferring block, connectors, self- test, object monitoring part, etc.
Since the main cost of a system’s design and development life cycle is related to the decisions made during the design phase, OC’s safe and standardized design and development and reliability analysis are essential during these processes. In this research, a tool for evaluating object controller boards (here a typical track circuit OC board has been chosen to be tested) with the ability of extracting the system architecture, risk assessment using the FMEA method, and calculate the reliability of the equipment is developed.
The term reliability, usually denoted by R, is a product characteristic that is expressed by the probability that the product/system performs the required task under certain conditions for a specific period without failure [2]. As the complexity of electronic systems increases, it becomes more difficult to achieve a high order of reliability [3]. The reliability of each electronic system can be discussed as a bathtub failure rate curve, as shown in Figure 2, which is composed of three steps infant mortality, normal life, and wear-out.

Figure 2. Bathtub failure rate curve.
Enhancing the reliability of railway signaling systems to prevent potential breakdowns is crucial in averting collisions/accidents that could lead to passenger injuries during system operation [4]. Risk management is an integral part of project success, involving a process that aids in early identification of potential issues, enabling the implementation of necessary measures to prevent these from evolving into critical problems and future project concerns. Risks should be evaluated based on their probability of occurrence and consequences. It is important to assess the consequences of risk in terms of cost, planning, and technique, as well as to choose the outcome that can have the greatest impact. Today, railway signaling systems are verified using standardized methods such as Primary Hazard Analysis (PHA), Failure Modes and Effects Analysis (FMEA), and Fault Tree Analysis (FTA) [5]. In this research, by evaluating and calculating the level of reliability in the design of high-level systems, a software tool has been designed and developed to facilitate this sensitive process in the life cycle of development and testing of safety-critical systems (Table 1).
| S. no. | Risk management tools | Description |
Potential application |
|---|---|---|---|
| 1 | Basic risk management facilitation methods (Diagram analysis) | It is a simple technique commonly used to structure risk management by gathering or organizing data and facilitating decision-making through flow charts, check sheets, process mapping, and cause-and-effect diagrams. |
Compilation of observations, trends, or other empirical information to support the identification of a variety of less complex deviations, complaints, and defaults. |
| 2 | PHA | Analysis conducted by applying prior experience or knowledge of a hazard or failure to identify future hazards, hazardous situations, and events that might cause harm. This analysis also involves estimating their probability of occurrence for a given activity, facility, product, or system. |
Evaluating existing systems or prioritizing hazards in cases where circumstances prevent the use of a more extensive technique. |
| 3 | FMEA | Evaluate potential failure modes for processes and assess their probable effects on outcomes and/or product performance. |
Evaluate equipment and facilities; analyze manufacturing processes to identify high-risk steps and critical parameters. |
| 4 | FTA | It is a top-down deductive failure analysis that identifies all root causes of an assumed failure or problem. |
Investigate complaints and deviations, understand their root cause, and resolve the issue. |
Table 1. Risk management tools with their description and application.
Failure Mode and Effects Analysis (FMEA) is the most effective and widely used technique for identifying, assessing, and preventing potential hazards in various fields. Many risk analysis models based on FMEA (Failure Mode and Effects Analysis) have been employed to identify, evaluate, and prioritize risks, thereby enhancing the reliability of complex systems [6]. This analysis is a systematic method for identifying and preventing problems in both the product and its processes. This method focuses on preventing defects, increasing safety, and increasing customer satisfaction, and helps the organization identify potential products and process problems and address their causes before they occur. Therefore, risk assessment using the FMEA method provides the capability to identify various causes that have the potential to create destructive conditions and accidents during operational phases. FMEA was first developed by the US military in the 1940’s and became fully used in the mid-1960’s when it was adopted by the National Aeronautics and Space Administration (NASA) in connection with manned space missions [7]. The article [8] can solve safety-related problems using the FMDEA tool and analyzes the advantages of this meta-model in the implementation of the tool along with a case study. In this field, there are tools such as [9] IQ-FMEA and [10] XFMEA that support FMEA. References use both the traditional FMEA model and specific models to automatically generate FMEA tables [11-13].
In this research, an application plan has been developed. After identifying and analyzing errors (causes, effects, mechanisms, and states) using the FMEA method, an automated solution is proposed to reduce life cycle costs and enhance safety and reliability. The tool is implemented in the C# programming language. Within this tool, 14 primary hardware blocks are defined to design the electronic board at a high level. By determining the required blocks in the board's design, along with their reliability levels and redundancies, the FMEA table is generated as the initial output of the software based on the provided information.
In the following, the machine language used to depict the system architecture has been transformed into an integrated model language using the PLANT UML format. Lastly, the calculation of the reliability of individual blocks and the entire system is discussed.
Risk assessment analysis
Safety is the ability of a system to help avoid injuries and minimize the occurrence of hazards or other unacceptable consequences when using that system. Safety assessment should consider the following two aspects: Safety when the system is energized and working properly; and safety when the system or a part of it fails or experiences an error. The first aspect deals with accident prevention, for which there are several national and international laws. The second aspect involves specialized safety assessment using the same tool related to accessibility, which is examined in five steps: Identification of important risks, identification of their causes, determination of their effects, classification of these effects, and examination of possibilities to prevent the risk or at least reduce their effects [14].
Safety systems play a crucial role in establishing a safe environment for train movement within the rail network. Around 1900, train safety was ensured through mechanical interlocking systems. Since then, these safety-critical systems have evolved, giving rise to complex electronic interlocking systems [15]. In such systems, both safety and reliability concepts should be considered. Safety assurance involves testing actions that enable the component to be in a safe state under failure conditions (fail-safe behavior), while reliability assurance addresses actions to minimize the total number of failures. In this regard, a significant amount of research has been conducted. Article [16] focused on risk assessment at the levels of design, development, and maintenance of railway signaling subsystems. In this paper, safety analysis has been performed in a limited manner based on the characteristics of the system’s framework. However, modifications are needed in the identification of risk sources and safety assessment modeling for each subsystem. In [17], a developed risk assessment model based on various Slovak railway collision scenarios and system safety management has been presented. By collecting and analyzing accident reports using FTA and ETA techniques, various hazards that can directly lead to loss of life were defined. The paper [18] introduced a methodological approach to enhance the reliability of the railway transportation system by evaluating human errors and failures in rolling stock control systems. It also estimates the probability of human/systemic actions that can prevent events or lead to the occurrence of hazards. This method is based on Failure Modes, Effects, and Criticality Analysis (FMECA) and Human Reliability Analysis (HRA). In [19], a developed FMEA model for the risk prioritization of railway transportation systems was proposed. Initially, the FMEA framework was employed to assess critical and hazardous failure modes and components of the train. Subsequently, the three risk factor values of severity, occurrence, and detectability were evaluated to address uncertainty in the risk assessment for each failure mode.
Due to the complexity of signaling systems architecture and the necessity of adhering to safety and functional requirements outlined in international standards throughout the design, verification, validation, and assessment processes, the lack of integrated tools capable of conducting risk assessment, extracting integrated modeling languages, calculating system reliability, and performing high-level system design in accordance with railway standards becomes evident. In this research, an innovative tool for risk assessment and review of design and safety requirements within the design and development layers of the system architecture has been developed. This tool facilitates the process of evaluating and identifying hazards, severity, and the probability of risks within the designed system. By utilizing the requirements of the EN50129 standard, the tool extracts the FMEA table related to the subsystems or the entire system that has been designed.
Reliability analysis
Qualitatively, the term reliability specifies the probability of no operational interruption occurring during the operation of a system within a certain period. It does not involve any repair processes related to redundancy or duplicate parts. In the present day, complex equipment and systems are expected not only to be fault-free at time t=0 (start-up moment), but also to consistently perform their intended functions for a defined period without experiencing failures, even when critical faults occur [20]. To enhance the system's reliability, potential risks and hazards should be identified during the design phase.
Reference focuses on calculating reliability and providing tools for risk analysis using the Fault Tree Analysis (FTA) method. In, various modeling methods have been employed to calculate the reliability of signaling system trackside equipment, including point machines, track circuits, and signals, as well as the failure rate of the entire system.
Safety standards, such as MIL-HDBK-217F, have been developed based on accepted principles, allowing designers to create systems with high precision. Given the complexity of reliability calculations in complex series-parallel systems, the tool presented in this paper offers the capability for automatic reliability assessment at both the subsystem and whole system levels. The RBD method has been utilized to calculate the failure rate and reliability of the system and its subsystems. In accordance with the requirements of EN50128 and EN50129 standards for implementing the system verification process using a formal method, the high-level system design provided by the designer is transformed using the tool produced in the form of an integrated modeling language (PLANT UML). Consequently, the reliability of the system and its subsystems has been calculated through the drawing of subsystem mappings in the form of block diagrams. The connections and dependencies between these subsystems are depicted using the integrated modeling language. This approach utilizes the architectural and series/parallel structure of the blocks, along with the MTBF (Mean Time between Failures) values, to enhance the system's safety. The integration of all these functionalities into a software platform renders the production tool distinctive (Figure 3).

Figure 3. The proposed test platform.
This research introduces a tool serving as a testing platform for the design and development of railway signaling object controllers. In line with EN 0126 standards, and to enhance the efficiency and accuracy of calculations within safety-critical systems, certain critical blocks are designed in duplicated forms (Tables 2 and 3). Through the evaluation of these redundant blocks and the abstraction of the system's structure, the developed platform initiates its assessment process. As the subsequent phase, it calculates the overall system reliability level based on the nature of the subsystems' structure (series, parallel, series/parallel). To gauge the accuracy of its performance, the process is executed on a standard track circuit object controller board. The suggested object controller comprises the following subsystems (Figure 4).
| Main processing blocks | Linear/switching power supply |
|---|---|
| Communications blocks (e.g., Ethernet and CAN) | Input/output blocks |
| Indicators | Memory of board (e.g., EEPROM, FLASH) |
| Protection blocks (e.g., arresters, fuses) | Watchdog timer |
| Filters | Switching components (e.g., MOSFETs, Diodes) |
| Operation amplifiers | Sensors |
Table 2. The main hardware blocks of the tested track circuit OC.
| No. | Subsystems | Redundancy types |
| 1 | Power supply | 1001 & 1002 & 1003 |
| 2 | Connector | 1001 & 1002 |
| 3 | Diode | 1001 & 1002 & 2002 |
| 4 | Filter | 1001 & 1002 |
| 5 | Fuse | 1001 & 1002 & 1003 |
| 6 | Current sensor | 1001 & 1002 & 1003 & 2003 |
| 7 | Relay | 1001 & 1002 & 1003 & 2002 & 2003 & 3003 |
| 8 | MOSFET | 1001 & 1002 & 1003 |
| 9 | Logic gate | 1001 & 1002 & 1003 |
| 10 | Resistance block | 1001 & 1002 & 1003 |
| 11 | Opamp | 1001 & 1002 & 1003 |
| 12 | Resistance block | 1001 & 1002 & 1003 |
| 13 | Microcontroller | 1001 & 1002 & 1003 & 2002 & 2003 & 3003 |
| 14 | CAN IC converter | 1001 & 1002 & 1003 |
Table 3. Acceptable structure of the tested board’s blocks.

Figure 4. The tested track circuit board.
Figure 5 illustrates the characteristics of each block and their interrelationships in the format of a class diagram. The test platform employed this information to evaluate risks and compute the reliability of both individual subsystems and the entire system. Any complex system can undergo evaluation through the abstraction of its hardware architecture design and the calculation of reliability for each block and its interconnections with other blocks. The organization of these blocks and their reliability calculation method aligns with one of the models depicted in Figure 5.
Through program execution and the application of necessary inputs, the Failure Modes, and Effects Analysis (FMEA) is generated based on subsystem features such as redundancy values. This enables the designer to attain the intended design by making revisions if necessary (Table 4). The information inputted into the table is derived from the EN50129 standard. As per this standard, the enumerated risks need to be thoroughly examined. A portion of the output is demonstrated in Table 5.

Figure 5. Class diagram of the TC board.
| S. no | Reliability block diagram | Reliability function (RS RS O(t); Ri =Ri(t), Ri(0)=1) |
Remarks | |
|---|---|---|---|---|
| 1. |
|
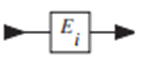
RS=Ri | One item structure , λ(t)=λ⇒R¡ (t)=e¯λit |
|
| 2. | 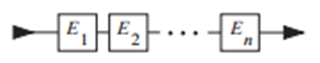 |
 |
Series structure, λs(t)= λ1(t)+...+λn(t) |
|
| 3. | 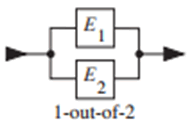 |
RS=R1+R2-R1R2 | 1 out of 2 redundancy , R1(t )=R2(t)=e-λt ⇒Rs (t)=2e- λte-2λt |
|
| 4. | 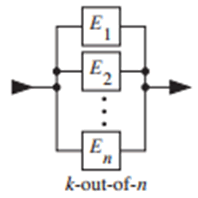 |
 |
K out of n redundancy for k =1 ⇒Rs=1−(1−R )n see p. 44 for E1#.....#En |
|
| 5. | 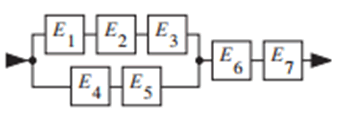 |
RS=(R1 R2 R3 +R4 R5-R1 R2 R3 R4 R5) R6 R7 | Series parallel structure | |
| 6. | 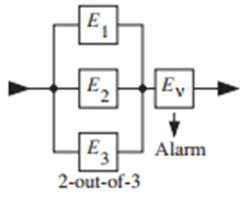 |
E1=E2=E3=E →R1=R2=R3=R RS=(3R²-2R³)RV |
Majority redundancy, general case (n +1) out of (2n+1), n =1,2, .... |
|
| 7. | 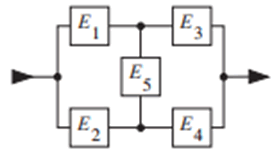 |
RS=R5 (R1+R2-R1 R2 ).(R3+R4-R3 R4)+(1-R5).(R1 R3+R2 R4-R1 R2 R3 R4) | Bridge structure (bi-directional on E5) | |
| 8. | 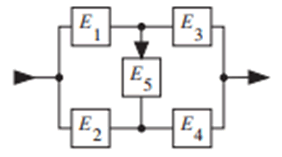 |
RS=R4 [R2+R1 (R3+R5-R3 R5)-R1 R2 (R3+R5-R3 R5)]+(1-R4)R1 R3 | Bridge structure (uni-directional on E5) | |
| 9. | 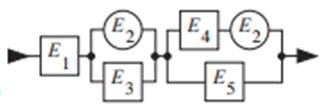 |
RS=R2 R1 (R4+R5-R4 R5)+(1-R2 )R1 R3 R5 | The element E2 appears twice in the reliability block diagram (not in the hardware ) | |
Table 4. Reliability evaluation of simple systems.
| FMEA report |
System: SIG-OC module | Subsystem: Power unit | Date of writing |
|
|||||
|---|---|---|---|---|---|---|---|---|---|
| Code | failure mode | causal factors | imm. eff | sys. eff | IMRI | Recom. Action | FMRI | Comment |
Status |
| FMEA- SIG-P-1 | Open circuit in series elements (Fuse, transformer) | Bad soldering, burning out | Power disconnection | The board power off and become inaccessible | Use a checklist after soldering and making an indicator for power, use redundant power lines, and test points be provided |
|
|||
| FMEA- SIG-P-2 | Short circuit in series elements (Fuse, transformer) | Burning out, rush current, over current | Power disconnection in some cases | The board power off, Ignorance of protection | Use a checklist after soldering and making an indicator for power |
|
|||
| FMEA- SIG-P-3 | Open circuit in parallel elements (capacitors, MOVs, …) | Overvoltage at the input power line, using improper capacitors, poor soldering | Bad filtration of the power signal, weak protection against unusual input signals | The board burnt, change in logic levels, and errors in calculations | Use proper Soldering oil and tin, prepare a checklist for testing elements after soldering, and test points be provided | Test point to be provided for all units of the board |
|
||
| FMEA- SIG-P-4 | Short circuit in parallel elements (capacitors, MOVs, …) | Overvoltage at the input power line, using improper capacitors | The power line became short circuit and fuses will burn | The board power is off and gets damaged, making damage to the power unit | Use capacitors that became open circuit in case of failure, Use redundant power lines | Class Y caps (EN50129) |
|
||
| FMEA- SIG-P-5 | 24 to 5 converters short circuit | Burning out because of high input power | Power off the board | The board became inaccessible and lack of knowledge about the track occupancy | The track should become occupied in the system, use at least an industrial type DC/DC converter, and use proper tolerance for input power, use redundant power lines, appropriate alarms should be sent to the CP and/or maintenance operator, provide an LED indicator for indoor faults |
A specific company or model can be named |
|
||
| FMEA- SIG-P-6 | 24 to 5 converters short circuit | Burning out because of high temperature | Power off the board | The board became inaccessible and lack of knowledge about the track occupancy | The track should become occupied in the system, use at least an industrial type DC/DC converter with higher efficiency, use a heat sink according to the element's heat | A specific company or model can be named (or specific efficiency) |
|
||
| FMEA- SIG-P-7 | 24 to 5 output oscillation | Oscillation at input power, working at out of temperature range | Change in logic levels and get wrong information about the field | IM take the wrong decision and a mishap would occur | Use a DC/DC converter with higher stability and lower ripple, use industrial type | Values can be mentioned |
|
||
| FMEA- SIG-P-8 | 5 to 3.3 converter short circuit | Burning out because of high input power | Power off microcontroller | The board became inaccessible and lack of knowledge about the track occupancy | The track should become occupied in the system, using at least an industrial type DC/DC converter, and using proper tolerance for the input power, using redundant power lines, providing an LED indicator for indoor faults |
|
|||
| FMEA- SIG-P-9 | 5 to 3.3 converter short circuit | Burning out because of high temperature | Power off microcontroller | The board became inaccessible and lack of knowledge about the track occupancy | The track should become occupied in the system, using at least ab industrial type DC/DC converter with higher efficiency, using a heat sink according to the element's heat | Safe mode should be defined for different fail modes and the board should switch to the safe mode in case of a failure |
|
||
| FMEA- SIG-P-10 | 5 to 3.3 output oscillation | Oscillation at input power, working out of temperature range, choosing improper values for related elements | Burning out microcontroller, Troubles happen in data communication | Lack of knowledge about the track occupancy, IM take wrong decisions and mishaps would occur | Using a DC/DC converter with higher stability and lower ripple, using industrial type |
|
|||
| FMEA- SIG-P-11 | Signal 30 v power failure | Input power off | TC out of service | Impossible to set routes which that TC belongs to them | Power supply monitoring, redundant power supply to be provided, providing an LED indicator for indoor faults | For this purpose, the power line should be across the board for being monitorable |
|
Table 5. FMEA evaluation of the power supply block.
Subsequently, the designed tool computes the reliability of both subsystems and the entire system. It achieves this by utilizing the parameter values provided for each element or block, as well as the equations sourced from the MIL-HDBK-217E or F standard. Through an assessment that involves inspecting and categorizing the subsystem's structure in alignment with Table 3, the reliability of the whole system and individual subsystems are then determined. Typically, the architecture of the subsystems follows a series-parallel configuration. As these structures can be assessed by iteratively utilizing outcomes from series and parallel models, the ultimate result is obtained by computing the reliability value of blocks with simpler structures. To demonstrate the efficacy of this approach, consider examining row 5 in Table 4
First step: the series blocks B1-B3 are replaced by B8, B4-B5 by B9, and B6-B7 by B10, yielding the following expression:
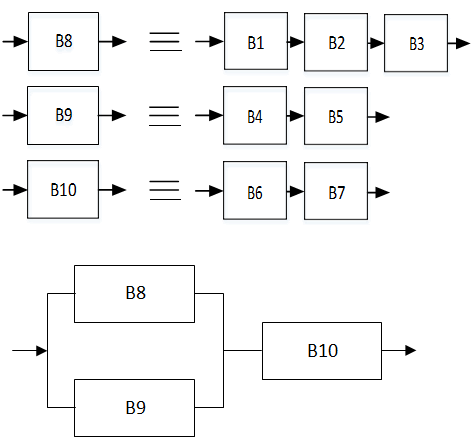
With R8 (t)=R1 (t) R2 (t) R3 (t)
R9(t)=R4(t) R5(t)
R10(t)=R6(t) R7(t) (1)
The second step: the parallel structure of B8-B9 blocks is replaced by B11, and the following expression is obtained:
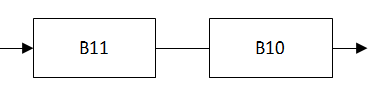
With R11 (t)=R8(t)+R9(t)−R9( t) (2)
Third step: From steps 1 and 2, the system reliability follows as
With RS=RS0 (t), Ri=Ri (t), Ri (0)=1, i=1,….7 (3)
RS=R11R10=(R1R2R3+R4+R5-R1R2R3R4R5)R6R7
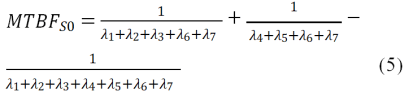
The mean time to failure can be calculated from equation 5. All elements should have a constant failure rate (λ1 to λ7), so:
RSO(t)=e−(λ1+λ2+λ3+λ6+λ7)t+e−(λ4+λ5+λ6+λ7)t+e−( λ1+λ2+λ3+λ4+λ5+λ6+λ7)t (4)
And
PowerSupply1 Reliability=0.98
PowerSupply2 Reliability=0.99
PowerSupply3 Reliability=0.9996
Connector1 Reliability=0.99
Connector2 Reliability=0.9999
Filter1 Reliability=0.99
Filter2 Reliability=0.999
Diode1 Reliability=0.99
Diode2 Reliability=0.99
Mosfet1 Reliability=0.99
Mosfet2 Reliability=0.99
Relay1 Reliability=1
Relay2 Reliability=0.99
Sensor1 Reliability=0.99
Sensor2 Reliability=0.99
Specific1 Reliability=0.9999
Specific2 Reliability=0.996
Res1 Reliability=0.999
Res2 Reliability=0.989
Micro1 Reliability=0.999996
CAN1 Reliability=0.997
CAN2 Reliability=0.999
Opamp1 Reliability=0.989
Opamp2 Reliability=0.99
LogicGate1 Reliability=0.99
LogicGate2 Reliability=0.999
Fuse1 Reliability=0.999
Fuse2 Reliability=0.999973
Relps1=0.9702
Reldi3=0.9801
Relps3=0.999596
Relfil1=0.98901
Relfil2=0.998973
Reldi1=0.9801
Reldi2=0.98901
Relmos1=0.9801
Relmos2=0.98901
Relrel1=0.99
Relrel2=0.9801
Relsen1=0.99
Relsen2=0.9801
RelT22=0.9998
RelT23=0.9959004
RelT25=0.9880111
RelT26=0.97911
RelT31=0.9969003
RelT32=0.995004
RelT34=0.9886044
RelT35=0.989604
RelT37=0.98901
RelT38=0.9880111
RelT40=0.98901
RelT41=0.9899733
Total reliability: 0.9629055
Object controllers, due to their designated tasks involving the control and monitoring of trackside equipment, fall under the category of safety-critical and vital systems. Therefore, the design and development process of these systems should strictly adhere to safety standards and regulations. In this paper, with the aim of streamlining this process, we first review the architecture of OC boards and analytical methods for reliability. Subsequently, we introduce a software platform tool that is designed based on safety and functional standards.
While designing the test platform, the tool extracts the integrated modeling language of the control board plan in the form of PLANT UML by specifying the reliability and redundancy level of each hardware block and their connections. Additionally, it employs the Failure Modes and Effects Analysis (FMEA) method to assess risks and calculate the overall system reliability. This process yields desirable safety and reliability outcomes in alignment with relevant standards. The FMEA analysis proves effective in identifying and preventing potential hazards in both the product and its process. This method contributes to risk reduction, enhances safety, and aids in achieving the desired reliability at the device level.
[Crossref] [Google Scholar] [PubMed]